Zachary, Louisiana Submit your own pictures of this city and show them to the world
OSM Map
General Map
Google Map
MSN Map
OSM Map
General Map
Google Map
MSN Map
OSM Map
General Map
Google Map
MSN Map
OSM Map
General Map
Google Map
MSN Map
Please wait while loading the map...
Population in 2022: 19,916 (82% urban, 18% rural). Population change since 2000: +76.6%Males: 11,191 Females: 8,725
December 2024 cost of living index in Zachary: 90.4 (less than average, U.S. average is 100) Percentage of residents living in poverty in 2023: 7.4%for White Non-Hispanic residents , 12.0% for Black residents , 100.0% for American Indian residents , 1.6% for two or more races residents )
Profiles of local businesses
Business Search - 14 Million verified businesses
Data:
Median household income ($)
Median household income (% change since 2000)
Household income diversity
Ratio of average income to average house value (%)
Ratio of average income to average rent
Median household income ($) - White
Median household income ($) - Black or African American
Median household income ($) - Asian
Median household income ($) - Hispanic or Latino
Median household income ($) - American Indian and Alaska Native
Median household income ($) - Multirace
Median household income ($) - Other Race
Median household income for houses/condos with a mortgage ($)
Median household income for apartments without a mortgage ($)
Races - White alone (%)
Races - White alone (% change since 2000)
Races - Black alone (%)
Races - Black alone (% change since 2000)
Races - American Indian alone (%)
Races - American Indian alone (% change since 2000)
Races - Asian alone (%)
Races - Asian alone (% change since 2000)
Races - Hispanic (%)
Races - Hispanic (% change since 2000)
Races - Native Hawaiian and Other Pacific Islander alone (%)
Races - Native Hawaiian and Other Pacific Islander alone (% change since 2000)
Races - Two or more races (%)
Races - Two or more races (% change since 2000)
Races - Other race alone (%)
Races - Other race alone (% change since 2000)
Racial diversity
Unemployment (%)
Unemployment (% change since 2000)
Unemployment (%) - White
Unemployment (%) - Black or African American
Unemployment (%) - Asian
Unemployment (%) - Hispanic or Latino
Unemployment (%) - American Indian and Alaska Native
Unemployment (%) - Multirace
Unemployment (%) - Other Race
Population density (people per square mile)
Population - Males (%)
Population - Females (%)
Population - Males (%) - White
Population - Males (%) - Black or African American
Population - Males (%) - Asian
Population - Males (%) - Hispanic or Latino
Population - Males (%) - American Indian and Alaska Native
Population - Males (%) - Multirace
Population - Males (%) - Other Race
Population - Females (%) - White
Population - Females (%) - Black or African American
Population - Females (%) - Asian
Population - Females (%) - Hispanic or Latino
Population - Females (%) - American Indian and Alaska Native
Population - Females (%) - Multirace
Population - Females (%) - Other Race
Coronavirus confirmed cases (May 04, 2025)
Deaths caused by coronavirus (May 04, 2025)
Coronavirus confirmed cases (per 100k population) (May 04, 2025)
Deaths caused by coronavirus (per 100k population) (May 04, 2025)
Daily increase in number of cases (May 04, 2025)
Weekly increase in number of cases (May 04, 2025)
Cases doubled (in days) (May 04, 2025)
Hospitalized patients (Apr 18, 2022)
Negative test results (Apr 18, 2022)
Total test results (Apr 18, 2022)
COVID Vaccine doses distributed (per 100k population) (Sep 19, 2023)
COVID Vaccine doses administered (per 100k population) (Sep 19, 2023)
COVID Vaccine doses distributed (Sep 19, 2023)
COVID Vaccine doses administered (Sep 19, 2023)
Likely homosexual households (%)
Likely homosexual households (% change since 2000)
Likely homosexual households - Lesbian couples (%)
Likely homosexual households - Lesbian couples (% change since 2000)
Likely homosexual households - Gay men (%)
Likely homosexual households - Gay men (% change since 2000)
Cost of living index
Median gross rent ($)
Median contract rent ($)
Median monthly housing costs ($)
Median house or condo value ($)
Median house or condo value ($ change since 2000)
Mean house or condo value by units in structure - 1, detached ($)
Mean house or condo value by units in structure - 1, attached ($)
Mean house or condo value by units in structure - 2 ($)
Mean house or condo value by units in structure by units in structure - 3 or 4 ($)
Mean house or condo value by units in structure - 5 or more ($)
Mean house or condo value by units in structure - Boat, RV, van, etc. ($)
Mean house or condo value by units in structure - Mobile home ($)
Median house or condo value ($) - White
Median house or condo value ($) - Black or African American
Median house or condo value ($) - Asian
Median house or condo value ($) - Hispanic or Latino
Median house or condo value ($) - American Indian and Alaska Native
Median house or condo value ($) - Multirace
Median house or condo value ($) - Other Race
Median resident age
Resident age diversity
Median resident age - Males
Median resident age - Females
Median resident age - White
Median resident age - Black or African American
Median resident age - Asian
Median resident age - Hispanic or Latino
Median resident age - American Indian and Alaska Native
Median resident age - Multirace
Median resident age - Other Race
Median resident age - Males - White
Median resident age - Males - Black or African American
Median resident age - Males - Asian
Median resident age - Males - Hispanic or Latino
Median resident age - Males - American Indian and Alaska Native
Median resident age - Males - Multirace
Median resident age - Males - Other Race
Median resident age - Females - White
Median resident age - Females - Black or African American
Median resident age - Females - Asian
Median resident age - Females - Hispanic or Latino
Median resident age - Females - American Indian and Alaska Native
Median resident age - Females - Multirace
Median resident age - Females - Other Race
Commute - mean travel time to work (minutes)
Travel time to work - Less than 5 minutes (%)
Travel time to work - Less than 5 minutes (% change since 2000)
Travel time to work - 5 to 9 minutes (%)
Travel time to work - 5 to 9 minutes (% change since 2000)
Travel time to work - 10 to 19 minutes (%)
Travel time to work - 10 to 19 minutes (% change since 2000)
Travel time to work - 20 to 29 minutes (%)
Travel time to work - 20 to 29 minutes (% change since 2000)
Travel time to work - 30 to 39 minutes (%)
Travel time to work - 30 to 39 minutes (% change since 2000)
Travel time to work - 40 to 59 minutes (%)
Travel time to work - 40 to 59 minutes (% change since 2000)
Travel time to work - 60 to 89 minutes (%)
Travel time to work - 60 to 89 minutes (% change since 2000)
Travel time to work - 90 or more minutes (%)
Travel time to work - 90 or more minutes (% change since 2000)
Marital status - Never married (%)
Marital status - Now married (%)
Marital status - Separated (%)
Marital status - Widowed (%)
Marital status - Divorced (%)
Median family income ($)
Median family income (% change since 2000)
Median non-family income ($)
Median non-family income (% change since 2000)
Median per capita income ($)
Median per capita income (% change since 2000)
Median family income ($) - White
Median family income ($) - Black or African American
Median family income ($) - Asian
Median family income ($) - Hispanic or Latino
Median family income ($) - American Indian and Alaska Native
Median family income ($) - Multirace
Median family income ($) - Other Race
Median year house/condo built
Median year apartment built
Year house built - Built 2005 or later (%)
Year house built - Built 2000 to 2004 (%)
Year house built - Built 1990 to 1999 (%)
Year house built - Built 1980 to 1989 (%)
Year house built - Built 1970 to 1979 (%)
Year house built - Built 1960 to 1969 (%)
Year house built - Built 1950 to 1959 (%)
Year house built - Built 1940 to 1949 (%)
Year house built - Built 1939 or earlier (%)
Average household size
Household density (households per square mile)
Average household size - White
Average household size - Black or African American
Average household size - Asian
Average household size - Hispanic or Latino
Average household size - American Indian and Alaska Native
Average household size - Multirace
Average household size - Other Race
Occupied housing units (%)
Vacant housing units (%)
Owner occupied housing units (%)
Renter occupied housing units (%)
Vacancy status - For rent (%)
Vacancy status - For sale only (%)
Vacancy status - Rented or sold, not occupied (%)
Vacancy status - For seasonal, recreational, or occasional use (%)
Vacancy status - For migrant workers (%)
Vacancy status - Other vacant (%)
Residents with income below the poverty level (%)
Residents with income below 50% of the poverty level (%)
Children below poverty level (%)
Poor families by family type - Married-couple family (%)
Poor families by family type - Male, no wife present (%)
Poor families by family type - Female, no husband present (%)
Poverty status for native-born residents (%)
Poverty status for foreign-born residents (%)
Poverty among high school graduates not in families (%)
Poverty among people who did not graduate high school not in families (%)
Residents with income below the poverty level (%) - White
Residents with income below the poverty level (%) - Black or African American
Residents with income below the poverty level (%) - Asian
Residents with income below the poverty level (%) - Hispanic or Latino
Residents with income below the poverty level (%) - American Indian and Alaska Native
Residents with income below the poverty level (%) - Multirace
Residents with income below the poverty level (%) - Other Race
Air pollution - Air Quality Index (AQI)
Air pollution - CO
Air pollution - NO2
Air pollution - SO2
Air pollution - Ozone
Air pollution - PM10
Air pollution - PM25
Air pollution - Pb
Crime - Murders per 100,000 population
Crime - Rapes per 100,000 population
Crime - Robberies per 100,000 population
Crime - Assaults per 100,000 population
Crime - Burglaries per 100,000 population
Crime - Thefts per 100,000 population
Crime - Auto thefts per 100,000 population
Crime - Arson per 100,000 population
Crime - City-data.com crime index
Crime - Violent crime index
Crime - Property crime index
Crime - Murders per 100,000 population (5 year average)
Crime - Rapes per 100,000 population (5 year average)
Crime - Robberies per 100,000 population (5 year average)
Crime - Assaults per 100,000 population (5 year average)
Crime - Burglaries per 100,000 population (5 year average)
Crime - Thefts per 100,000 population (5 year average)
Crime - Auto thefts per 100,000 population (5 year average)
Crime - Arson per 100,000 population (5 year average)
Crime - City-data.com crime index (5 year average)
Crime - Violent crime index (5 year average)
Crime - Property crime index (5 year average)
1996 Presidential Elections Results (%) - Democratic Party (Clinton)
1996 Presidential Elections Results (%) - Republican Party (Dole)
1996 Presidential Elections Results (%) - Other
2000 Presidential Elections Results (%) - Democratic Party (Gore)
2000 Presidential Elections Results (%) - Republican Party (Bush)
2000 Presidential Elections Results (%) - Other
2004 Presidential Elections Results (%) - Democratic Party (Kerry)
2004 Presidential Elections Results (%) - Republican Party (Bush)
2004 Presidential Elections Results (%) - Other
2008 Presidential Elections Results (%) - Democratic Party (Obama)
2008 Presidential Elections Results (%) - Republican Party (McCain)
2008 Presidential Elections Results (%) - Other
2012 Presidential Elections Results (%) - Democratic Party (Obama)
2012 Presidential Elections Results (%) - Republican Party (Romney)
2012 Presidential Elections Results (%) - Other
2016 Presidential Elections Results (%) - Democratic Party (Clinton)
2016 Presidential Elections Results (%) - Republican Party (Trump)
2016 Presidential Elections Results (%) - Other
2020 Presidential Elections Results (%) - Democratic Party (Biden)
2020 Presidential Elections Results (%) - Republican Party (Trump)
2020 Presidential Elections Results (%) - Other
Ancestries Reported - Arab (%)
Ancestries Reported - Czech (%)
Ancestries Reported - Danish (%)
Ancestries Reported - Dutch (%)
Ancestries Reported - English (%)
Ancestries Reported - French (%)
Ancestries Reported - French Canadian (%)
Ancestries Reported - German (%)
Ancestries Reported - Greek (%)
Ancestries Reported - Hungarian (%)
Ancestries Reported - Irish (%)
Ancestries Reported - Italian (%)
Ancestries Reported - Lithuanian (%)
Ancestries Reported - Norwegian (%)
Ancestries Reported - Polish (%)
Ancestries Reported - Portuguese (%)
Ancestries Reported - Russian (%)
Ancestries Reported - Scotch-Irish (%)
Ancestries Reported - Scottish (%)
Ancestries Reported - Slovak (%)
Ancestries Reported - Subsaharan African (%)
Ancestries Reported - Swedish (%)
Ancestries Reported - Swiss (%)
Ancestries Reported - Ukrainian (%)
Ancestries Reported - United States (%)
Ancestries Reported - Welsh (%)
Ancestries Reported - West Indian (%)
Ancestries Reported - Other (%)
Educational Attainment - No schooling completed (%)
Educational Attainment - Less than high school (%)
Educational Attainment - High school or equivalent (%)
Educational Attainment - Less than 1 year of college (%)
Educational Attainment - 1 or more years of college (%)
Educational Attainment - Associate degree (%)
Educational Attainment - Bachelor's degree (%)
Educational Attainment - Master's degree (%)
Educational Attainment - Professional school degree (%)
Educational Attainment - Doctorate degree (%)
School Enrollment - Nursery, preschool (%)
School Enrollment - Kindergarten (%)
School Enrollment - Grade 1 to 4 (%)
School Enrollment - Grade 5 to 8 (%)
School Enrollment - Grade 9 to 12 (%)
School Enrollment - College undergrad (%)
School Enrollment - Graduate or professional (%)
School Enrollment - Not enrolled in school (%)
School enrollment - Public schools (%)
School enrollment - Private schools (%)
School enrollment - Not enrolled (%)
Median number of rooms in houses and condos
Median number of rooms in apartments
Housing units lacking complete plumbing facilities (%)
Housing units lacking complete kitchen facilities (%)
Density of houses
Urban houses (%)
Rural houses (%)
Households with people 60 years and over (%)
Households with people 65 years and over (%)
Households with people 75 years and over (%)
Households with one or more nonrelatives (%)
Households with no nonrelatives (%)
Population in households (%)
Family households (%)
Nonfamily households (%)
Population in families (%)
Family households with own children (%)
Median number of bedrooms in owner occupied houses
Mean number of bedrooms in owner occupied houses
Median number of bedrooms in renter occupied houses
Mean number of bedrooms in renter occupied houses
Median number of vehichles in owner occupied houses
Mean number of vehichles in owner occupied houses
Median number of vehichles in renter occupied houses
Mean number of vehichles in renter occupied houses
Mortgage status - with mortgage (%)
Mortgage status - with second mortgage (%)
Mortgage status - with home equity loan (%)
Mortgage status - with both second mortgage and home equity loan (%)
Mortgage status - without a mortgage (%)
Average family size
Average family size - White
Average family size - Black or African American
Average family size - Asian
Average family size - Hispanic or Latino
Average family size - American Indian and Alaska Native
Average family size - Multirace
Average family size - Other Race
Geographical mobility - Same house 1 year ago (%)
Geographical mobility - Moved within same county (%)
Geographical mobility - Moved from different county within same state (%)
Geographical mobility - Moved from different state (%)
Geographical mobility - Moved from abroad (%)
Place of birth - Born in state of residence (%)
Place of birth - Born in other state (%)
Place of birth - Native, outside of US (%)
Place of birth - Foreign born (%)
Housing units in structures - 1, detached (%)
Housing units in structures - 1, attached (%)
Housing units in structures - 2 (%)
Housing units in structures - 3 or 4 (%)
Housing units in structures - 5 to 9 (%)
Housing units in structures - 10 to 19 (%)
Housing units in structures - 20 to 49 (%)
Housing units in structures - 50 or more (%)
Housing units in structures - Mobile home (%)
Housing units in structures - Boat, RV, van, etc. (%)
House/condo owner moved in on average (years ago)
Renter moved in on average (years ago)
Year householder moved into unit - Moved in 1999 to March 2000 (%)
Year householder moved into unit - Moved in 1995 to 1998 (%)
Year householder moved into unit - Moved in 1990 to 1994 (%)
Year householder moved into unit - Moved in 1980 to 1989 (%)
Year householder moved into unit - Moved in 1970 to 1979 (%)
Year householder moved into unit - Moved in 1969 or earlier (%)
Means of transportation to work - Drove car alone (%)
Means of transportation to work - Carpooled (%)
Means of transportation to work - Public transportation (%)
Means of transportation to work - Bus or trolley bus (%)
Means of transportation to work - Streetcar or trolley car (%)
Means of transportation to work - Subway or elevated (%)
Means of transportation to work - Railroad (%)
Means of transportation to work - Ferryboat (%)
Means of transportation to work - Taxicab (%)
Means of transportation to work - Motorcycle (%)
Means of transportation to work - Bicycle (%)
Means of transportation to work - Walked (%)
Means of transportation to work - Other means (%)
Working at home (%)
Industry diversity
Most Common Industries - Agriculture, forestry, fishing and hunting, and mining (%)
Most Common Industries - Agriculture, forestry, fishing and hunting (%)
Most Common Industries - Mining, quarrying, and oil and gas extraction (%)
Most Common Industries - Construction (%)
Most Common Industries - Manufacturing (%)
Most Common Industries - Wholesale trade (%)
Most Common Industries - Retail trade (%)
Most Common Industries - Transportation and warehousing, and utilities (%)
Most Common Industries - Transportation and warehousing (%)
Most Common Industries - Utilities (%)
Most Common Industries - Information (%)
Most Common Industries - Finance and insurance, and real estate and rental and leasing (%)
Most Common Industries - Finance and insurance (%)
Most Common Industries - Real estate and rental and leasing (%)
Most Common Industries - Professional, scientific, and management, and administrative and waste management services (%)
Most Common Industries - Professional, scientific, and technical services (%)
Most Common Industries - Management of companies and enterprises (%)
Most Common Industries - Administrative and support and waste management services (%)
Most Common Industries - Educational services, and health care and social assistance (%)
Most Common Industries - Educational services (%)
Most Common Industries - Health care and social assistance (%)
Most Common Industries - Arts, entertainment, and recreation, and accommodation and food services (%)
Most Common Industries - Arts, entertainment, and recreation (%)
Most Common Industries - Accommodation and food services (%)
Most Common Industries - Other services, except public administration (%)
Most Common Industries - Public administration (%)
Occupation diversity
Most Common Occupations - Management, business, science, and arts occupations (%)
Most Common Occupations - Management, business, and financial occupations (%)
Most Common Occupations - Management occupations (%)
Most Common Occupations - Business and financial operations occupations (%)
Most Common Occupations - Computer, engineering, and science occupations (%)
Most Common Occupations - Computer and mathematical occupations (%)
Most Common Occupations - Architecture and engineering occupations (%)
Most Common Occupations - Life, physical, and social science occupations (%)
Most Common Occupations - Education, legal, community service, arts, and media occupations (%)
Most Common Occupations - Community and social service occupations (%)
Most Common Occupations - Legal occupations (%)
Most Common Occupations - Education, training, and library occupations (%)
Most Common Occupations - Arts, design, entertainment, sports, and media occupations (%)
Most Common Occupations - Healthcare practitioners and technical occupations (%)
Most Common Occupations - Health diagnosing and treating practitioners and other technical occupations (%)
Most Common Occupations - Health technologists and technicians (%)
Most Common Occupations - Service occupations (%)
Most Common Occupations - Healthcare support occupations (%)
Most Common Occupations - Protective service occupations (%)
Most Common Occupations - Fire fighting and prevention, and other protective service workers including supervisors (%)
Most Common Occupations - Law enforcement workers including supervisors (%)
Most Common Occupations - Food preparation and serving related occupations (%)
Most Common Occupations - Building and grounds cleaning and maintenance occupations (%)
Most Common Occupations - Personal care and service occupations (%)
Most Common Occupations - Sales and office occupations (%)
Most Common Occupations - Sales and related occupations (%)
Most Common Occupations - Office and administrative support occupations (%)
Most Common Occupations - Natural resources, construction, and maintenance occupations (%)
Most Common Occupations - Farming, fishing, and forestry occupations (%)
Most Common Occupations - Construction and extraction occupations (%)
Most Common Occupations - Installation, maintenance, and repair occupations (%)
Most Common Occupations - Production, transportation, and material moving occupations (%)
Most Common Occupations - Production occupations (%)
Most Common Occupations - Transportation occupations (%)
Most Common Occupations - Material moving occupations (%)
People in Group quarters - Institutionalized population (%)
People in Group quarters - Correctional institutions (%)
People in Group quarters - Federal prisons and detention centers (%)
People in Group quarters - Halfway houses (%)
People in Group quarters - Local jails and other confinement facilities (including police lockups) (%)
People in Group quarters - Military disciplinary barracks (%)
People in Group quarters - State prisons (%)
People in Group quarters - Other types of correctional institutions (%)
People in Group quarters - Nursing homes (%)
People in Group quarters - Hospitals/wards, hospices, and schools for the handicapped (%)
People in Group quarters - Hospitals/wards and hospices for chronically ill (%)
People in Group quarters - Hospices or homes for chronically ill (%)
People in Group quarters - Military hospitals or wards for chronically ill (%)
People in Group quarters - Other hospitals or wards for chronically ill (%)
People in Group quarters - Hospitals or wards for drug/alcohol abuse (%)
People in Group quarters - Mental (Psychiatric) hospitals or wards (%)
People in Group quarters - Schools, hospitals, or wards for the mentally retarded (%)
People in Group quarters - Schools, hospitals, or wards for the physically handicapped (%)
People in Group quarters - Institutions for the deaf (%)
People in Group quarters - Institutions for the blind (%)
People in Group quarters - Orthopedic wards and institutions for the physically handicapped (%)
People in Group quarters - Wards in general hospitals for patients who have no usual home elsewhere (%)
People in Group quarters - Wards in military hospitals for patients who have no usual home elsewhere (%)
People in Group quarters - Juvenile institutions (%)
People in Group quarters - Long-term care (%)
People in Group quarters - Homes for abused, dependent, and neglected children (%)
People in Group quarters - Residential treatment centers for emotionally disturbed children (%)
People in Group quarters - Training schools for juvenile delinquents (%)
People in Group quarters - Short-term care, detention or diagnostic centers for delinquent children (%)
People in Group quarters - Type of juvenile institution unknown (%)
People in Group quarters - Noninstitutionalized population (%)
People in Group quarters - College dormitories (includes college quarters off campus) (%)
People in Group quarters - Military quarters (%)
People in Group quarters - On base (%)
People in Group quarters - Barracks, unaccompanied personnel housing (UPH), (Enlisted/Officer), ;and similar group living quarters for military personnel (%)
People in Group quarters - Transient quarters for temporary residents (%)
People in Group quarters - Military ships (%)
People in Group quarters - Group homes (%)
People in Group quarters - Homes or halfway houses for drug/alcohol abuse (%)
People in Group quarters - Homes for the mentally ill (%)
People in Group quarters - Homes for the mentally retarded (%)
People in Group quarters - Homes for the physically handicapped (%)
People in Group quarters - Other group homes (%)
People in Group quarters - Religious group quarters (%)
People in Group quarters - Dormitories (%)
People in Group quarters - Agriculture workers' dormitories on farms (%)
People in Group quarters - Job Corps and vocational training facilities (%)
People in Group quarters - Other workers' dormitories (%)
People in Group quarters - Crews of maritime vessels (%)
People in Group quarters - Other nonhousehold living situations (%)
People in Group quarters - Other noninstitutional group quarters (%)
Residents speaking English at home (%)
Residents speaking English at home - Born in the United States (%)
Residents speaking English at home - Native, born elsewhere (%)
Residents speaking English at home - Foreign born (%)
Residents speaking Spanish at home (%)
Residents speaking Spanish at home - Born in the United States (%)
Residents speaking Spanish at home - Native, born elsewhere (%)
Residents speaking Spanish at home - Foreign born (%)
Residents speaking other language at home (%)
Residents speaking other language at home - Born in the United States (%)
Residents speaking other language at home - Native, born elsewhere (%)
Residents speaking other language at home - Foreign born (%)
Class of Workers - Employee of private company (%)
Class of Workers - Self-employed in own incorporated business (%)
Class of Workers - Private not-for-profit wage and salary workers (%)
Class of Workers - Local government workers (%)
Class of Workers - State government workers (%)
Class of Workers - Federal government workers (%)
Class of Workers - Self-employed workers in own not incorporated business and Unpaid family workers (%)
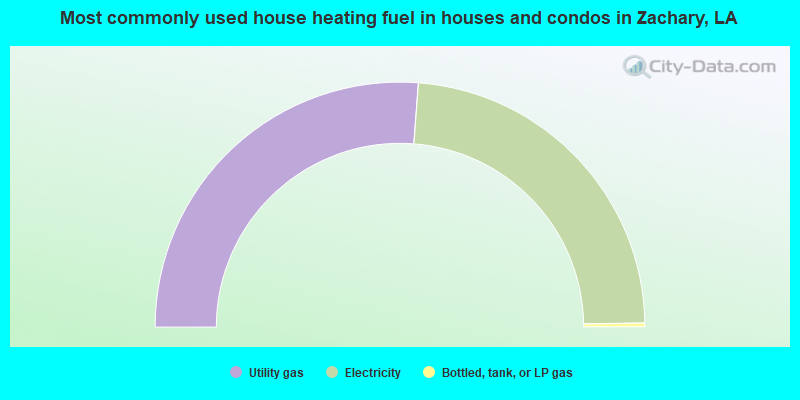
House heating fuel used in houses and condos - Utility gas (%)
House heating fuel used in houses and condos - Bottled, tank, or LP gas (%)
House heating fuel used in houses and condos - Electricity (%)
House heating fuel used in houses and condos - Fuel oil, kerosene, etc. (%)
House heating fuel used in houses and condos - Coal or coke (%)
House heating fuel used in houses and condos - Wood (%)
House heating fuel used in houses and condos - Solar energy (%)
House heating fuel used in houses and condos - Other fuel (%)
House heating fuel used in houses and condos - No fuel used (%)
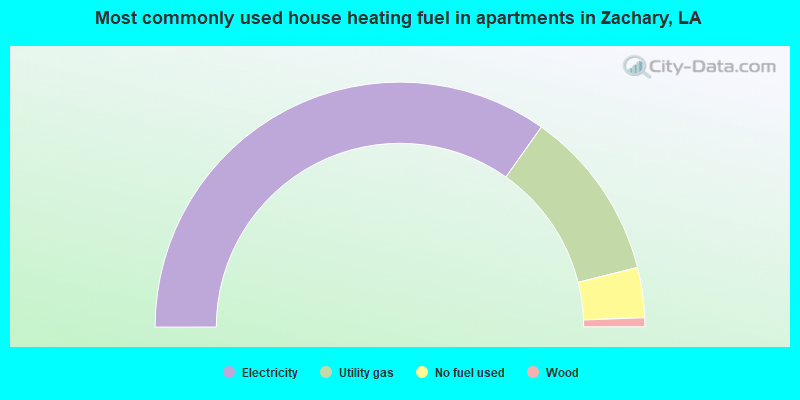
House heating fuel used in apartments - Utility gas (%)
House heating fuel used in apartments - Bottled, tank, or LP gas (%)
House heating fuel used in apartments - Electricity (%)
House heating fuel used in apartments - Fuel oil, kerosene, etc. (%)
House heating fuel used in apartments - Coal or coke (%)
House heating fuel used in apartments - Wood (%)
House heating fuel used in apartments - Solar energy (%)
House heating fuel used in apartments - Other fuel (%)
House heating fuel used in apartments - No fuel used (%)
Armed forces status - In Armed Forces (%)
Armed forces status - Civilian (%)
Armed forces status - Civilian - Veteran (%)
Armed forces status - Civilian - Nonveteran (%)
Read more: https://www.city-data.com/accidents/acc-Addison-Illinois.html
Fatal accidents locations in years 2005-2022
Fatal accidents locations in 2022
Fatal accidents locations in 2021
Fatal accidents locations in 2020
Fatal accidents locations in 2019
Fatal accidents locations in 2018
Fatal accidents locations in 2017
Fatal accidents locations in 2016
Fatal accidents locations in 2015
Fatal accidents locations in 2014
Fatal accidents locations in 2013
Fatal accidents locations in 2012
Fatal accidents locations in 2011
Fatal accidents locations in 2010
Fatal accidents locations in 2009
Fatal accidents locations in 2008
Fatal accidents locations in 2007
Fatal accidents locations in 2006
Fatal accidents locations in 2005
Alcohol use - People drinking some alcohol every month (%)
Alcohol use - People not drinking at all (%)
Alcohol use - Average days/month drinking alcohol
Alcohol use - Average drinks/week
Alcohol use - Average days/year people drink much
Audiometry - Average condition of hearing (%)
Audiometry - People that can hear a whisper from across a quiet room (%)
Audiometry - People that can hear normal voice from across a quiet room (%)
Audiometry - Ears ringing, roaring, buzzing (%)
Audiometry - Had a job exposure to loud noise (%)
Audiometry - Had off-work exposure to loud noise (%)
Blood Pressure & Cholesterol - Has high blood pressure (%)
Blood Pressure & Cholesterol - Checking blood pressure at home (%)
Blood Pressure & Cholesterol - Frequently checking blood cholesterol (%)
Blood Pressure & Cholesterol - Has high cholesterol level (%)
Consumer Behavior - Money monthly spent on food at supermarket/grocery store
Consumer Behavior - Money monthly spent on food at other stores
Consumer Behavior - Money monthly spent on eating out
Consumer Behavior - Money monthly spent on carryout/delivered foods
Consumer Behavior - Income spent on food at supermarket/grocery store (%)
Consumer Behavior - Income spent on food at other stores (%)
Consumer Behavior - Income spent on eating out (%)
Consumer Behavior - Income spent on carryout/delivered foods (%)
Current Health Status - General health condition (%)
Current Health Status - Blood donors (%)
Current Health Status - Has blood ever tested for HIV virus (%)
Current Health Status - Left-handed people (%)
Dermatology - People using sunscreen (%)
Diabetes - Diabetics (%)
Diabetes - Had a blood test for high blood sugar (%)
Diabetes - People taking insulin (%)
Diet Behavior & Nutrition - Diet health (%)
Diet Behavior & Nutrition - Milk product consumption (# of products/month)
Diet Behavior & Nutrition - Meals not home prepared (#/week)
Diet Behavior & Nutrition - Meals from fast food or pizza place (#/week)
Diet Behavior & Nutrition - Ready-to-eat foods (#/month)
Diet Behavior & Nutrition - Frozen meals/pizza (#/month)
Drug Use - People that ever used marijuana or hashish (%)
Drug Use - Ever used hard drugs (%)
Drug Use - Ever used any form of cocaine (%)
Drug Use - Ever used heroin (%)
Drug Use - Ever used methamphetamine (%)
Health Insurance - People covered by health insurance (%)
Kidney Conditions-Urology - Avg. # of times urinating at night
Medical Conditions - People with asthma (%)
Medical Conditions - People with anemia (%)
Medical Conditions - People with psoriasis (%)
Medical Conditions - People with overweight (%)
Medical Conditions - Elderly people having difficulties in thinking or remembering (%)
Medical Conditions - People who ever received blood transfusion (%)
Medical Conditions - People having trouble seeing even with glass/contacts (%)
Medical Conditions - People with arthritis (%)
Medical Conditions - People with gout (%)
Medical Conditions - People with congestive heart failure (%)
Medical Conditions - People with coronary heart disease (%)
Medical Conditions - People with angina pectoris (%)
Medical Conditions - People who ever had heart attack (%)
Medical Conditions - People who ever had stroke (%)
Medical Conditions - People with emphysema (%)
Medical Conditions - People with thyroid problem (%)
Medical Conditions - People with chronic bronchitis (%)
Medical Conditions - People with any liver condition (%)
Medical Conditions - People who ever had cancer or malignancy (%)
Mental Health - People who have little interest in doing things (%)
Mental Health - People feeling down, depressed, or hopeless (%)
Mental Health - People who have trouble sleeping or sleeping too much (%)
Mental Health - People feeling tired or having little energy (%)
Mental Health - People with poor appetite or overeating (%)
Mental Health - People feeling bad about themself (%)
Mental Health - People who have trouble concentrating on things (%)
Mental Health - People moving or speaking slowly or too fast (%)
Mental Health - People having thoughts they would be better off dead (%)
Oral Health - Average years since last visit a dentist
Oral Health - People embarrassed because of mouth (%)
Oral Health - People with gum disease (%)
Oral Health - General health of teeth and gums (%)
Oral Health - Average days a week using dental floss/device
Oral Health - Average days a week using mouthwash for dental problem
Oral Health - Average number of teeth
Pesticide Use - Households using pesticides to control insects (%)
Pesticide Use - Households using pesticides to kill weeds (%)
Physical Activity - People doing vigorous-intensity work activities (%)
Physical Activity - People doing moderate-intensity work activities (%)
Physical Activity - People walking or bicycling (%)
Physical Activity - People doing vigorous-intensity recreational activities (%)
Physical Activity - People doing moderate-intensity recreational activities (%)
Physical Activity - Average hours a day doing sedentary activities
Physical Activity - Average hours a day watching TV or videos
Physical Activity - Average hours a day using computer
Physical Functioning - People having limitations keeping them from working (%)
Physical Functioning - People limited in amount of work they can do (%)
Physical Functioning - People that need special equipment to walk (%)
Physical Functioning - People experiencing confusion/memory problems (%)
Physical Functioning - People requiring special healthcare equipment (%)
Prescription Medications - Average number of prescription medicines taking
Preventive Aspirin Use - Adults 40+ taking low-dose aspirin (%)
Reproductive Health - Vaginal deliveries (%)
Reproductive Health - Cesarean deliveries (%)
Reproductive Health - Deliveries resulted in a live birth (%)
Reproductive Health - Pregnancies resulted in a delivery (%)
Reproductive Health - Women breastfeeding newborns (%)
Reproductive Health - Women that had a hysterectomy (%)
Reproductive Health - Women that had both ovaries removed (%)
Reproductive Health - Women that have ever taken birth control pills (%)
Reproductive Health - Women taking birth control pills (%)
Reproductive Health - Women that have ever used Depo-Provera or injectables (%)
Reproductive Health - Women that have ever used female hormones (%)
Sexual Behavior - People 18+ that ever had sex (vaginal, anal, or oral) (%)
Sexual Behavior - Males 18+ that ever had vaginal sex with a woman (%)
Sexual Behavior - Males 18+ that ever performed oral sex on a woman (%)
Sexual Behavior - Males 18+ that ever had anal sex with a woman (%)
Sexual Behavior - Males 18+ that ever had any sex with a man (%)
Sexual Behavior - Females 18+ that ever had vaginal sex with a man (%)
Sexual Behavior - Females 18+ that ever performed oral sex on a man (%)
Sexual Behavior - Females 18+ that ever had anal sex with a man (%)
Sexual Behavior - Females 18+ that ever had any kind of sex with a woman (%)
Sexual Behavior - Average age people first had sex
Sexual Behavior - Average number of female sex partners in lifetime (males 18+)
Sexual Behavior - Average number of female vaginal sex partners in lifetime (males 18+)
Sexual Behavior - Average age people first performed oral sex on a woman (18+)
Sexual Behavior - Average number of woman performed oral sex on in lifetime (18+)
Sexual Behavior - Average number of male sex partners in lifetime (males 18+)
Sexual Behavior - Average number of male anal sex partners in lifetime (males 18+)
Sexual Behavior - Average age people first performed oral sex on a man (18+)
Sexual Behavior - Average number of male oral sex partners in lifetime (18+)
Sexual Behavior - People using protection when performing oral sex (%)
Sexual Behavior - Average number of times people have vaginal or anal sex a year
Sexual Behavior - People having sex without condom (%)
Sexual Behavior - Average number of male sex partners in lifetime (females 18+)
Sexual Behavior - Average number of male vaginal sex partners in lifetime (females 18+)
Sexual Behavior - Average number of female sex partners in lifetime (females 18+)
Sexual Behavior - Circumcised males 18+ (%)
Sleep Disorders - Average hours sleeping at night
Sleep Disorders - People that has trouble sleeping (%)
Smoking-Cigarette Use - People smoking cigarettes (%)
Taste & Smell - People 40+ having problems with smell (%)
Taste & Smell - People 40+ having problems with taste (%)
Taste & Smell - People 40+ that ever had wisdom teeth removed (%)
Taste & Smell - People 40+ that ever had tonsils teeth removed (%)
Taste & Smell - People 40+ that ever had a loss of consciousness because of a head injury (%)
Taste & Smell - People 40+ that ever had a broken nose or other serious injury to face or skull (%)
Taste & Smell - People 40+ that ever had two or more sinus infections (%)
Weight - Average height (inches)
Weight - Average weight (pounds)
Weight - Average BMI
Weight - People that are obese (%)
Weight - People that ever were obese (%)
Weight - People trying to lose weight (%)
Officers per 1,000 residents here:
2.08Louisiana average:
3.21
Latest news from Zachary, LA collected exclusively by city-data.com from local newspapers, TV, and radio stations
Ancestries: American (13.3%), English (4.3%), European (3.4%), French (3.1%), Irish (3.0%), German (2.2%).
Current Local Time:
Land area: 23.7 square miles.
Population density: 839 people per square mile (low).
545 residents are foreign born (1.9% Asia , 0.6% Europe ).
This city:
2.8%Louisiana:
4.7%
Median real estate property taxes paid for housing units with mortgages in 2023: $2,346 (0.8%)Median real estate property taxes paid for housing units with no mortgage in 2023: $1,109 (0.5%)
Nearest city with pop. 50,000+: Baton Rouge, LA
Nearest city with pop. 1,000,000+: Houston, TX
Nearest cities:
Latitude: 30.66 N, Longitude: 91.16 W
Daytime population change due to commuting: -3,439 (-17.7%)Workers who live and work in this city: 2,484 (25.0%)
Zachary tourist attractions:
Single-family new house construction building permits:
2023: 97 buildings , average cost: $153,6002022: 102 buildings , average cost: $168,7002021: 148 buildings , average cost: $152,6002020: 216 buildings , average cost: $162,8002019: 199 buildings , average cost: $174,2002018: 220 buildings , average cost: $164,0002017: 185 buildings , average cost: $163,1002016: 161 buildings , average cost: $159,7002015: 158 buildings , average cost: $167,5002014: 120 buildings , average cost: $162,4002013: 139 buildings , average cost: $176,3002012: 160 buildings , average cost: $160,8002011: 90 buildings , average cost: $163,0002010: 127 buildings , average cost: $159,5002009: 86 buildings , average cost: $162,8002008: 109 buildings , average cost: $175,5002007: 202 buildings , average cost: $169,9002006: 403 buildings , average cost: $146,1002005: 232 buildings , average cost: $157,3002004: 144 buildings , average cost: $163,3002003: 181 buildings , average cost: $106,6002002: 103 buildings , average cost: $66,7002001: 102 buildings , average cost: $68,3002000: 97 buildings , average cost: $70,4001999: 141 buildings , average cost: $73,1001998: 101 buildings , average cost: $68,7001997: 75 buildings , average cost: $69,600Unemployment in November 2024:
Population change in the 1990s: +1,787 (+18.8%).
Most common occupations in Zachary, LA (%)
Both Males Females
Other production occupations, including supervisors (6.0%)
Other office and administrative support workers, including supervisors (4.3%)
Other sales and related occupations, including supervisors (4.2%)
Secretaries and administrative assistants (4.1%)
Electrical equipment mechanics and other installation, maintenance, and repair workers, including supervisors (3.8%)
Preschool, kindergarten, elementary, and middle school teachers (3.7%)
Law enforcement workers, including supervisors (3.1%)
Other production occupations, including supervisors (9.9%)
Electrical equipment mechanics and other installation, maintenance, and repair workers, including supervisors (7.3%)
Law enforcement workers, including supervisors (5.2%)
Metal workers and plastic workers (4.6%)
Other sales and related occupations, including supervisors (3.4%)
Building and grounds cleaning and maintenance occupations (3.3%)
Driver/sales workers and truck drivers (3.2%)
Secretaries and administrative assistants (8.6%)
Other office and administrative support workers, including supervisors (7.7%)
Preschool, kindergarten, elementary, and middle school teachers (6.9%)
Other sales and related occupations, including supervisors (5.2%)
Registered nurses (4.7%)
Health technologists and technicians (4.6%)
Information and record clerks, except customer service representatives (4.1%)
Tornado activity:
Zachary-area historical tornado activity is near Louisiana state average. It is 74% greater than the overall U.S. average.
On 10/14/1984, a category F3 (max. wind speeds 158-206 mph) tornado 0.5 miles away from the Zachary city center injured 3 people and caused between $50,000 and $500,000 in damages.
On 9/16/1971, a category F3 tornado 8.9 miles away from the city center injured 3 people and caused between $500,000 and $5,000,000 in damages.
Earthquake activity:
Zachary-area historical earthquake activity is significantly above Louisiana state average. It is 43% smaller than the overall U.S. average. On 5/17/2012 at 08:12:00, a magnitude 4.8 (4.8 MW, Depth: 3.1 mi, Class: Light, Intensity: IV - V) earthquake occurred 209.2 miles away from the city center On 9/10/2006 at 14:56:08, a magnitude 5.9 (5.9 MB, 5.5 MS, 5.8 MW, Class: Moderate, Intensity: VI - VII) earthquake occurred 410.5 miles away from the city center On 10/24/1997 at 08:35:17, a magnitude 4.9 (4.8 MB, 4.2 MS, 4.9 LG, Depth: 6.2 mi) earthquake occurred 232.8 miles away from the city center On 5/6/2018 at 16:47:09, a magnitude 4.6 (4.6 MB, Depth: 6.2 mi) earthquake occurred 243.8 miles away from the city center On 1/18/1999 at 07:00:53, a magnitude 4.8 (4.8 MB, 4.0 LG, Depth: 0.6 mi) earthquake occurred 297.5 miles away from the city center On 9/2/2013 at 23:51:15, a magnitude 4.3 (4.3 MW, Depth: 2.9 mi) earthquake occurred 211.9 miles away from the city center Magnitude types: regional Lg-wave magnitude (LG), body-wave magnitude (MB), surface-wave magnitude (MS), moment magnitude (MW) Natural disasters: The number of natural disasters in East Baton Rouge Parish (44) is a lot greater than the US average (19).Major Disasters (Presidential) Declared: 20Emergencies Declared: 5Hurricanes: 19, Tropical Storms: 10, Floods: 9, Storms: 8, Tornadoes: 2, Winter Storms: 2, Other: 3 (Note: some incidents may be assigned to more than one category). Hospitals and medical centers in Zachary: HOSPICE CARE SERVICES OF LOUISIANA, LLC (5608 MAIN STREET) LANE REGIONAL MEDICAL CENTER (Government - Hospital District or Authority, provides emergency services, 6300 MAIN STREET) LOBDELL COMMUNITY HOME (10015 DEERFORD ROAD) SERENITY HOSPICE SERVICES OF BATON ROUGE (6363 MAIN STREET - SUITE E) LANE MEMORIAL HOSP. SNF (6300 MAIN ST.)
LANE NSG HOME AN AFFILIATE OF LANE REG MEDICAL CTR (6300 MAIN STREET)
ZACHARY MANOR NURSING AND REHABILITATION CENTER (6161 MAIN STREET)
ZACHARY MANOR NURSING HOME (6161 MAIN ST)
FMCNA - ZACHARY CROSSROAD (4709 SECRETARY DR)
Amtrak station near Zachary: 15 miles: BATON ROUGE (1253 FLORIDA ST.) - Bus Station Services: enclosed waiting area, public restrooms, public payphones, call for taxi service, intercity bus service, public transit connection.
Operable nuclear power plant near Zachary:
17 miles: River Bend in St. Francisville, LA.
Colleges/universities with over 2000 students nearest to Zachary:
Louisiana State University and Agricultural & Mechanical College (about 8 miles; Baton Rouge, LA ; Full-time enrollment: 27,321)
Southern University and A & M College (about 10 miles; Baton Rouge, LA ; FT enrollment: 5,837)
Baton Rouge Community College (about 15 miles; Baton Rouge, LA ; FT enrollment: 5,744)
Southeastern Louisiana University (about 43 miles; Hammond, LA ; FT enrollment: 12,713)
University of Louisiana at Lafayette (about 60 miles; Lafayette, LA ; FT enrollment: 14,493)
Acadiana Technical College-Lafayette Campus (about 62 miles; Lafayette, LA ; FT enrollment: 2,378)
South Louisiana Community College (about 62 miles; Lafayette, LA ; FT enrollment: 2,519)
Public high school in Zachary:
Private high schools in Zachary: ZACHARY CHRISTIAN ACADEMY Students: 132, Location: 20810 PLANK RD, Grades: PK-11)
TRINITY CHRISTIAN ACADEMY Students: 30, Location: 4325 CHURCH ST, Grades: 5-12)
Public elementary/middle schools in Zachary: NORTHWESTERN MIDDLE SCHOOL Students: 1,157, Location: 5200 EAST CENTRAL AVENUE, Grades: 7-8)ZACHARY ELEMENTARY SCHOOL Students: 797, Location: 3775 HEMLOCK STREET, Grades: 3-4)COPPER MILL ELEMENTARY/MIDDLE SCHOOL Location: 1300 INDEPENDENCE BLVD., Grades: 5-6)
ROLLINS PLACE ELEMENTARY Location: 4488 ROLLINS ROAD, Grades: 1-2)
Private elementary/middle school in Zachary: GALILEE BAPTIST ACADEMY Students: 205, Location: 11050 GREENWELL SPRINGS PORT HUDSON RD, Grades: PK-7)
See full list of schools located in Zachary User-submitted facts and corrections:
Zachary is the second fastest growing city in the state of Louisiana (2004). with a school system independent from the East Baton Rouge school system. In the past 4 years, Zachary has seen banks, credit unions, major retailers and restaurants as well as little boutique-type shops move to town. It is still a "small town" with many of the convieniences from the city. Commute to Baton Rouge is realy qucik and easy.
Notable locations in Zachary: (A) , Zachary Historic Village (B) , Lane Rehabilitation Center (C) , East Baton Rouge Parish Library Zachary Branch (D) , Zachary Police Department - Records Clerk (E) , Zachary Fire Rescue Station 81 (F) , Zachary Volunteer Fire / Rescue Station 80 (G) , Oakwood Village Adult Care Facility (H) . Display/hide their locations on the map
Churches in Zachary include: (A) , Lighthouse of Zachary (B) , Jackson Chapel United Methodist Church (C) , Grace Baptist Church (D) , First Presbyterian Church of Zachary (E) , Church of Christ (F) , Redwood Baptist Church (G) , New Hope Baptist Church (H) , Little Star Baptist Church (I) . Display/hide their locations on the map
Cemeteries: (1) , Azalea Rest Cemetery (2) , Stanford Cemetery (3) , Johnson Cemetery (4) , Redwood Cemetery (5) . Display/hide their locations on the map
Streams, rivers, and creeks: (A) , Black Creek (B) , Indian Bayou (C) . Display/hide their locations on the map
Park in Zachary: (1) . Display/hide its location on the map
Tourist attraction: (1) . Display/hide its approximate location on the map
Hotel: (1) . Display/hide its approximate location on the map
Birthplace of: Erick Erickson - Blogger, Robert Pete Williams - Louisiana blues musician, Frank Brian - Basketball player, Felton Huggins - Football player, Gus Young (civil rights leader) - Civil rights activist, Jim Williams (outfielder) - Baseball player, Kedrick Brown - Basketball player, Leonard Scott - Sprinter.
East Baton Rouge Parish has a predicted average indoor radon screening level less than 2 pCi/L (pico curies per liter) - Low Potential Drinking water stations with addresses in Zachary and their reported violations in the past:
CITY OF ZACHARY WATER SYSTEM (Population served: 20,982, Groundwater):
Past health violations:
MCL, Monthly (TCR) - In SEP-2014, Contaminant: Coliform. Follow-up actions: St Violation/Reminder Notice (SEP-17-2014), St Public Notif requested (SEP-17-2014)
MCL, Monthly (TCR) - In JUN-2013, Contaminant: Coliform. Follow-up actions: St Public Notif requested (JUN-24-2013), St Violation/Reminder Notice (JUN-24-2013), St Public Notif received (JUL-08-2013), St Compliance achieved (SEP-18-2014)
MCL, Monthly (TCR) - In AUG-2012, Contaminant: Coliform. Follow-up actions: St Public Notif requested (SEP-14-2012), St Public Notif received (SEP-14-2012), St Violation/Reminder Notice (SEP-14-2012)
Past monitoring violations:
One regular monitoring violation
Address: 1400 W. Irene Road Population served: 300, Groundwater):
Past monitoring violations:
Monitoring and Reporting (DBP) - Between JAN-2013 and AUG-2013, Contaminant: TTHM. Follow-up actions: St Violation/Reminder Notice (DEC-02-2013), St Public Notif requested (DEC-02-2013)
Monitoring and Reporting (DBP) - Between JAN-2013 and AUG-2013, Contaminant: Total Haloacetic Acids (HAA5). Follow-up actions: St Violation/Reminder Notice (DEC-02-2013), St Public Notif requested (DEC-02-2013)
Failure Submit IDSE/Subpart V Plan Rpt - In JAN-01-2013, Contaminant: DBP STAGE 2. Follow-up actions: St Violation/Reminder Notice (FEB-21-2014)
Monitoring and Reporting (DBP) - Between JUL-2012 and SEP-2012, Contaminant: Total Haloacetic Acids (HAA5). Follow-up actions: St Public Notif requested (MAR-05-2013), St Violation/Reminder Notice (MAR-05-2013)
Monitoring and Reporting (DBP) - Between JUL-2012 and SEP-2012, Contaminant: TTHM. Follow-up actions: St Public Notif requested (MAR-05-2013), St Violation/Reminder Notice (MAR-05-2013)
5 other older monitoring violations
Address: 20978 Port Hickey Road Population served: 209, Groundwater):
Past monitoring violations:
One routine major monitoring violation
One regular monitoring violation
Average household size: This city:
2.9 peopleLouisiana:
2.5 people
Percentage of family households: This city:
78.8%Whole state:
67.1%
Percentage of households with unmarried partners: This city:
4.5%Whole state:
6.8%
Likely homosexual households (counted as self-reported same-sex unmarried-partner households)
Lesbian couples: 0.3% of all households Gay men: 0.2% of all households
196 people in nursing facilities/skilled-nursing facilities in 2010people in group homes for juveniles (non-correctional) in 2010People in group quarters in Zachary in 2000:
161 people in nursing homes
52 people in hospitals/wards and hospices for chronically ill
52 people in other hospitals or wards for chronically ill
Banks with branches in Zachary (2011 data):
Bank of Zachary: Bank Of Zachary at 4743 Main Street, branch established on 1904/01/01; Plaza Branch at 2210 Highway 64, branch established on 1977/07/11. Info updated 2006/11/03: Bank assets: $182.7 mil, Deposits: $155.3 mil, local headquarters , positive income , Mortgage Lending Specialization, 3 total offices , Holding Company: Zachary Bancshares, Inc.
Regions Bank: Zachary Branch at 4919 Main Street, branch established on 1986/04/29. Info updated 2011/02/24: Bank assets: $123,368.2 mil, Deposits: $98,301.3 mil, headquarters in Birmingham, AL, positive income , Commercial Lending Specialization, 1778 total offices , Holding Company: Regions Financial Corporation
Landmark Bank: Zachary Branch at 20070 Plank Road, branch established on 1999/01/27. Info updated 2006/11/03: Bank assets: $104.1 mil, Deposits: $92.0 mil, headquarters in Clinton, LA, positive income , Commercial Lending Specialization, 3 total offices , Holding Company: Clinton Bancshares, Inc.
Guaranty Bank and Trust Company: Zachary Branch at 6800 Main Street, branch established on 2005/09/06. Info updated 2006/11/03: Bank assets: $130.1 mil, Deposits: $113.4 mil, headquarters in New Roads, LA, positive income , Commercial Lending Specialization, 4 total offices , Holding Company: Great Guaranty Bancshares, Inc.
The Highlands Bank: Zachary Branch at 1112 Church Street, branch established on 2002/02/04. Info updated 2006/11/03: Bank assets: $144.0 mil, Deposits: $127.9 mil, headquarters in Jackson, LA, positive income , Commercial Lending Specialization, 5 total offices , Holding Company: Boj Bancshares, Inc.
American Gateway Bank: Zachary Branch at 1858 Church Street, branch established on 2009/12/10. Info updated 2011/07/12: Bank assets: $448.9 mil, Deposits: $314.1 mil, headquarters in Port Allen, LA, negative income in the last year , Commercial Lending Specialization, 11 total offices , Holding Company: American Gateway Financial Corporation
Whitney Bank: Zachary Branch at 5440 Main Street, branch established on 2005/02/28. Info updated 2011/06/14: Bank assets: $14,882.3 mil, Deposits: $11,630.0 mil, headquarters in New Orleans, LA, positive income , Commercial Lending Specialization, 189 total offices , Holding Company: Hancock Holding Company
JPMorgan Chase Bank, National Association: Zachary Branch at 4431 Highway 19, branch established on 1966/11/01. Info updated 2011/11/10: Bank assets: $1,811,678.0 mil, Deposits: $1,190,738.0 mil, headquarters in Columbus, OH, positive income , International Specialization, 5577 total offices , Holding Company: Jpmorgan Chase & Co.
For population 15 years and over in Zachary:
Never married: 27.0%Now married: 59.5%Separated: 1.3%Widowed: 4.5%Divorced: 7.8% For population 25 years and over in Zachary:
High school or higher: 94.5%Bachelor's degree or higher: 38.5%Graduate or professional degree: 15.5%Unemployed: 4.3%Mean travel time to work (commute): 24.8 minutes
Education Gini index (Inequality in education) Here:
11.0Louisiana average:
11.9
Religion statistics for Zachary, LA (based on East Baton Rouge Parish data)
Religion Adherents Congregations Evangelical Protestant 120,949 258 Catholic 97,904 24 Black Protestant 35,272 64 Mainline Protestant 32,765 50 Other 9,604 36 Orthodox 457 4 None 143,220 -
Source: Clifford Grammich, Kirk Hadaway, Richard Houseal, Dale E.Jones, Alexei Krindatch, Richie Stanley and Richard H.Taylor. 2012. 2010 U.S.Religion Census: Religious Congregations & Membership Study. Association of Statisticians of American Religious Bodies. Jones, Dale E., et al. 2002. Congregations and Membership in the United States 2000. Nashville, TN: Glenmary Research Center. Graphs represent county-level data
Food Environment Statistics: Number of grocery stores : 111East Baton Rouge Parish :
2.58 / 10,000 pop.Louisiana :
2.56 / 10,000 pop.
Number of supercenters and club stores : 8This county :
0.19 / 10,000 pop.State :
0.18 / 10,000 pop.
Number of convenience stores (no gas) : 69Here :
1.60 / 10,000 pop.State :
1.29 / 10,000 pop.
Number of convenience stores (with gas) : 165This county :
3.84 / 10,000 pop.Louisiana :
4.49 / 10,000 pop.
Number of full-service restaurants : 273East Baton Rouge Parish :
6.35 / 10,000 pop.State :
5.92 / 10,000 pop.
Adult diabetes rate : This county :
9.4%Louisiana :
10.9%
Adult obesity rate : East Baton Rouge Parish :
27.7%State :
29.2%
Low-income preschool obesity rate : East Baton Rouge Parish :
13.8%Louisiana :
13.7%
Health and Nutrition:
Average overall health of teeth and gums : This city:
56.8%Louisiana:
46.5%
People feeling badly about themselves : This city:
17.9%Louisiana:
20.3%
People not drinking alcohol at all : Average hours sleeping at night : Overweight people : Zachary:
35.3%Louisiana:
34.5%
General health condition : Zachary:
62.3%Louisiana:
55.8%
Average condition of hearing : This city:
83.2%Louisiana:
80.2%
More about Health and Nutrition of Zachary, LA Residents
Local government employment and payroll (March 2022)
Function
Full-time employees
Monthly full-time payroll
Average yearly full-time wage
Part-time employees
Monthly part-time payroll
Firefighters
50 $199,636 $47,913 7 $7,132 Police Protection - Officers
47 $232,960 $59,479 5 $6,391 Financial Administration
12 $46,521 $46,521 2 $3,045 Judicial and Legal
7 $13,259 $22,730 5 $7,165 Streets and Highways
6 $23,209 $46,418 0 $0 Parks and Recreation
6 $26,567 $53,134 1 $1,262 Water Supply
5 $17,834 $42,802 0 $0 Gas Supply
5 $17,887 $42,929 0 $0 Other Government Administration
4 $11,459 $34,377 11 $12,441 Other and Unallocable
3 $14,256 $57,024 0 $0 Sewerage
0 $0 5 $3,276
Totals for Government
145 $603,588 $49,952 36 $40,712
Zachary government finances - Expenditure in 2022 (per resident):
Construction - Regular Highways: $13,640,000 ($684.88)
Sewerage: $914,000 ($45.89)Water Utilities: $914,000 ($45.89)Gas Utilities: $914,000 ($45.89)Local Fire Protection: $624,000 ($31.33)Parks and Recreation: $508,000 ($25.51)Police Protection: $259,000 ($13.00)General - Other: $114,000 ($5.72)Current Operations - Police Protection: $4,803,000 ($241.16)
Local Fire Protection: $4,745,000 ($238.25)General - Other: $2,746,000 ($137.88)Gas Utilities: $2,540,000 ($127.54)Solid Waste Management: $1,868,000 ($93.79)Financial Administration: $1,741,000 ($87.42)Water Utilities: $1,534,000 ($77.02)Sewerage: $1,343,000 ($67.43)Regular Highways: $1,101,000 ($55.28)Central Staff Services: $804,000 ($40.37)Judicial and Legal Services: $550,000 ($27.62)Parks and Recreation: $487,000 ($24.45)Protective Inspection and Regulation - Other: $311,000 ($15.62)General - Interest on Debt: $475,000 ($23.85)
Total Salaries and Wages: $8,670,000 ($435.33)
Water Utilities - Interest on Debt: $254,000 ($12.75)
Zachary government finances - Revenue in 2022 (per resident):
Charges - Solid Waste Management: $1,804,000 ($90.58)
Sewerage: $1,382,000 ($69.39)Other: $917,000 ($46.04)Parks and Recreation: $168,000 ($8.44)Federal Intergovernmental - Other: $3,389,000 ($170.16)
Miscellaneous - General Revenue - Other: $2,744,000 ($137.78)
Sale of Property: $304,000 ($15.26)Fines and Forfeits: $156,000 ($7.83)Interest Earnings: $12,000 ($0.60)Revenue - Gas Utilities: $3,243,000 ($162.83)
Water Utilities: $3,033,000 ($152.29)State Intergovernmental - Other: $2,217,000 ($111.32)
Tax - General Sales and Gross Receipts: $11,070,000 ($555.83)
Property: $1,075,000 ($53.98)Occupation and Business License - Other: $407,000 ($20.44)Alcoholic Beverage Sales: $16,000 ($0.80)
Zachary government finances - Debt in 2022 (per resident):
Long Term Debt - Beginning Outstanding - Unspecified Public Purpose: $18,238,000 ($915.75)
Outstanding Unspecified Public Purpose: $16,296,000 ($818.24)Retired Unspecified Public Purpose: $1,942,000 ($97.51)
Businesses in Zachary, LA
Name Count Name Count
AT&T 1 Office Depot 1 Ace Hardware 1 Papa John's Pizza 1 AutoZone 1 Payless 1 Best Western 1 Popeyes 2 Blockbuster 1 RadioShack 1 Burger King 1 Rue21 1 Church's Chicken 1 Ryan's Grill 1 Circle K 1 SONIC Drive-In 1 Curves 1 Subway 2 FedEx 1 T-Mobile 1 Ford 1 Taco Bell 1 GNC 1 UPS 2 H&R Block 2 Waffle House 1 Holiday Inn 1 Walgreens 1 Home Depot 1 Walmart 1 McDonald's 1 Wendy's 1 Nike 1
Strongest AM radio stations in Zachary:
WSKR (1210 AM; 10 kW; DENHAM SPRINGS, LA; Owner: CAPSTAR TX LIMITED PARTNERSHIP)
WNDC (910 AM; 1 kW; BATON ROUGE, LA; Owner: CHURCH POINT MINISTRIES, INC.)
WPFC (1550 AM; 5 kW; BATON ROUGE, LA; Owner: VICTORY & POWER MINISTRIES,INC.)
WIBR (1300 AM; 5 kW; BATON ROUGE, LA; Owner: CITADEL BROADCASTING COMPANY)
WXOK (1460 AM; 5 kW; BATON ROUGE, LA; Owner: CITADEL BROADCASTING COMPANY)
WJBO (1150 AM; 5 kW; BATON ROUGE, LA; Owner: CAPSTAR TX LIMITED PARTNERSHIP)
KBRH (1260 AM; 5 kW; BATON ROUGE, LA; Owner: EAST BATON ROUGE PARISH SCHOOL BOARD)
WYNK (1380 AM; daytime; 5 kW; BATON ROUGE, LA; Owner: CAPSTAR TX LIMITED PARTNERSHIP)
WWL (870 AM; 50 kW; NEW ORLEANS, LA; Owner: ENTERCOM NEW ORLEANS LICENSE, LLC)
WOMN (1110 AM; daytime; 30 kW; FRANKLINTON, LA; Owner: PITTMAN BROADCASTING SERVICES, LLC.)
WLNO (1060 AM; 50 kW; NEW ORLEANS, LA; Owner: COMMUNICOM CO. OF LOUISIANA, L.P.)
WGLH (960 AM; 1 kW; LA FOLLETTE, TN; Owner: LAFOLLETTE BROADCASTERS, INC.)
WSJC (810 AM; 50 kW; MAGEE, MS; Owner: FAMILY TALK RADIO)
Strongest FM radio stations in Zachary:
KQXL-FM (106.5 FM; NEW ROADS, LA; Owner: CITADEL BROADCASTING COMPANY)
WJNH (107.3 FM; BAKER, LA; Owner: GUARANTY BROADCASTING CO. OF BATON ROUGE, LLC)
WNXX (104.5 FM; JACKSON, LA; Owner: GUARANTY BROADCASTING COMPANY OF BATON ROUGE, LLC)
WDGL (98.1 FM; BATON ROUGE, LA; Owner: GUARANTY BROADCASTING COMPANY OF BATON ROUGE, LLC)
WYPY (100.7 FM; BATON ROUGE, LA; Owner: GUARANTY BROADCASTING COMPANY OF BATON ROUGE, LLC)
WYNK-FM (101.5 FM; BATON ROUGE, LA; Owner: CAPSTAR TX LIMITED PARTNERSHIP)
WFMF (102.5 FM; BATON ROUGE, LA; Owner: CAPSTAR TX LIMITED PARTNERSHIP)
WRKF (89.3 FM; BATON ROUGE, LA; Owner: PUBLIC RADIO INC.)
WQCK (92.7 FM; CLINTON, LA; Owner: BETHANY WORLD PRAYER CENTER, INC.)
WBBE (103.3 FM; HAMMOND, LA; Owner: CITADEL BROADCASTING COMPANY)
KRVE (96.1 FM; BRUSLY, LA; Owner: CAPSTAR TX LIMITED PARTNERSHIP)
WBRH (90.3 FM; BATON ROUGE, LA; Owner: EAST BATON ROUGE PARISH SCHOOL BOARD)
KOOJ (93.7 FM; NEW IBERIA, LA; Owner: CITADEL BROADCASTING COMPANY)
KSTE-FM (104.1 FM; HOUMA, LA; Owner: CLEAR CHANNEL BROADCASTING LICENSES, INC.)
WCKW-FM (92.3 FM; LAPLACE, LA; Owner: 222 CORPORATION)
WQNZ (95.1 FM; NATCHEZ, MS; Owner: FIRST NATCHEZ CORPORATION)
WJFM (88.5 FM; BATON ROUGE, LA; Owner: FAMILY WORSHIP CENTER CHURCH, INC.)
KPAE (91.5 FM; ERWINVILLE, LA; Owner: PORT ALLEN EDUC B/C FOUNDATION)
KLSU (91.1 FM; BATON ROUGE, LA; Owner: LOUISIANA STATE UNIVERSITY)
K220EU (91.9 FM; NEW ROADS, LA; Owner: CALVARY CHAPEL OF TWIN FALLS, INC.)
TV broadcast stations around Zachary:
WAFB (Channel 9; BATON ROUGE, LA; Owner: WAFB, L.L.C)
WBXH-CA (Channel 46; BATON ROUGE, LA; Owner: THE BOX WORLDWIDE LLC)
WBRZ-TV (Channel 2; BATON ROUGE, LA; Owner: LOUISIANA TELEVISION BROADCASTING, LLC)
WVLA (Channel 33; BATON ROUGE, LA; Owner: KNIGHT BROADCASTING OF BATON ROUGE LIC. CORP.)
KZUP-CA (Channel 19; BATON ROUGE, LA; Owner: KNIGHT BROADCASTING OF BATON ROUGE LICENSE CORPORATION)
WBRL-CA (Channel 21; BATON ROUGE, LA; Owner: COMCORP OF BATON ROUGE LICENSE CORP.)
WLPB-TV (Channel 27; BATON ROUGE, LA; Owner: LOUISIANA EDUCATIONAL TELEVISION AUTHORITY)
WGMB (Channel 44; BATON ROUGE, LA; Owner: COMCORP OF BATON ROUGE LICENSE CORP.)
KBTR-CA (Channel 65; BATON ROUGE, LA; Owner: GREAT OAKS BROADCASTING CORPORATION)
K58GB (Channel 58; BATON ROUGE, LA; Owner: TRINITY BROADCASTING NETWORK)
K07WE (Channel 7; BATON ROUGE, LA; Owner: LOUISIANA CHRISTIAN BROADCASTING, INC.)
KPBN-LP (Channel 11; BATON ROUGE, LA; Owner: PELICAN BROADCASTING NETWORK, L.L.C.)
K13VE (Channel 13; BATON ROUGE, LA; Owner: DAVID M. LOFLIN)
WLFT-CA (Channel 52; BATON ROUGE, LA; Owner: BETHANY WORLD PRAYER CENTER, INC.)
National Bridge Inventory (NBI) Statistics 21 Number of bridges269ft / 81.5m Total length $4,938,000 Total costs180,552 Total average daily traffic14,205 Total average daily truck traffic198,599 Total future (year 2036) average daily traffic
New bridges - historical statistics
3 1950-1959 7 1960-1969 7 1970-1979 3 1980-1989 1 2000-2009
See full National Bridge Inventory statistics for Zachary, LA
Home Mortgage Disclosure Act Aggregated Statistics For Year 2009(Based on 2 partial tracts) A) FHA, FSA/RHS & VA B) Conventional C) Refinancings D) Home Improvement Loans F) Non-occupant Loans on G) Loans On Manufactured Number Average Value Number Average Value Number Average Value Number Average Value Number Average Value Number Average Value
LOANS ORIGINATED 97 $198,276 83 $192,300 237 $174,626 26 $73,372 22 $143,626 9 $65,646 APPLICATIONS APPROVED, NOT ACCEPTED 6 $194,120 6 $205,063 25 $177,810 0 $0 2 $125,810 0 $0 APPLICATIONS DENIED 27 $202,645 13 $157,941 92 $179,716 16 $38,726 7 $93,567 6 $67,160 APPLICATIONS WITHDRAWN 14 $188,617 9 $157,138 52 $185,710 2 $105,020 3 $149,893 2 $45,180 FILES CLOSED FOR INCOMPLETENESS 7 $175,301 2 $230,740 16 $170,762 2 $95,510 0 $0 1 $137,540
Aggregated Statistics For Year 2008(Based on 2 partial tracts) A) FHA, FSA/RHS & VA B) Conventional C) Refinancings D) Home Improvement Loans F) Non-occupant Loans on G) Loans On Manufactured Number Average Value Number Average Value Number Average Value Number Average Value Number Average Value Number Average Value
LOANS ORIGINATED 66 $190,370 131 $192,639 184 $160,924 39 $53,402 20 $134,110 13 $55,772 APPLICATIONS APPROVED, NOT ACCEPTED 10 $175,022 17 $178,512 30 $180,436 5 $115,024 1 $108,340 6 $61,882 APPLICATIONS DENIED 23 $182,977 30 $153,724 112 $171,001 26 $98,640 5 $90,860 9 $62,127 APPLICATIONS WITHDRAWN 10 $196,095 13 $215,129 37 $184,005 6 $87,113 2 $319,620 2 $84,875 FILES CLOSED FOR INCOMPLETENESS 3 $220,363 6 $216,748 13 $176,605 1 $50,260 0 $0 0 $0
Aggregated Statistics For Year 2007(Based on 2 partial tracts) A) FHA, FSA/RHS & VA B) Conventional C) Refinancings D) Home Improvement Loans F) Non-occupant Loans on G) Loans On Manufactured Number Average Value Number Average Value Number Average Value Number Average Value Number Average Value Number Average Value
LOANS ORIGINATED 26 $170,687 321 $164,609 166 $137,056 47 $44,292 53 $135,822 17 $83,684 APPLICATIONS APPROVED, NOT ACCEPTED 1 $264,890 49 $147,927 40 $139,136 3 $45,153 7 $104,636 7 $49,646 APPLICATIONS DENIED 3 $153,230 53 $145,702 142 $152,942 36 $78,293 5 $86,224 8 $63,216 APPLICATIONS WITHDRAWN 2 $279,135 24 $165,674 49 $154,853 9 $114,324 5 $128,666 2 $54,920 FILES CLOSED FOR INCOMPLETENESS 0 $0 9 $179,891 15 $199,016 1 $47,970 0 $0 0 $0
Aggregated Statistics For Year 2006(Based on 2 partial tracts) A) FHA, FSA/RHS & VA B) Conventional C) Refinancings D) Home Improvement Loans F) Non-occupant Loans on G) Loans On Manufactured Number Average Value Number Average Value Number Average Value Number Average Value Number Average Value Number Average Value
LOANS ORIGINATED 29 $149,722 348 $134,956 169 $122,159 40 $42,033 58 $106,814 16 $60,521 APPLICATIONS APPROVED, NOT ACCEPTED 2 $201,965 40 $155,488 39 $124,626 7 $54,053 5 $87,192 5 $55,296 APPLICATIONS DENIED 3 $149,957 67 $127,925 127 $135,276 35 $75,602 15 $104,893 5 $46,010 APPLICATIONS WITHDRAWN 3 $168,773 42 $124,379 74 $137,436 10 $93,119 11 $90,845 1 $77,260 FILES CLOSED FOR INCOMPLETENESS 0 $0 27 $128,964 34 $144,018 0 $0 12 $92,582 0 $0
Aggregated Statistics For Year 2005(Based on 2 partial tracts) A) FHA, FSA/RHS & VA B) Conventional C) Refinancings D) Home Improvement Loans F) Non-occupant Loans on G) Loans On Manufactured Number Average Value Number Average Value Number Average Value Number Average Value Number Average Value Number Average Value
LOANS ORIGINATED 32 $134,812 218 $126,617 165 $110,595 33 $39,823 37 $96,858 14 $58,763 APPLICATIONS APPROVED, NOT ACCEPTED 1 $61,550 29 $124,664 40 $122,211 3 $25,933 1 $257,210 4 $44,145 APPLICATIONS DENIED 2 $123,450 54 $98,051 155 $134,206 17 $36,198 5 $97,350 14 $55,429 APPLICATIONS WITHDRAWN 2 $85,630 22 $129,998 106 $140,497 14 $182,521 5 $130,778 1 $96,710 FILES CLOSED FOR INCOMPLETENESS 1 $192,360 10 $116,322 20 $146,976 0 $0 1 $105,770 0 $0
Aggregated Statistics For Year 2004(Based on 2 partial tracts) A) FHA, FSA/RHS & VA B) Conventional C) Refinancings D) Home Improvement Loans F) Non-occupant Loans on G) Loans On Manufactured Number Average Value Number Average Value Number Average Value Number Average Value Number Average Value Number Average Value
LOANS ORIGINATED 28 $132,405 172 $117,288 206 $120,671 35 $44,802 26 $77,401 11 $48,680 APPLICATIONS APPROVED, NOT ACCEPTED 2 $127,120 28 $132,699 39 $114,818 4 $46,998 5 $131,820 4 $57,265 APPLICATIONS DENIED 3 $111,107 33 $97,912 139 $124,177 26 $37,897 5 $130,298 11 $46,512 APPLICATIONS WITHDRAWN 2 $88,585 22 $140,762 90 $131,418 3 $28,880 5 $104,344 3 $53,650 FILES CLOSED FOR INCOMPLETENESS 1 $152,560 4 $125,415 17 $127,814 2 $56,075 1 $70,750 0 $0
Aggregated Statistics For Year 2003(Based on 2 partial tracts) A) FHA, FSA/RHS & VA B) Conventional C) Refinancings D) Home Improvement Loans E) Loans on Dwellings For 5+ Families F) Non-occupant Loans on Number Average Value Number Average Value Number Average Value Number Average Value Number Average Value Number Average Value
LOANS ORIGINATED 43 $124,849 153 $119,712 343 $114,793 36 $27,750 0 $0 26 $93,023 APPLICATIONS APPROVED, NOT ACCEPTED 3 $156,073 25 $100,892 52 $96,944 3 $27,830 0 $0 3 $109,760 APPLICATIONS DENIED 7 $107,830 33 $92,957 137 $100,101 17 $20,824 1 $615,390 8 $77,080 APPLICATIONS WITHDRAWN 2 $99,475 15 $106,145 85 $118,859 1 $23,650 0 $0 1 $85,960 FILES CLOSED FOR INCOMPLETENESS 12 $113,918 7 $104,800 11 $88,594 0 $0 0 $0 0 $0
Aggregated Statistics For Year 2002(Based on 1 partial tract) A) FHA, FSA/RHS & VA B) Conventional C) Refinancings D) Home Improvement Loans F) Non-occupant Loans on Number Average Value Number Average Value Number Average Value Number Average Value Number Average Value
LOANS ORIGINATED 5 $99,842 15 $92,541 35 $98,423 8 $15,548 4 $64,312 APPLICATIONS APPROVED, NOT ACCEPTED 0 $0 4 $50,090 8 $87,448 2 $16,345 1 $28,020 APPLICATIONS DENIED 6 $59,218 19 $52,013 24 $91,621 7 $16,799 1 $114,190 APPLICATIONS WITHDRAWN 0 $0 1 $119,710 9 $85,466 0 $0 0 $0 FILES CLOSED FOR INCOMPLETENESS 1 $104,430 0 $0 9 $85,938 0 $0 0 $0
Aggregated Statistics For Year 2001(Based on 1 partial tract) A) FHA, FSA/RHS & VA B) Conventional C) Refinancings D) Home Improvement Loans F) Non-occupant Loans on Number Average Value Number Average Value Number Average Value Number Average Value Number Average Value
LOANS ORIGINATED 6 $84,122 13 $86,369 37 $93,918 4 $13,478 3 $51,223 APPLICATIONS APPROVED, NOT ACCEPTED 0 $0 4 $115,465 11 $80,539 0 $0 0 $0 APPLICATIONS DENIED 0 $0 11 $46,077 35 $80,340 5 $20,460 2 $43,725 APPLICATIONS WITHDRAWN 0 $0 1 $25,050 9 $95,371 0 $0 0 $0 FILES CLOSED FOR INCOMPLETENESS 0 $0 0 $0 2 $261,070 0 $0 0 $0
Aggregated Statistics For Year 2000(Based on 1 partial tract) A) FHA, FSA/RHS & VA B) Conventional C) Refinancings D) Home Improvement Loans F) Non-occupant Loans on Number Average Value Number Average Value Number Average Value Number Average Value Number Average Value
LOANS ORIGINATED 4 $94,240 15 $72,561 22 $78,803 4 $18,360 3 $41,743 APPLICATIONS APPROVED, NOT ACCEPTED 0 $0 5 $39,394 10 $65,118 2 $15,070 0 $0 APPLICATIONS DENIED 2 $62,615 22 $52,079 30 $60,987 4 $17,298 0 $0 APPLICATIONS WITHDRAWN 0 $0 4 $100,075 11 $59,545 1 $40,330 0 $0 FILES CLOSED FOR INCOMPLETENESS 0 $0 0 $0 6 $66,647 0 $0 0 $0
Aggregated Statistics For Year 1999(Based on 2 partial tracts) A) FHA, FSA/RHS & VA B) Conventional C) Refinancings D) Home Improvement Loans F) Non-occupant Loans on Number Average Value Number Average Value Number Average Value Number Average Value Number Average Value
LOANS ORIGINATED 30 $93,506 82 $107,899 101 $93,028 24 $20,238 6 $56,762 APPLICATIONS APPROVED, NOT ACCEPTED 0 $0 15 $47,858 29 $69,929 8 $20,311 0 $0 APPLICATIONS DENIED 3 $85,460 51 $49,407 55 $67,521 12 $13,115 2 $41,970 APPLICATIONS WITHDRAWN 1 $53,580 6 $109,443 33 $77,755 1 $82,820 0 $0 FILES CLOSED FOR INCOMPLETENESS 0 $0 4 $101,745 10 $78,995 0 $0 2 $34,110
Detailed HMDA statistics for the following Tracts:
0046.02
, 0046.04
Private Mortgage Insurance Companies Aggregated Statistics For Year 2009(Based on 2 partial tracts) A) Conventional B) Refinancings Number Average Value Number Average Value
LOANS ORIGINATED 19 $227,066 16 $200,874 APPLICATIONS APPROVED, NOT ACCEPTED 6 $236,233 3 $172,123 APPLICATIONS DENIED 0 $0 0 $0 APPLICATIONS WITHDRAWN 1 $154,770 4 $184,435 FILES CLOSED FOR INCOMPLETENESS 1 $161,400 0 $0
Aggregated Statistics For Year 2008(Based on 2 partial tracts) A) Conventional B) Refinancings C) Non-occupant Loans on Number Average Value Number Average Value Number Average Value
LOANS ORIGINATED 57 $203,851 18 $224,576 2 $169,635 APPLICATIONS APPROVED, NOT ACCEPTED 16 $204,277 8 $211,871 2 $153,480 APPLICATIONS DENIED 2 $157,930 4 $234,735 1 $242,470 APPLICATIONS WITHDRAWN 1 $185,510 0 $0 0 $0 FILES CLOSED FOR INCOMPLETENESS 0 $0 1 $90,650 0 $0
Aggregated Statistics For Year 2007(Based on 2 partial tracts) A) Conventional B) Refinancings C) Non-occupant Loans on Number Average Value Number Average Value Number Average Value
LOANS ORIGINATED 138 $178,586 30 $165,989 9 $127,287 APPLICATIONS APPROVED, NOT ACCEPTED 18 $189,293 4 $190,375 0 $0 APPLICATIONS DENIED 1 $144,330 0 $0 0 $0 APPLICATIONS WITHDRAWN 6 $166,127 3 $187,240 1 $115,040 FILES CLOSED FOR INCOMPLETENESS 0 $0 1 $97,280 0 $0
Aggregated Statistics For Year 2006(Based on 2 partial tracts) A) Conventional B) Refinancings C) Non-occupant Loans on D) Loans On Manufactured Number Average Value Number Average Value Number Average Value Number Average Value
LOANS ORIGINATED 87 $162,002 12 $167,372 6 $116,835 1 $113,670 APPLICATIONS APPROVED, NOT ACCEPTED 14 $189,835 5 $164,886 1 $71,490 0 $0 APPLICATIONS DENIED 1 $213,730 0 $0 1 $58,960 0 $0 APPLICATIONS WITHDRAWN 2 $176,950 0 $0 0 $0 0 $0 FILES CLOSED FOR INCOMPLETENESS 1 $271,950 0 $0 0 $0 0 $0
Aggregated Statistics For Year 2005(Based on 2 partial tracts) A) Conventional B) Refinancings C) Non-occupant Loans on Number Average Value Number Average Value Number Average Value
LOANS ORIGINATED 53 $156,995 17 $177,530 2 $131,055 APPLICATIONS APPROVED, NOT ACCEPTED 8 $130,727 6 $163,783 0 $0 APPLICATIONS DENIED 0 $0 0 $0 0 $0 APPLICATIONS WITHDRAWN 2 $122,685 3 $196,910 0 $0 FILES CLOSED FOR INCOMPLETENESS 1 $129,710 0 $0 0 $0
Aggregated Statistics For Year 2004(Based on 2 partial tracts) A) Conventional B) Refinancings C) Non-occupant Loans on Number Average Value Number Average Value Number Average Value
LOANS ORIGINATED 50 $138,158 26 $148,768 4 $100,262 APPLICATIONS APPROVED, NOT ACCEPTED 6 $156,898 12 $143,141 1 $58,220 APPLICATIONS DENIED 0 $0 2 $201,245 0 $0 APPLICATIONS WITHDRAWN 1 $239,530 1 $164,350 0 $0 FILES CLOSED FOR INCOMPLETENESS 0 $0 1 $145,190 0 $0
Aggregated Statistics For Year 2003(Based on 2 partial tracts) A) Conventional B) Refinancings C) Non-occupant Loans on Number Average Value Number Average Value Number Average Value
LOANS ORIGINATED 72 $125,809 71 $137,989 10 $102,137 APPLICATIONS APPROVED, NOT ACCEPTED 15 $134,335 14 $138,980 3 $87,210 APPLICATIONS DENIED 2 $123,080 0 $0 1 $79,600 APPLICATIONS WITHDRAWN 5 $136,050 4 $111,655 2 $141,135 FILES CLOSED FOR INCOMPLETENESS 1 $52,330 0 $0 0 $0
Aggregated Statistics For Year 2002(Based on 1 partial tract) A) Conventional B) Refinancings Number Average Value Number Average Value
LOANS ORIGINATED 4 $105,595 6 $120,133 APPLICATIONS APPROVED, NOT ACCEPTED 0 $0 2 $99,545 APPLICATIONS DENIED 0 $0 0 $0 APPLICATIONS WITHDRAWN 0 $0 1 $97,640 FILES CLOSED FOR INCOMPLETENESS 0 $0 0 $0
Aggregated Statistics For Year 2001(Based on 1 partial tract) A) Conventional B) Refinancings Number Average Value Number Average Value
LOANS ORIGINATED 1 $194,420 7 $137,841 APPLICATIONS APPROVED, NOT ACCEPTED 0 $0 1 $77,260 APPLICATIONS DENIED 0 $0 0 $0 APPLICATIONS WITHDRAWN 0 $0 0 $0 FILES CLOSED FOR INCOMPLETENESS 0 $0 0 $0
Aggregated Statistics For Year 2000(Based on 1 partial tract) A) Conventional Number Average Value
LOANS ORIGINATED 2 $60,065 APPLICATIONS APPROVED, NOT ACCEPTED 0 $0 APPLICATIONS DENIED 0 $0 APPLICATIONS WITHDRAWN 0 $0 FILES CLOSED FOR INCOMPLETENESS 0 $0
Aggregated Statistics For Year 1999(Based on 2 partial tracts) A) Conventional B) Refinancings C) Non-occupant Loans on Number Average Value Number Average Value Number Average Value
LOANS ORIGINATED 28 $127,308 13 $110,778 1 $47,960 APPLICATIONS APPROVED, NOT ACCEPTED 2 $92,580 3 $114,020 0 $0 APPLICATIONS DENIED 0 $0 0 $0 0 $0 APPLICATIONS WITHDRAWN 1 $96,260 1 $130,150 0 $0 FILES CLOSED FOR INCOMPLETENESS 0 $0 0 $0 0 $0
Detailed PMIC statistics for the following Tracts:
0046.02
, 0046.04 Fire-safe hotels and motels in Zachary, Louisiana:
Best Western Zachary Inn, 4030 Hwy 19, Zachary, Louisiana 70791 Phone: (225) 658-2550, Fax: (225) 658-2570
Holiday Inn Express & Suites, 4047 Hwy 19, Zachary, Louisiana 70791 Phone: (225) 654-1402, Fax: (225) 612-6584
Comfort Inn & Suites, 1686 East Mt Pleasant Rd, Zachary, Louisiana 70791 Phone: (225) 286-4011, Fax: (225) 286-4016
Best Western Zachary Inn, 4030 Hwy 19, Zachary, Louisiana 70791 Phone: (225) 658-2550, Fax: (225) 612-6584
All 4 fire-safe hotels and motels in Zachary, Louisiana
Most common first names in Zachary, LA among deceased individuals Name Count Lived (average)
James 106 72.9 years Mary 98 78.2 years John 84 75.2 years Robert 60 72.8 years Willie 54 71.8 years Henry 52 71.7 years William 51 70.2 years George 45 74.5 years Charles 35 74.9 years Joseph 35 72.4 years
Most common last names in Zachary, LA among deceased individuals Last name Count Lived (average)
Williams 68 74.0 years Smith 67 72.6 years Johnson 63 71.3 years Jackson 43 69.4 years Jones 43 72.1 years Stewart 42 75.9 years Brown 33 74.9 years Scott 30 73.0 years White 27 73.7 years Davis 25 77.2 years
Zachary compared to Louisiana state average:
Unemployed percentage significantly below state average. Black race population percentage above state average. Hispanic race population percentage significantly below state average. Median age below state average. Renting percentage below state average. Length of stay since moving in significantly above state average. House age below state average. Percentage of population with a bachelor's degree or higher above state average.
#88 on the list of "Top 101 cities with the largest percentage of people in other hospitals or wards for chronically ill (population 1,000+)"
#6 on the list of "Top 101 counties with the highest number of infant deaths per 1000 residents 2007-2013 (pop. 50,000+)"
#24 on the list of "Top 101 counties with the most Black Protestant adherents"
#28 on the list of "Top 101 counties with the largest increase in the number of infant deaths per 1000 residents 2000-2006 to 2007-2013 (pop. 50,000+)"
#34 on the list of "Top 101 counties with the highest ground withdrawal of fresh water for public supply"
#37 on the list of "Top 101 counties with the lowest percentage of residents that drank alcohol in the past 30 days"
Top Patent Applicants
Christopher J. Nalepa (18)
Dustin K. Amrhein (15)
Edwin L. Mcinnis (5)
Rachel A. Power (5)
Randolph K. Belter (4)
Bo Liu (3)
Darrell J. Phillips (3)
Mewa Singh (2)
Sujith Sathian (2)
Eric Lee Williams (2)
Total of 85 patent applications in 2008-2025.


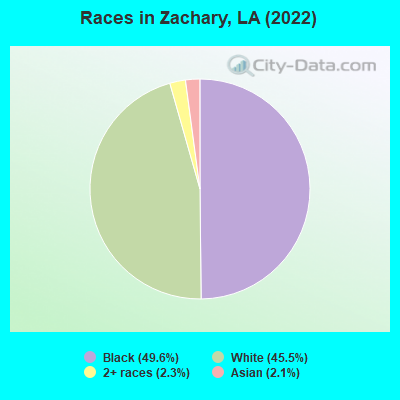
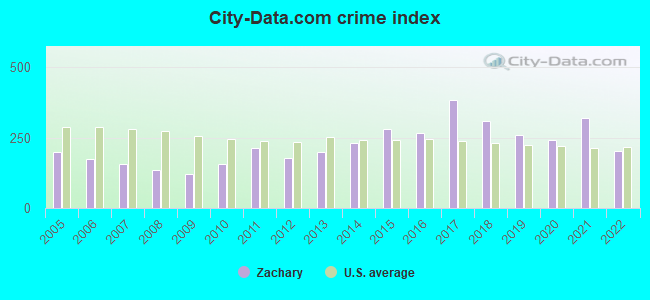
 Recent articles from our blog. Our writers, many of them Ph.D. graduates or candidates, create easy-to-read articles on a wide variety of topics.


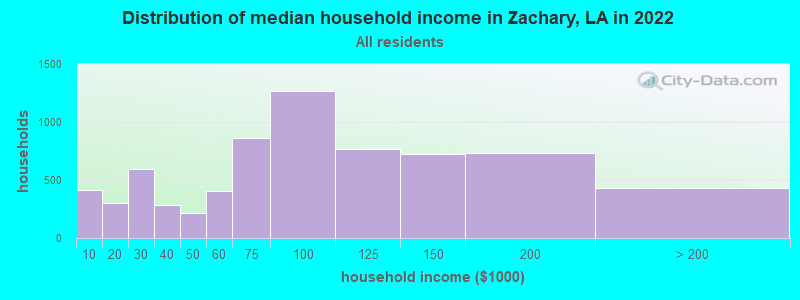
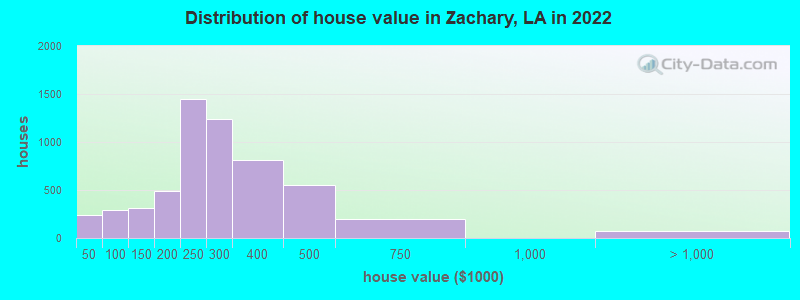

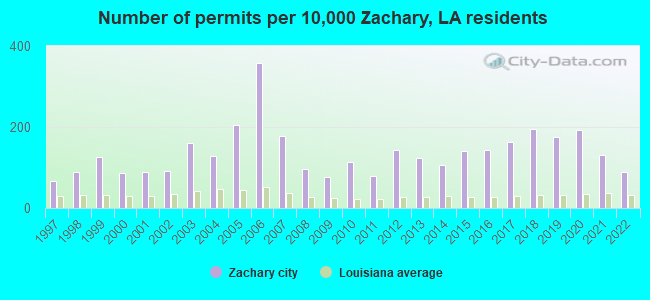
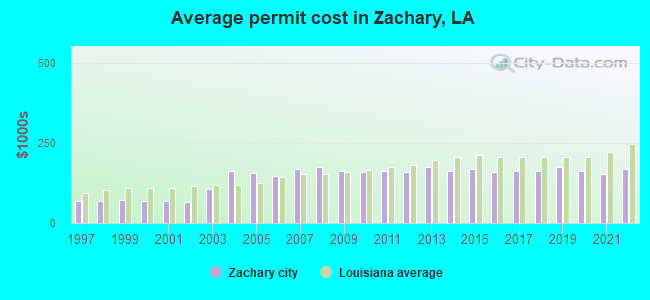
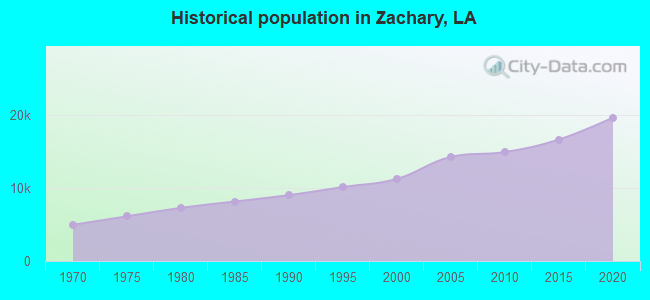
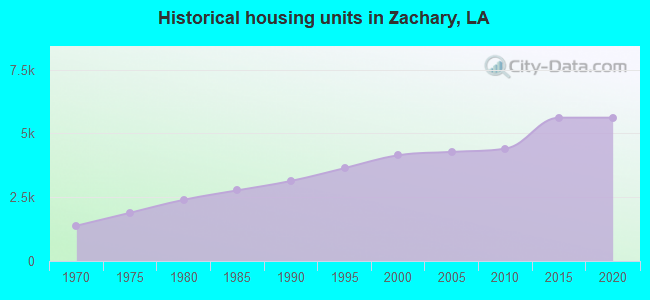


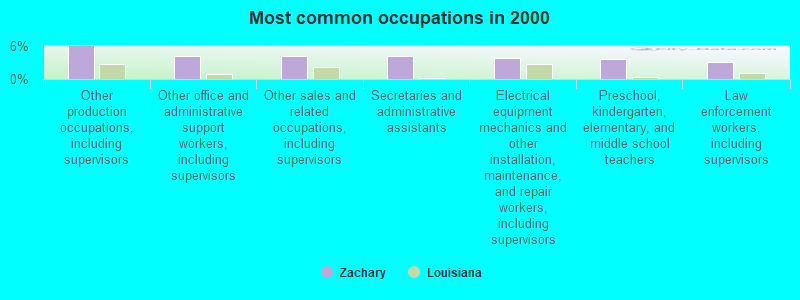
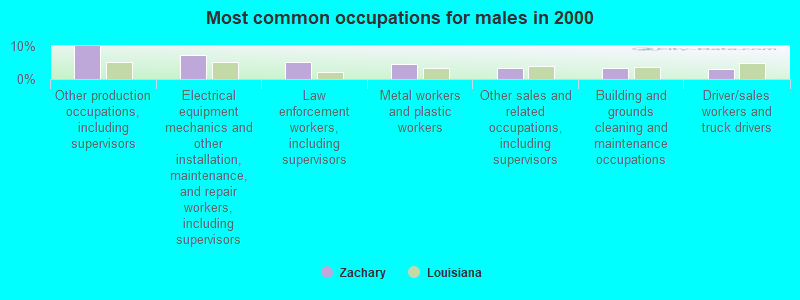
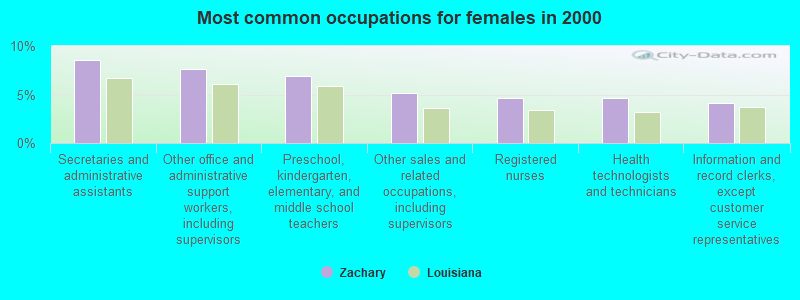


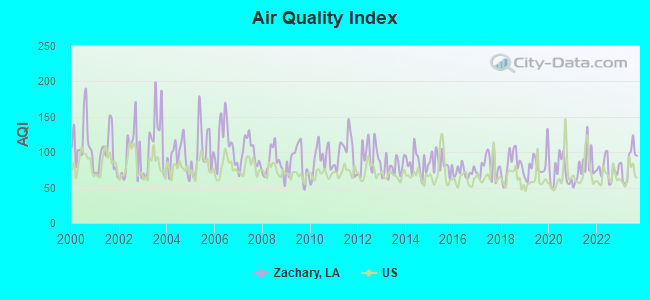
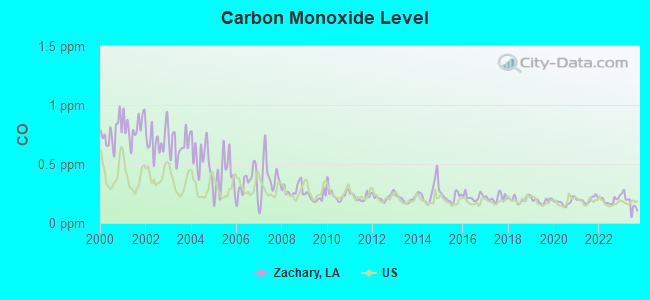
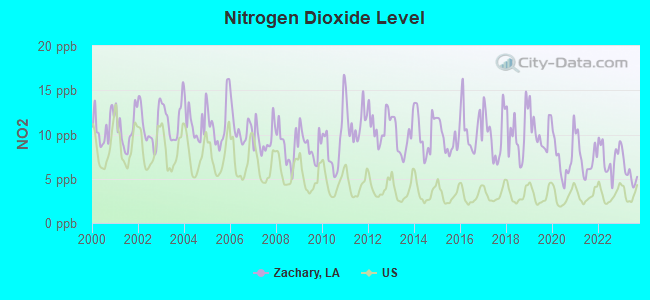
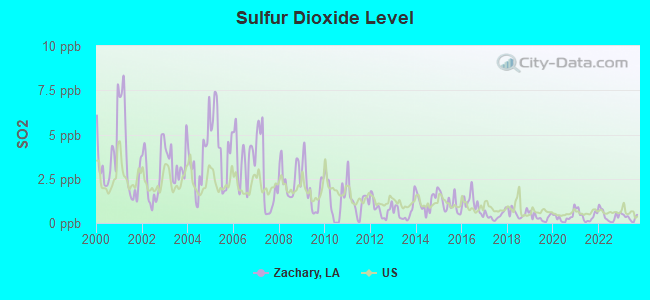
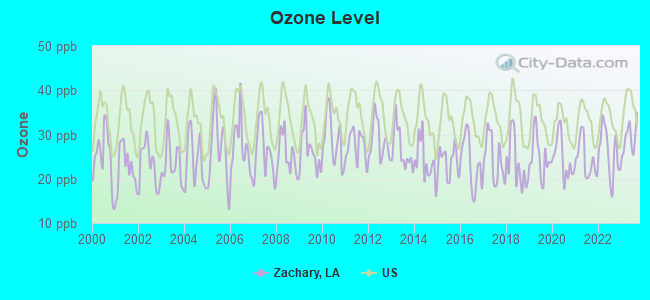
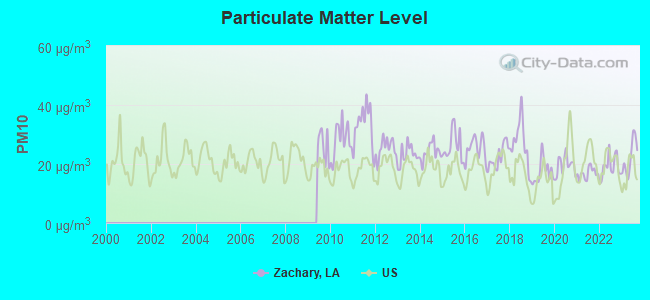
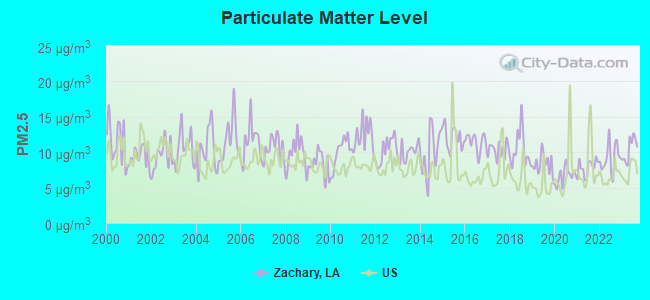

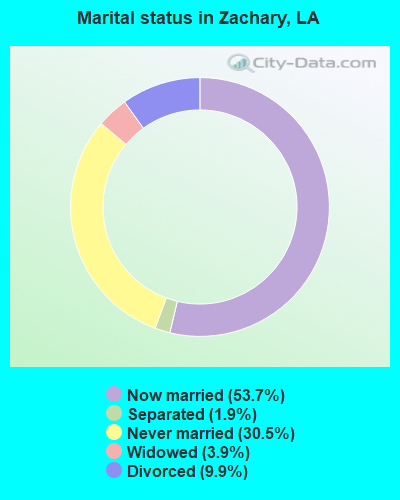
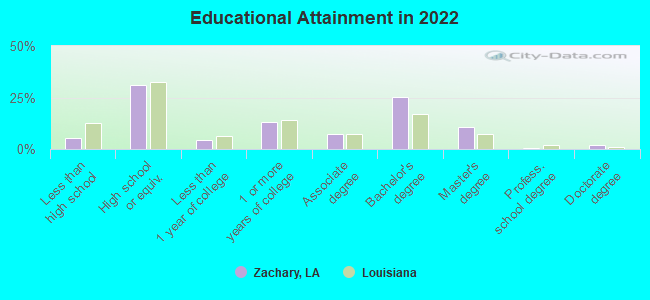
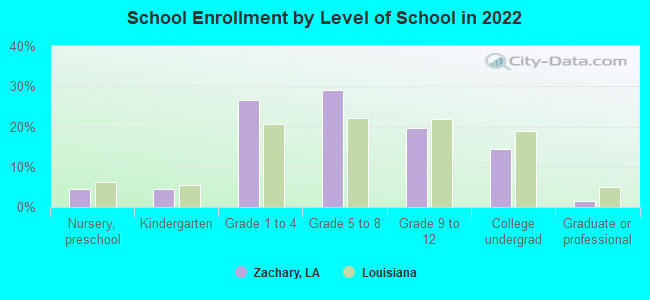
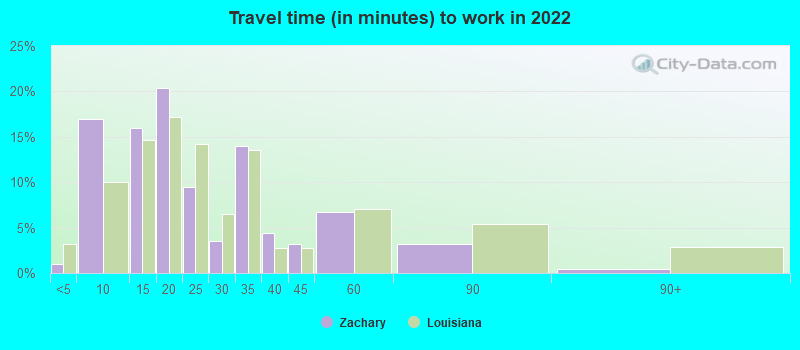
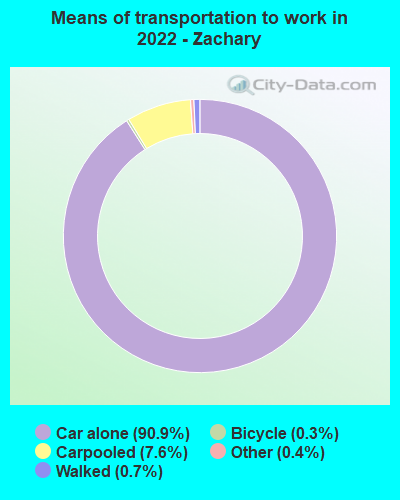
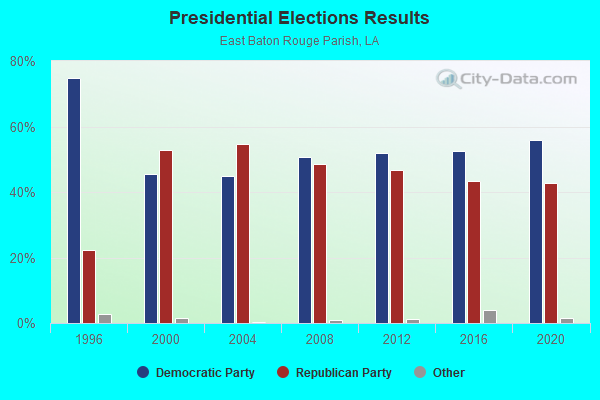
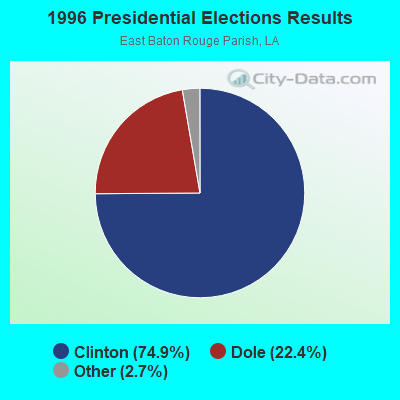
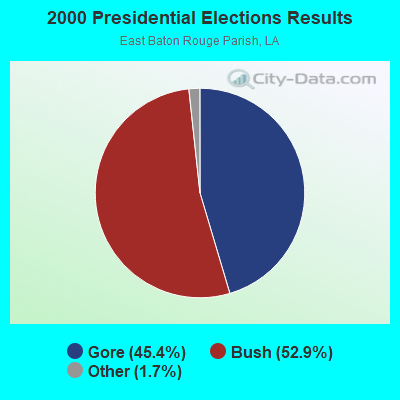
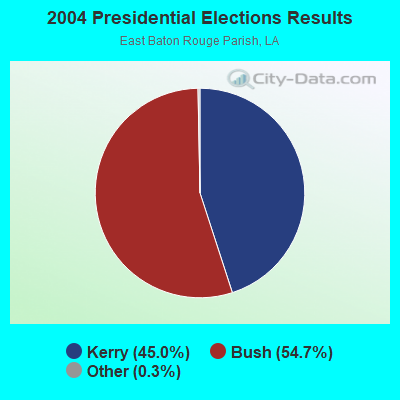

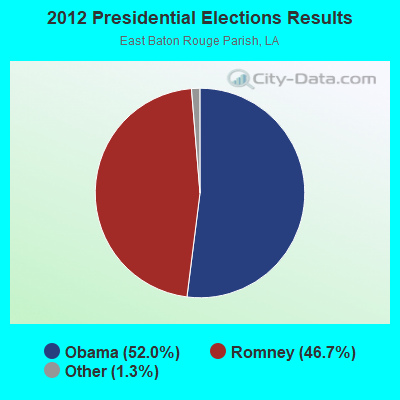
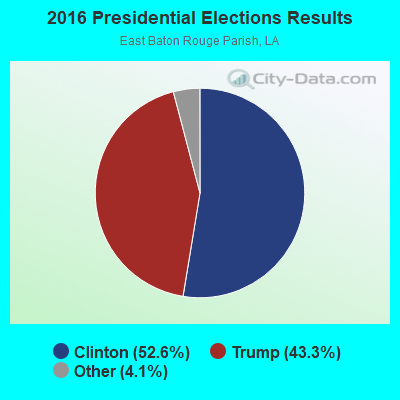
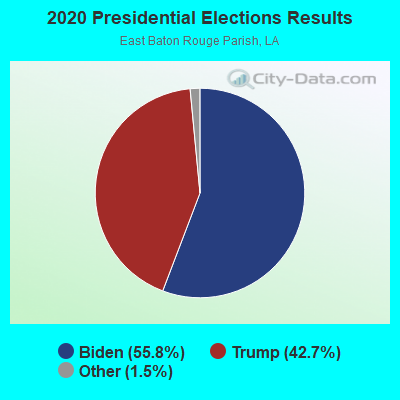

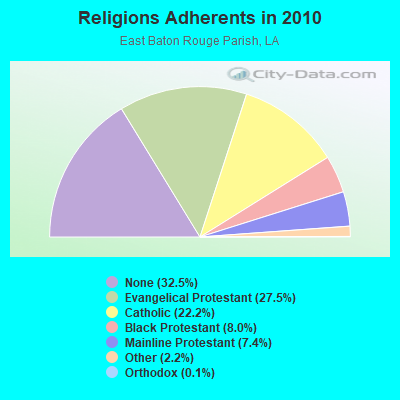
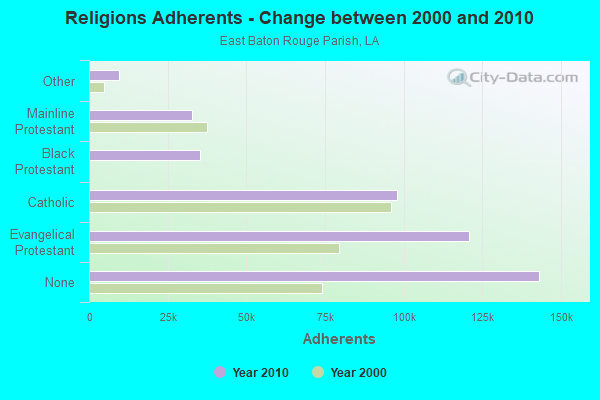
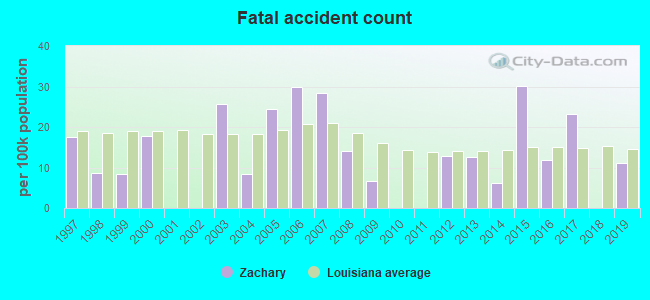
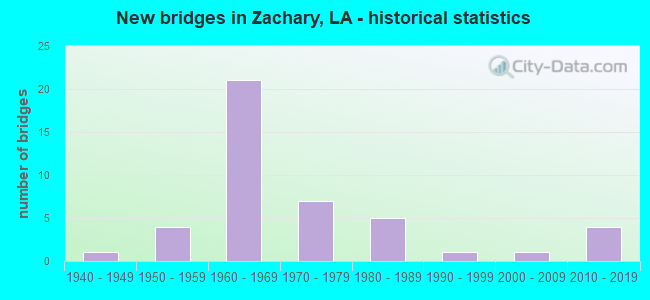
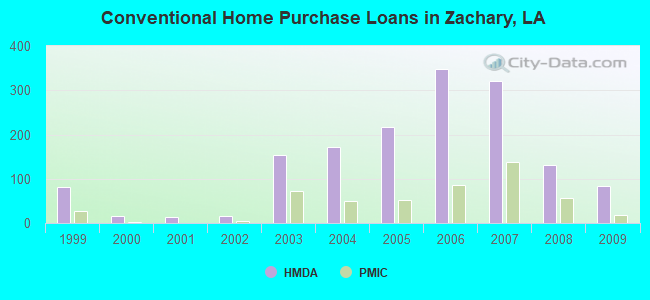
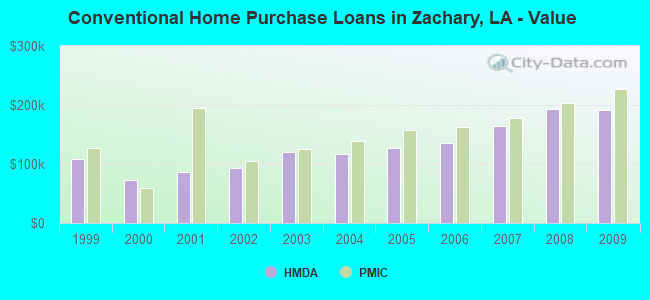
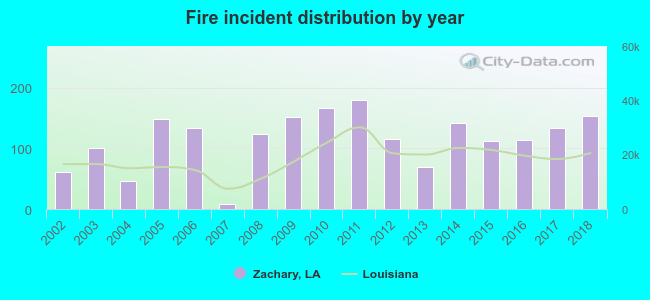 According to the data from the years 2002 - 2018 the average number of fire incidents per year is 115. The highest number of reported fires - 179 took place in 2011, and the least - 8 in 2007. The data has an increasing trend.
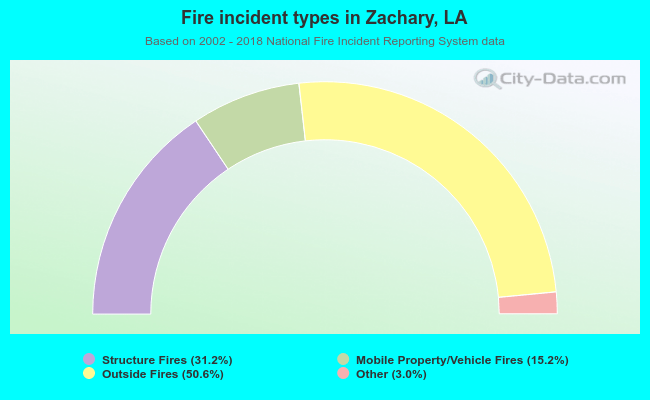 When looking into fire subcategories, the most incidents belonged to: Outside Fires (50.6%), and Structure Fires (31.2%).