Atrial fibrillation EKG examples
|
Atrial Fibrillation Microchapters | |
|
Special Groups | |
|---|---|
|
Diagnosis | |
|
Treatment | |
|
Cardioversion | |
|
Anticoagulation | |
|
Surgery | |
|
Case Studies | |
|
Atrial fibrillation EKG examples On the Web | |
|
Directions to Hospitals Treating Atrial fibrillation EKG examples | |
|
Risk calculators and risk factors for Atrial fibrillation EKG examples | |
Editor-In-Chief: C. Michael Gibson, M.S., M.D. [1] Associate Editor: Cafer Zorkun, M.D., Ph.D. [2]
Overview
Atrial fibrillation is characterized by the absence of P waves, with unorganized electrical activity in their place, and irregularity of R-R interval due to irregular conduction of impulses to the ventricles.
EKG Examples
For the main page on atrial fibrillation, click here.
Shown below is an EKG showing absent P waves and an irregularly irregular heart rate, suggestive of atrial fibrillation.

Shown below is an EKG showing the absence of P waves and an irregularly irregular heart rate, suggestive of atrial fibrillation.

Shown below is an EKG with no P waves throughout the precordium, and an irregular heart rate, suggestive of atrial fibrillation. The EKG also shows a left axis deviation.

Shown below is an EKG showing absent P wave, rapid ventricular beat and irregularly irregular heart rate, suggestive of atrial fibrillation.

Shown below is an EKG showing irregularly irregular rhythm with no P waves, suggestive of atrial fibrillation.

Shown below is an EKG showing irregularly irregular rhythm with no P waves, suggestive of atrial fibrillation.

Shown below is an EKG showing irregular heart rate with no P waves, suggestive of atrial fibrillation. It also shows premature ventricular beats and inverted T waves in leads V3, V4, V5, and V6 suggestive of recent infarction or ischemia.

Shown below is an EKG showing irregularly irregular heart rate with no P waves, suggestive of atrial fibrillation. The EKG also shows a left axis deviation and inverted T waves in lead V4, V5, and V6, suggesting a recent infarction or ischemia.

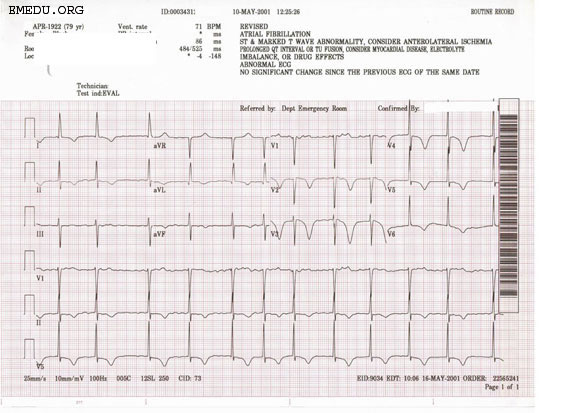
Shown below is an EKG showing irregularly irregular pulse with no P waves, suggestive of atrial fibrillation. The EKG also shows a left axis deviation and inverted T waves in leads V2, V3, V4, V5, and V6 suggestive of a recent infarction/ischemia.

Shown below is an EKG showing irregular heart rate with no P waves, suggestive of atrial fibrillation. The EKG also shows a left axia deviation.

Shown below is an EKG showing absent P waves, suggestive of atrial fibrillation. Bradycardia is also noted.

Shown below is an EKG showing conversion of an atrial fibrillation pattern with no P waves to regular sinus rhythm with atrial P waves on cardioversion.

Copyleft image obtained courtesy of ECGpedia, http://en.ecgpedia.org/wiki/Main_Page
Shown below is a strip from a patient being cardioverted as a treatment o atrial fibrillation. The patient was taking sotalol and coumadin. This is the first shock which was set at 150 joules and delivered via defibrillator pads placed with the positive in the V1 position and the negative on the back between the left scapula and the spine.

Copyleft image obtained courtesy of ECGpedia, http://en.ecgpedia.org/wiki/Main_Page
Shown below is an EKG showing irregular heart rate with no P waves, suggestive of atrial fibrillation. The EKG also shows left axis deviation.

Shown below is an EKG showing irregularly irregular pulse with no P waves, suggestive of atrial fibrillation. The EKG also shows left axis deviation.

Shown below is an EKG showing irregularly irregular pulse with no P waves, suggestive of atrial fibrillation

Shown below is an EKG showing absent P waves suggestive of atrial fibrillation along with bradycardia.

Shown below is an EKG showing irregularly irregular pulse with no P waves, suggestive of atrial fibrillation. The EKG also shows a left axis deviation.

Shown below is an EKG showing no P waves and irregularly irregular heart rate, suggestive of atrial fibrillation. The EKG also shows left axis deviation and left ventricular strain pattern with inverted T waves in leads V2, V3, V4, V5, and V6.

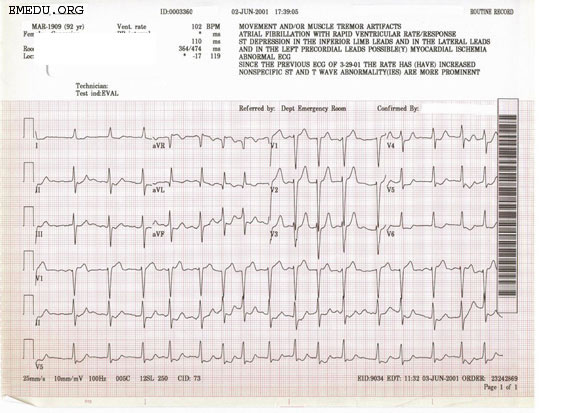
Shown below is an EKG showing no P waves and irregularly irregular heart rate with the rapid ventricular response, suggestive of atrial fibrillation. Some non-specific ST wave and T wave changes are noted in leads V2, V3, V4, and V5.

Shown below is an EKG showing absence of P waves and irregularly irregular heart rhythm, suggestive of atrial fibrillation. The EKG also shows left axis deviation and inverted T waves in leads II, aVF, V2, V3, V4, V5, and V6.

Shown below is an EKG showing irregularly irregular heart rhythm and no P waves, characteristic of atrial fibrillation.

Shown below is an EKG showing absent P waves and irregularly irregular heart rhythm, suggestive of atrial fibrillation. The EKG also shows inverted T waves, most likely suggestive of ischemia/infarction.

Shown below is an EKG showing absent P waves and irregularly irregular heart rhythm, suggestive of atrial fibrillation.

Shown below is an EKG showing irregularly irregular heart rhythm and absent P waves, suggestive of atrial fibrillation. The EKG also shows inverted T waves, most likely suggestive of ischemia/infarction.

Shown below is an EKG showing irregularly irregular heart rhythm and absent P waves, suggestive of atrial fibrillation.

Shown below is an EKG showing irregularly irregular heart rhythm and absent P waves, suggestive of atrial fibrillation. The EKG also shows a slow ventricular response at a heart rate of 50 beats per minute.

Shown below is an EKG showing irregularly irregular heart rhythm and absent P waves, suggestive of atrial fibrillation. The EKG also shows inverted T waves, most likely suggestive of ischemia/infarction.

Shown below is an EKG showing absent P waves and disorganized atrial activity and irregularly irregular R-R interval on the upper tracing, suggestive of atrial fibrillation. The lower strip shows normal conduction for comparison.

Shown below is an EKG showing no P waves, suggestive of atrial fibrillation along with bigeminy. The EKG also shows a right axis deviation with poor R wave progression on the chest leads.

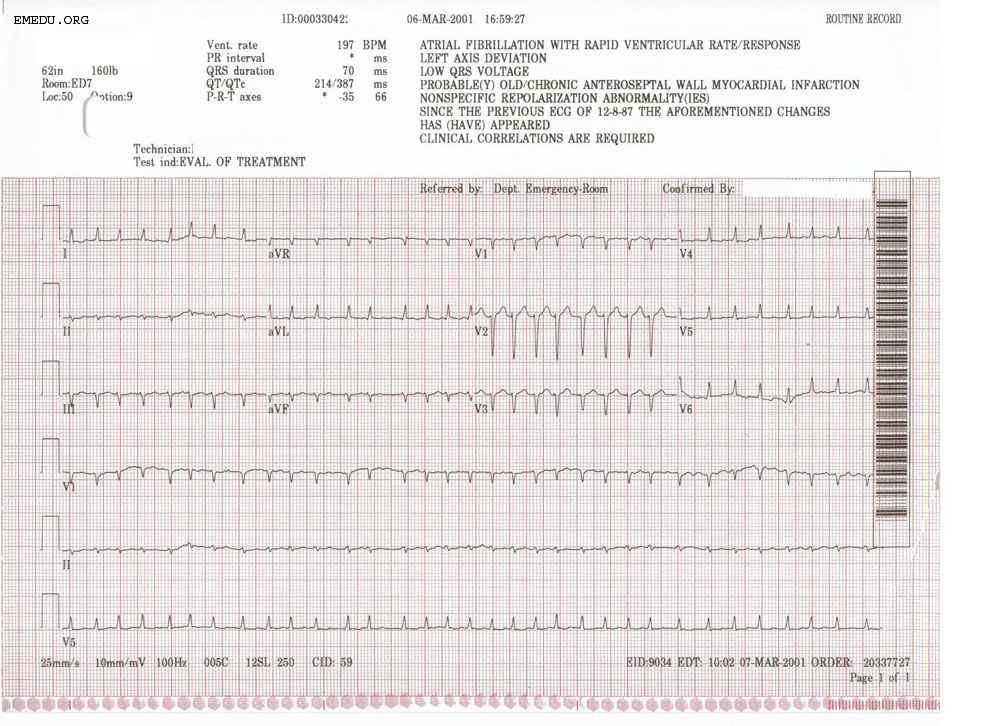
Shown below is an EKG showing absence of P waves with a rapid ventricular response, suggestive of atrial fibrillation. The EKG also shows left axis deviation.

Shown below is an EKG showing absent P waves with a rapid ventricular response rate, suggestive of atrial fibrillation. The EKG also depicts an rSR' pattern (M pattern) and a wide QRS complex in lead V3, suggestive of right bundle branch block.

Shown below is an EKG showing absence of P waves with a rapid ventricular response, suggestive of atrial fibrillation.

Shown below is an EKG showing the absence of P waves with a rapid ventricular response rate and irregularly irregular heart rhythm, suggestive of atrial fibrillation. The EKG also shows left axis deviation and a wide QRS complex.

Shown below is an EKG with irregularly irregular heart rate and no P waves, suggestive of atrial fibrillation. The EKG also shows premature ventricular contractions and ST segment depression in lead V6, suggestive of ischemia.

Shown below is an EKG showing absence of P waves and irregularly irregular heart rhythm, suggestive of atrial fibrillation. The EKG also shows right axis deviation.

Shown below is an EKG showing the absence of P waves and irregularly irregular heart rhythm, suggestive of atrial fibrillation. The EKG also shows premature ventricular contractions and inverted T waves along with ST segment depression throughout the precordium.

Shown below is an EKG showing disorganized atrial activity and no P waves, suggestive of atrial fibrillation. The EKG also shows bigeminy .

Copyleft image obtained courtesy of ECGpedia, http://en.ecgpedia.org/wiki/Main_Page
Shown below is an EKG showing the absence of P waves and irregularly irregular heart rhythm, suggestive of atrial fibrillation.

Shown below is EKG showing no P waves and irregularly irregular heart rate, suggestive of atrial fibrillation with old LBBB.

Shown below is an EKG showing no P waves and irregularly irregular heart rate, suggestive of atrial fibrillation. The EKG also shows left axis deviation with LVH and inverted T waves suggestive of a strain pattern.

Copyleft image obtained courtesy of ECGpedia, http://en.ecgpedia.org/wiki/Main_Page
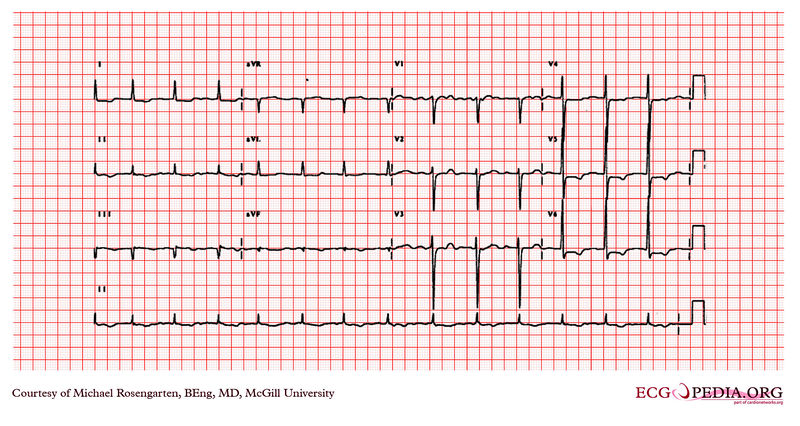
Shown below is EKG showing no P waves and irregular heart rate, suggestive of atrial fibrillation. The R wave in leads V5 and V6 are greater than 35mm and there are ST/T wave changes. This is consistent with left ventricular hypertrophy.

Copyleft image obtained courtesy of ECGpedia, http://en.ecgpedia.org/wiki/Main_Page
Shown below is an EKG that shows atrial fibrillation with widespread ST depressions suggestive of ischemia or possibly non-Q myocardial infarction. In this case, there were no enzyme changes suggestive of a myocardial infarction and the changes most likely represent ischemia secondary to the ventricular tachycardia.

Copyleft image obtained courtesy of ECGpedia, http://en.ecgpedia.org/wiki/Main_Page
Shown below is an EKG showing no P waves and irregular heart rate, suggestive of atrial fibrillation. The QRS is wide (> 120 ms.) has a left axis deviation and a large R' in V1 with an S in I and V6. The EKG shows a complete right bundle branch block and a left anterior fasicular block.

Copyleft image obtained courtesy of ECGpedia, http://en.ecgpedia.org/wiki/Main_Page
Shown below is an EKG showing no P waves and irregular heart rate, suggestive of atrial fibrillation. There are also ST/T wave changes that are nonspecific. The R wave is greater than 30 mm in V5 suggesting left ventricular hypertrophy.

Copyleft image obtained courtesy of ECGpedia, http://en.ecgpedia.org/wiki/Main_Page
The rhythm in the EKG below is that of atrial fibrillation with no P waves, and there are marked increases in the QRS deflections with an R in V6 greater than that in V5 and also greater than 35mm. There are marked ST changes noted. The EKG is diagnostic of left ventricular hypertrophy. This patient has IHSS.

Copyleft image obtained courtesy of ECGpedia, http://en.ecgpedia.org/wiki/Main_Page