
 FPIs raise stake in select stocks despite big selloff
 Raymond and 3 other stocks closed above VWAP on December 20
 Ahead of Market: 10 things that will decide stock market action on Monday
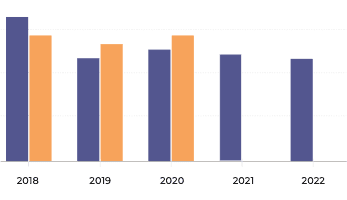
Invest in the Best
Check two-year estimates on Price, Revenue & Earnings
START FREE TRIAL
| Open | 904.00 |
| High | 960.00 |
| Low | 892.55 |
| Prev Close | 906.00 |
| Volume | 1,77,992 |
| VWAP(₹) | 937.37 |
Intraday fact check
In the last 6 years, only 3.24 % trading sessions saw intraday declines higher than 5 % .Beating 3 Yr Revenue CAGR
Company's annual revenue growth of 81.22% outperformed its 3 year CAGR of 19.45%. (Source: Consolidated Financials)Candle Formations Yesterday
White Spinning Top was formed for Techno ElectricEmployee & Interest Expense
Company has spent 1.09% of its operating revenues towards interest expenses and 3.07% towards employee cost in the year ending Mar 31, 2024. (Source: Consolidated Financials)Techno Electric Share Price Update
Techno Electric & Engineering Company Ltd. share price moved up by 5.77% from its previous close of Rs 906.00. Techno Electric & Engineering Company Ltd. stock last traded price is 958.20
| Share Price | Value |
|---|---|
| Today/Current/Last | 958.20 |
| Previous Day | 906.00 |
Found Insights useful?
| 1 Day | 5.77% |
| 1 Month | -25.64% |
| 3 Months | -34.86% |
| 1 Year | 22.02% |
| 3 Years | 268.75% |
| 5 Years | 219.99% |
| PE Ratio(x) | 30.34 |
| EPS - TTM(₹) | 31.46 |
| MCap(₹ Cr.) | 11,107.77 |
| MCap Rank | 16 |
| PB Ratio(x) | 4.87 |
| Div Yield(%) | 0.73 |
| Face Value(₹) | 2.00 |
| 52W High(₹) | 1,822.00 |
| 52W Low(₹) | 607.20 |
| MCap/Sales | 5.52 |
| Beta(1 Month) | 0.46 |
| BV/Share(₹) | 186.01 |
3 Analysts
| Ratings | Current | 1W Ago | 1M Ago | 3M Ago |
|---|---|---|---|---|
| Strong Buy | 2 | 1 | 1 | 1 |
| Buy | 1 | 1 | 2 | 1 |
| Hold | - | - | - | - |
| Sell | - | 1 | 1 | 1 |
| Strong Sell | - | - | - | - |
| # Analysts | 3 | 3 | 4 | 3 |
| Dec 2024 | Sep 2024 | Jun 2024 | Mar 2024 | Dec 2023 | |
|---|---|---|---|---|---|
| Total Income | 680.13 | 480.60 | 399.02 | 470.88 | 371.37 |
| Total Income Growth (%) | 41.52 | 20.45 | -15.26 | 26.79 | -24.38 |
| Total Expenses | 548.35 | 373.24 | 324.96 | 387.21 | 272.20 |
| Total Expenses Growth (%) | 46.92 | 14.86 | -16.08 | 42.25 | -29.59 |
| EBIT | 131.78 | 107.36 | 74.06 | 83.67 | 99.18 |
| EBIT Growth (%) | 22.75 | 44.96 | -11.49 | -15.64 | -5.08 |
| Profit after Tax (PAT) | 95.99 | 94.21 | 98.10 | 77.54 | 91.88 |
| PAT Growth (%) | 1.89 | -3.97 | 26.52 | -15.61 | 24.53 |
| EBIT Margin (%) | 19.38 | 22.34 | 18.56 | 17.77 | 26.71 |
| Net Profit Margin (%) | 14.11 | 19.60 | 24.59 | 16.47 | 24.74 |
| Basic EPS (₹) | 8.25 | 8.22 | 9.12 | 7.20 | 8.53 |
All figures in Rs Cr, unless mentioned otherwise
Beating 3 Yr Revenue CAGR
Company's annual revenue growth of 81.22% outperformed its 3 year CAGR of 19.45%. (Source: Consolidated Financials)Employee & Interest Expense
Company has spent 1.09% of its operating revenues towards interest expenses and 3.07% towards employee cost in the year ending Mar 31, 2024. (Source: Consolidated Financials)| Annual | FY 2024 | FY 2023 | FY 2022 | FY 2021 | FY 2020 |
|---|---|---|---|---|---|
| Total Assets | 2,833.68 | 2,768.88 | 2,515.99 | 2,202.61 | 2,079.47 |
| Total Assets Growth (%) | 2.34 | 10.05 | 14.23 | 5.92 | 3.08 |
| Total Liabilities | 670.44 | 838.68 | 679.23 | 586.34 | 582.96 |
| Total Liabilities Growth (%) | -20.06 | 23.47 | 15.84 | 0.58 | -1.38 |
| Total Equity | 2,163.23 | 1,930.20 | 1,836.76 | 1,616.27 | 1,496.50 |
| Total Equity Growth (%) | 12.07 | 5.09 | 13.64 | 8.00 | 4.92 |
| Current Ratio (x) | 4.30 | 4.42 | 4.78 | 3.74 | 3.31 |
| Total Debt to Equity (x) | 0.00 | 0.00 | 0.00 | 0.02 | 0.00 |
| Contingent Liabilities | 29.78 | 82.57 | 8.15 | 38.45 | 16.92 |
All figures in Rs Cr, unless mentioned otherwise
| Annual | FY 2024 | FY 2023 | FY 2022 | FY 2021 | FY 2020 |
|---|---|---|---|---|---|
| Net Cash flow from Operating Activities | -198.24 | 93.36 | 258.47 | 125.36 | 111.53 |
| Net Cash used in Investing Activities | 268.75 | 12.57 | -223.97 | -54.26 | 37.85 |
| Net Cash flow from Financing Activities | -84.51 | -103.01 | -62.76 | -33.84 | -160.67 |
| Net Cash Flow | -13.99 | 2.92 | -28.26 | 37.26 | -11.28 |
| Closing Cash & Cash Equivalent | 34.41 | 48.40 | 45.48 | 73.75 | 36.49 |
| Closing Cash & Cash Equivalent Growth (%) | -28.91 | 6.42 | -38.32 | 102.12 | -23.62 |
| Total Debt/ CFO (x) | 0.00 | 0.00 | 0.00 | 0.32 | 0.00 |
All figures in Rs Cr, unless mentioned otherwise
| Annual | FY 2024 | FY 2023 | FY 2022 | FY 2021 | FY 2020 |
|---|---|---|---|---|---|
| Return on Equity (%) | 12.41 | 9.68 | 14.36 | 11.24 | 11.96 |
| Return on Capital Employed (%) | 14.88 | 7.03 | 15.87 | 13.64 | 13.34 |
| Return on Assets (%) | 9.47 | 6.74 | 10.48 | 8.25 | 8.61 |
| Interest Coverage Ratio (x) | 21.03 | 15.14 | 66.28 | 36.06 | 42.92 |
| Asset Turnover Ratio (x) | 0.54 | 0.31 | 0.46 | 40.37 | 42.13 |
| Price to Earnings (x) | 30.96 | 19.46 | 10.32 | 18.52 | 14.45 |
| Price to Book (x) | 3.84 | 1.88 | 1.48 | 2.08 | 1.73 |
| EV/EBITDA (x) | 23.62 | 21.59 | 7.17 | 11.75 | 9.69 |
| EBITDA Margin (%) | 22.99 | 19.44 | 34.73 | 31.81 | 29.97 |
Found Financials useful?
Invest in the Best
Check two-year estimates on Price, Revenue & Earnings
Invest in the Best
Check two-year estimates on Price, Revenue & Earnings
Invest in the Best
Check two-year estimates on Price, Revenue & Earnings
No Data Available
Global Meltdown1st Jan 2008 to 10th Nov 2008
Covid Crisis1st Feb 2020 to 31st Mar 2020
| R1 | 976.65 | Pivot 934.60 | S1 | 913.05 |
| R2 | 998.20 | S2 | 871.00 | |
| R3 | 1061.80 | S3 | 807.40 |
| 5 Days | 14 Days | 28 Days |
| 62.45 | 70.25 | 73.65 |
Choose from Peers
Choose from Stocks
No Data Available
Board Meeting
Quarterly Results
Feb 03, 2025
Board Meeting
Quarterly Results
Nov 04, 2024
Board Meeting
Quarterly Results
Nov 04, 2024
| Announced on | Meeting on |
| Feb 03, 2025 | Feb 11, 2025 |
| Quarterly Results | |
| Nov 04, 2024 | Nov 14, 2024 |
| Quarterly Results | |
| Nov 04, 2024 | Nov 12, 2024 |
| Quarterly Results | |
| Aug 01, 2024 | Aug 13, 2024 |
| Quarterly Results | |
| May 17, 2024 | May 28, 2024 |
| Audited Results | |
| Announced on | Ex-Date | Dividend% |
| May 29, 2024 | Sep 13, 2024 | 350% |
| May 29, 2023 | Sep 15, 2023 | 300% |
| May 30, 2022 | Sep 15, 2022 | 100% |
| Jun 29, 2021 | Sep 20, 2021 | 200% |
| Feb 15, 2021 | Feb 24, 2021 | 150% |
No Data Available
No Data Available
No Data Available
| Announced on | Meeting on |
| Sep 05, 2024 | Sep 26, 2024 |
| A.G.M. | |
| Sep 06, 2023 | Sep 26, 2023 |
| A.G.M. | |
| Jun 16, 2022 | Jul 21, 2022 |
| - | |
| Sep 08, 2020 | Sep 30, 2020 |
| Book closure from Sep 24, 2020 to Sep 30, 2020 | |
| Sep 04, 2019 | - |
| Book closure from Sep 23, 2019 to Sep 28, 2019 | |
Techno Electric & Engineering Company Ltd., incorporated in the year 2005, is a Mid Cap company (having a market cap of Rs 10,536.74 Crore) operating in Engineering sector.
Industry
Key Indices Listed On
Nifty 500, BSE 500, BSE 250 SmallCap Index, BSE SmallCap, BSE Industrials
Address
C-218, Ground Floor (GR-2),Sector-63,Noida, Uttar Pradesh - 201307
P P Gupta
Managing DirectorAnkit Saraiya
Whole Time DirectorAvantika Gupta
Non Executive DirectorJames Raymond Trout
Non Executive DirectorDATA SOURCES: TickerPlant (for live BSE/NSE quotes service) and Dion Global Solutions Ltd. (for corporate data, historical price & volume, F&O data). Sensex & BSE Quotes and Nifty & NSE Quotes are real-time and licensed from BSE and NSE respectively. All timestamps are reflected in IST (Indian Standard Time).
DISCLAIMER: Any and all content on this website including tools/analysis is provided to you only for convenience and on an “as-is, as- available” basis without representation and warranties of any kind. The content and any output of such tools/analysis is for informational purposes only and should not be relied upon or construed as an investment advice or guarantee for any specific performance/returns advice or considered as recommendation for the purchase or sale of any security or investment. You are advised to exercise caution, discretion and independent judgment with regards to the same and seek advice from professionals and certified experts before taking any decisions.
By using this site, you agree to the Terms of Service and Privacy Policy.