WHAT ARE NEW RELIC DASHBOARDS?
A complete picture of your data that fits your exact needs.
Visualize anything. Connect everything.
- Stream and track events and their sources from across your stack.
- Add data from third parties like Prometheus, Dropwizard, Zipkin, OpenTelemetry, Fluentd, and more.
- Create custom attributes and event types to screen for issues in context with your business.
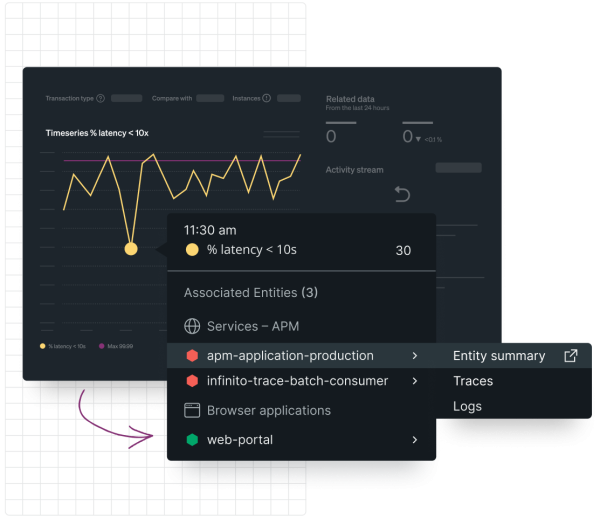
- Understand your data better with connected entities, traces, and logs.


Explore your data at a glance.
- Quickly slice and dice relevant data into one view with the world’s most powerful telemetry database.
- Analyze more than 50 billion events with a lightning-fast median response time of 60 ms per query.
- Instantly get the data you need by simply plugging a value into a template variable in your dashboard widget query.
Go from complex searches to easy answers.
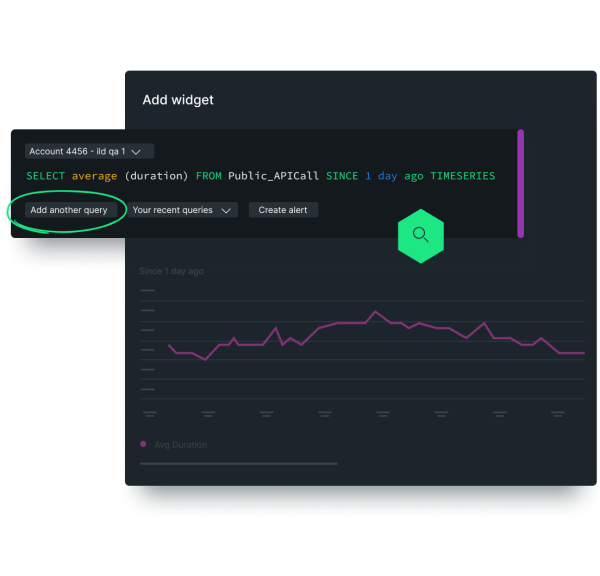
- Explore, filter, and add searches in a click with New Relic Query Language (NRQL) or data explorer.
- View data in context with easy-to-use tools, including brush and zoom, chart scrubber, and more.
- Instantly recognize which values are important to filter with the variables filter bar and template variables.

Take more control and increase efficiency.
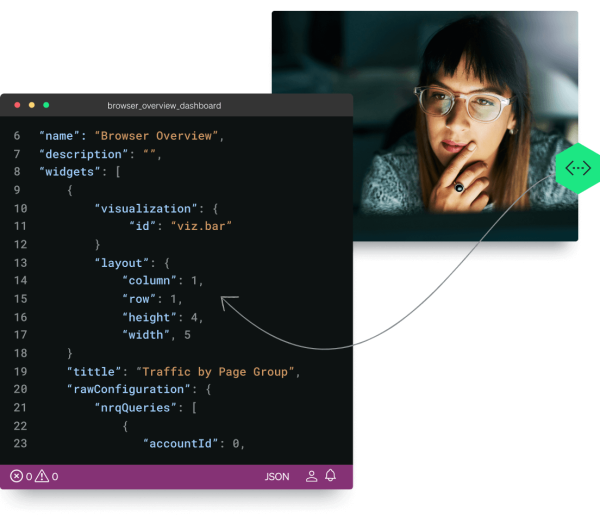
- Take advantage of automation with dashboards as code with the New Relic provider for Terraform.
- Easily create, configure, and export dashboards with the NerdGraph API.
- Create dashboard templates using template variables that pull from a query-generated list of values.
Collaborate on data insights right in the dashboard.
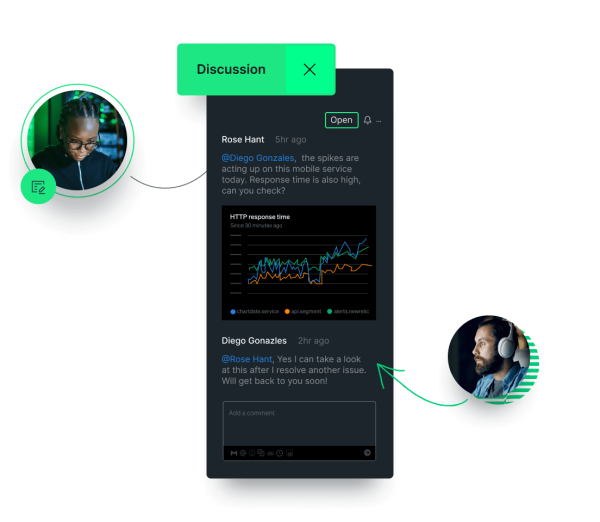
- Chat directly in the dashboard UI, and share beyond New Relic users with our Slack integration.
- Easily export your dashboards as a JSON or PDF file to keep your entire team in the loop.
- Invite others to your dashboards with a click by copying and sharing a permalink.

Ready to start using dashboards quickly?
Choose from hundreds of preconfigured dashboards from our library of instant integrations for cloud services, tools, and open standards.
Look who
has us open.
has us open.
1
2
3


