Page MenuHomePhabricator

Memory consumption on Wikipedia pages running in background tabs grows as other pages are opened
Open, MediumPublic

Assigned To
None
Authored By
Whatamidoing-WMF
Sep 21 2018, 5:59 PM
Referenced Files
F37140435: image.png
Jul 16 2023, 8:03 AM
F37140432: image.png
Jul 16 2023, 8:03 AM
F26624091: image.png
Oct 18 2018, 7:28 PM
F26609818: Screenshot from 2018-10-15 07-56-58.png
Oct 15 2018, 3:02 PM
F26609825: Screenshot from 2018-10-15 08-48-11.png
Oct 15 2018, 3:02 PM
F26609820: Screenshot from 2018-10-15 08-47-49.png
Oct 15 2018, 3:02 PM
F26192391: capture.png
Sep 25 2018, 12:30 AM

Description

@JFG reports that he's experiencing a memory leak in Chrome (WebKit?) whenever a Wikipedia page (but only a Wikipedia page) is left open and idle in another tab for a few hours. The process accumulates memory (up to gigabytes) but uses very little CPU while in the background. Clicking on the tab reduces the allocated memory to a more reasonable amount.

JFG noticed this problem shortly after the New Page Patroller user right, which allows access to page curation tool, was added to his account.

He has already tried:

  • removing all user scripts
  • disabling gadgets in Preferences
  • opening pages in ?safemode=1
  • disabling all browser extensions

"An article page that has been loaded, minimized, left untouched, and shares its process with no other page, grows to over a gigabyte of memory usage over a couple hours."

He has a snapshot of memory use in debug mode available.

Developer notes

See T205127#4613124 and T205127#4613193 for a recently written summary. What I know is that users of several different communities have reported through various channels over the past 2-3 months about memory leaks, after several years of having virtually heard nothing about the subject. They could be unrelated reports, but so far they had in common:

  • Wikipedia (English and German).
  • Multiple browsers (Chrome, Opera, possibly others).
  • Desktop (any skin).
  • Logged-in.

This task in particular shows:

  • There may be multiple sources of memory leaks. As such, let's focus this task only on the issue reported by @JFG.
  • The report from @JFG via @Whatamidoing-WMF includes various bits of information as well as a Chrome trace log.
  • This trace log shows direct correlation on an otherwise idle page that every mouse event that triggered significant code in Popups, also had a subsequent increase in memory use without a decrease in memory at any point. Specific function names, context and reproduction steps are found in T205127#4613193.

While there maybe other leaks in other places, I suggest to create separate tasks about each finding so that we can triage, understand and resolve each one individually.
Event Timeline

There are a very large number of changes, so older changes are hidden. Show Older Changes

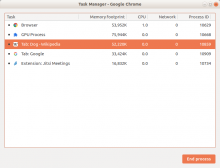
Task manager observations for my own consideration later.

When I only leave a background Wikipedia tab open, the size does not increase much:

Screenshot from 2018-10-15 07-56-58.png (596×776 px, 35 KB)

Screenshot from 2018-10-15 08-47-49.png (596×776 px, 37 KB)

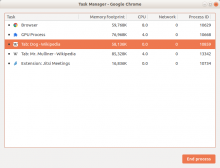
When I actively browse other Wikipedia pages in the foreground tab, the background tab's size grows quickly:

Screenshot from 2018-10-15 08-48-11.png (596×776 px, 36 KB)

The leak occurs whether the page previews UI is enabled or disabled.

The above occurs on mobile which does not have Popups.

@Krinkle I'm having a lot of difficulty getting up to speed with what the exact problem is here. Can you please update the description with a summary of what is known and what is not known?

Do we know exactly where the memory leak in Popups is, or do we only know that it relates to Popups? Is there more to investigate here?

See T205127#4613124 and T205127#4613193 for a recently written summary. What I know is that users of several different communities have reported through various channels over the past 2-3 months about memory leaks, after several years of having virtually heard nothing about the subject. They could be unrelated reports, but so far they had in common:

  • Wikipedia (English and German).
  • Multiple browsers (Chrome, Opera, possibly others).
  • Desktop (any skin).
  • Logged-in.

This task in particular shows:

  • There may be multiple sources of memory leaks. As such, let's focus this task only on the issue reported by @JFG.
  • The report from @JFG via @Whatamidoing-WMF includes various bits of information as well as a Chrome trace log.
  • This trace log shows direct correlation on an otherwise idle page that every mouse event that triggered significant code in Popups, also had a subsequent increase in memory use without a decrease in memory at any point. Specific function names, context and reproduction steps are found in T205127#4613193.

While there maybe other leaks in other places, I suggest to create separate tasks about each finding so that we can triage, understand and resolve each one individually.
Thanks for the new summary. I'll add that we have eliminated a bunch of other possible causes, by removing browser extensions, user scripts and gadgets. I started noticing those leaks in early September, as they became monumental (idle pages consuming more than 1 GB of memory before I kill them manually). I thought they might be related to the "new page reviewer" user right that I had recently acquired, but I have since opted out of this right and the problem persists.

I see the same behavior that was noted by @Niedzielski above: background pages in separate processes gobble up memory when I'm active on foreground pages. Also, bringing back a background page to the foreground and editing it clears up the memory outgrowth instantly. However, I have only noticed the issue on the English Wikipedia: German, French, Russian, Japanese versions and Wikidata do not seem to leak in my case. I have not yet tried actively working on foreground pages of those wikis while an idle one is in the background. Will test that asap.

I am doubtful that the popups issue explains the largest leaks, but of course we have identified a leak there, that should be investigated. I'm happy to run any tests required to help isolate the issue further.

Correction, and maybe an important clue: when a page in the background has been leaking memory, merely bringing it to the foreground and scrolling around in it is sufficient to reduce the memory footprint back to normal. No need to edit the page, just view it. With more careful experimenting, it appears that the memory is released as soon as a link mouseover event is processed and a thumbnail preview displayed. When I just open the relevant tab and carefully scroll from the sides without mousing over any text, the memory usage remains high. This behavior apparently establishes a strong connection between the popups system and the memory leak, and it's easy to reproduce. I tried to take a sample execution trace from the console to capture the release of memory, but that did not work because the leaked memory also gets released as soon as I open the dev tools panel. Hope this helps. Let me know what I can attempt next.

With more careful experimenting, it appears that the memory is released as soon as a link mouseover event is processed and a thumbnail preview displayed. When I just open the relevant tab and carefully scroll from the sides without mousing over any text, the memory usage remains high.

Well spotted @JFG! I see the same thing on Firefox Nightly 64.

I just tested the working-in-foreground-while-idle-page-in-background case on the German Wikipedia. Confirmed that:

  1. the background page does not leak as long as it's the only open page on dewiki, it can be stable for hours
  2. even a small amount of work on another dewiki page (open article, click edit, click preview) triggers 30-40 MB of leak in the background page
  3. bringing the background page back to the foreground by itself causes no change, scrolling carefully is also fine
  4. triggering a popup with a mouseover on any link resets the memory usage to its baseline value from step 1

Please disregard my previous comments on the phenomenon being limited to enwiki: that was because I had not tested background pages on other wikis while working on foreground pages of the same wiki.

Another test whereby the leak is easily triggered with minimal steps:

  1. open a first page, read it, scroll around, let it come to a stable memory footprint (as monitored in the Chrome task manager)
  2. open another page in a different tab, make sure it has a different process ID, just let it render without moving the mouse into it
  3. watch the memory footprint of both pages and do a single mouseover on a link within the foreground page
  4. the background page consumes a few extra megabytes of memory!
  5. keep reading the foreground page; very soon the background page consumes more memory than the foreground page…

New test: the leak-in-background-page phenomenon also occurs when logged out.

The leak occurs whether the page previews UI is enabled or disabled.

I can confirm this as well.

@JFG To confirm - The leak remains when bringing focus to the background window and making it the foreground window and scrolling. It stops when you mouse over a link, even when the mousing over doesn't do anything (when previews is disabled).

This would lead me to one of three possible causes:

  1. There is a leak in the Chrome browser outside our control where somehow a native thread is building up memory for unknown reasons an releasing it on the first I/O event received over a hyperlink.
  2. There is a leak in the Page Previews code, either the one we previously identified or a second one, in generic Popups code that fires even when the feature is disabled. We could eliminate this if we can confirm that none of its code is loaded when the feature is disabled, and that @JFG disabled it via Special:Preferences, cleared the browser cache (only cache, no need to clear cookies), and reproduce the issue on a page view.
  3. There is a leak in some other JavaScript code shipped by MediaWiki core, an extension, or a default-enabled gadget on en.wikipedia.org that somehow relates to mouse events.

@Krinkle: I tried the process you describe on the German Wikipedia, to avoid being polluted by my daily work on the English site. Here's what I have done:

  • disabled page preview in preferences
  • fully purged the browser cache
  • loaded a dewiki article in a new tab, making sure it had its own process ID (background page)
  • opened another dewiki article in another tab, making sure it had a separate process ID (foreground page)
  • browsed around in the foreground page, while checking memory usage on both pages
  • noticed memory usage of the background page increasing when left untouched, while browsing in the foreground page
  • saw an 8MB leap of memory usage on the background page when I hovered over a link in the foreground page. The link hovering just displayed a tooltip with the name of the target article, "Wirtschaftswunder".
  • saw a 12 MB leap on the background page when I opened another article in the foreground page, while it was being rendered
  • every new page rendered in the foreground process triggered a 7-8 MB memory increase in the background page's process
  • noticed some tiny amount of CPU usage in the background process every time I hovered over a link in the foreground page (about 0.1% CPU visible during one or two frames of the 1-second refresh rate of the task manager). That usually did not trigger a memory increase.
  • noticed some more significant CPU usage in the background process every time the foreground process finishes loading and rendering a new page (typically 2.7–3.5% during one frame), happening in sync with the memory increase of 7-8 MB. This usually happens with a delay of a couple seconds after the new page is loaded.
  • opening a picture within an article of the foreground process also triggers a slightly-delayed 7-8 MB memory increase and 1-second 3% CPU usage in the background process
  • browsing through several images in the foreground page once in gallery mode does not change the memory allocation in the background process, even on articles with many pictures.
  • throughout all these actions, memory usage of the active foreground process goes up and down, and remains far under what happens to the background process.
  • during all the activities in the foreground process, I have not seen any network usage triggered in the background process
  • when switching to the background page, memory usage remains high, it can even increase. Scrolling does not change it.
  • hovering over links in the background page (now foreground) does not reduce the memory footprint (that differs from the case when popups were active -- the popup display was clearing the extra memory), and it does consume some CPU (5-6% during 2-3 seconds). Again, only the tooltip with target article name gets displayed.
  • after clicking a link to load another article, memory is purged and returns to a normal level.

Memory bugs are always ''interesting''…

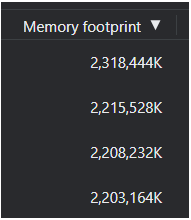
@JFG in Google Chrome, if you open the Task Manager, right click on the columns at the top and add "JavaScript Memory", do you see that value increasing or just memory footprint?

image.png (238×1 px, 134 KB)

I only see memory footprint increasing, not JavaScript memory, which indicates possibly detached DOM tree memory leaks. Unfortunately I didn't spot anything obvious from looking at heap snapshots.

@kostajh: The JavaScript memory is stable in the background page.

@kostajh, @Krinkle: bumping thread.

Any idea where to send this report now that triggering conditions are narrowed down, and it's been well reproduced? A gigabytes-sized memory leak is a rather annoying state of affairs for one of the world's top sites. It especially harms active editors, and we need more of them to maintain quality and coverage. Hope you can identify who would be the best people to address this.

That would be my team. I need to dig through this thread and understand the problem fully. We are coming up to a big release so i haven't found the time yet.

Thank you for all the input and investigation.

I'm at an offsite starting today and will bring it up.

See T205127#4613124 and T205127#4613193 for a recently written summary. What I know is that users of several different communities have reported through various channels over the past 2-3 months about memory leaks, after several years of having virtually heard nothing about the subject. They could be unrelated reports, but so far they had in common:

For the record, here's the link to one of the reports @Krinkle referred to:
https://de.wikipedia.org/wiki/Wikipedia:Fragen_zur_Wikipedia/Archiv/2018/Woche_37#WP_als_Speicherfresser (Opera 55.0.2994.56 under Ubuntu 16.04)

I also seem to recall encountering such an issue myself repeatedly in the last 2 months or so, with a single tab growing toward 2GB, in Chromium under Ubuntu, logged in on desktop.

First things first we'll get one of the devs who know's the popups code to understand what's going on here in a more isolated environment... T208634

Sure. But please note the issue may not be related to popups.

@JFG for now, I tried to isolate issues that only refer to Popups - I'm trying to learn how to properly use the memory profiling tools. I'll keep hunting for memory leaks in whole WMF code.

@pmiazga: Your work on phab:T208634 looks promising. Let me know whenever there's a potential fix to test.

Jdlrobson renamed this task from Memory leak from Popups on Wikipedia pages to Memory leak on Wikipedia pages (including Popups).Dec 13 2018, 10:36 PM

Still digging. We are in new territory debugging this memory leak. I must confess i got a but distracted but this will now be my main focus this week but doesn't look like Object.assign is the cause :/

FWIW like @Niedzielski in T205127#4666928 I've so far been unable to replicate the memory leak when I leave a page on enwiki open in a background tab. I don't know if this bit is OS specific (e.g. #1 in T205127#4674456). I am seeing what looks like minor leaks in Popups but I don't think any fixes there are going to have much of an impact on. @JFG can you confirm you are still seeing this problem to the scale as before?

I can see a memory leak between snapshots after some hovering, but it's not obvious why - the memory relates to ajax calls and the reducers. Dropping the preview reducer seems to help a little.

@JFG I have a feeling you have the Content Translation beta feature and/or the Book creator tool enabled. Can you disable those if you have either enabled and re-run your memory leak experiment to see if you still see the large leak?

@Jdlrobson: I still see massive leaking into gigabytes for idle background pages while I edit heavily on foreground pages.

I have disabled the content translation beta feature and will report on any impact. This feature was already disabled in my settings for the German wiki, and that one exhibited the same background-page leak behavior as the English wiki. I have never used the book creator tool.

Confirmed: still leaking without Content Translation.

Thanks @JFG for checking that.

@Krinkle I'll reach out to you in early January to setup a meeting to work out next steps. Let me know if anyone else in performance should be invited.
I've got absolutely no leads on what's happening here but we can share with you what we've done and get pointers on how to get to the bottom of this.

@Jdlrobson, I can reproduce my earlier findings on Ubuntu Chromium v71.0.3578.98:

  1. Open an incognito window.
  2. Visit https://en.m.wikipedia.org/wiki/Barack_Obama.
  3. Open the task manager and order by descending memory usage; the Obama page starts at 63 MB for me.
  4. Middle-click Honolulu 30 times.
  5. The memory usage is now 85 MB for the Obama page and the Honolulu pages are each between 46 and 63 MB.
  6. Visit the second from the left Honolulu tab and close each of the 30 tabs.
  7. The memory usage is now 90 MB for the Obama page, about 27 MB greater than when it was opened.

I did not manually force a garbage collection, had developer tools closed, and no extensions enabled in incognito. However, I'm sure the test conditions could be more tightly controlled.

I tried a similar test on store.google.com which initially appears at 54 MB. 30 "connected home" tabs between 62 and 69 MB cause the store page to jump to 65 MB. The store tab is at 66 MB after closing the 30 "connected home" tabs.

I had a chat with @Krinkle about this on IRC this morning, and the signs point to a generic problem with Chrome rather than a problem in our code. There also might not be anything inherently wrong with this memory consumption... it could be a Chrome specific optimisation.

I will open a Chromium bug and point to this ticket and https://bugs.chromium.org/p/chromium/issues/detail?id=463348 sometime this week.

Jdlrobson renamed this task from Memory leak on Wikipedia pages (including Popups) to Memory consumption on Wikipedia pages running in background tabs grows as other pages are opened.Feb 14 2019, 1:35 AM

Hello. Just a regular, non-developer Wikipedian here. I found this using a google search. I was surprised to see this as an open issue since 2018. I'm experiencing the drastic memory leaks as described above, causing my 16GB desktop to reach 95% memory usage, grinding the system to a near-halt due to thrashing (it doesn't help this PC doesn't have an SSD). I figured out on my own that only Wikipedia tabs had the memory leak, causing me to come here, and I learned a lot about workarounds to keep my system stable. For that I'm grateful. I noticed that the emphasis recently is to blame Chrome for the problem, but earlier in the discussions it was mentioned that it could be reproduced on Firefox, and Opera. I'm using Chrome Version 92.0.4515.159 (Official Build) (64-bit). I don't use other browsers at the moment. Does anyone know if this happens when using Edge?

With more careful experimenting, it appears that the memory is released as soon as a link mouseover event is processed and a thumbnail preview displayed. When I just open the relevant tab and carefully scroll from the sides without mousing over any text, the memory usage remains high.

Well spotted @JFG! I see the same thing on Firefox Nightly 64.

@Jdlrobson I see that you aren't the assignee anymore. Is anyone else here working on the drastic memory leak issue? The last activity on the Chromium ticket below was August 2019. There must be a lot of Wikipedia editors out there pulling their hair out when their system grinds to a near-halt due to thrashing and they have no idea why. If it happens to me with 16GB think how bad it is for people with less. I figured it out the culprit was background Wikipedia tabs, after trial and error, but I'm a retired software developer who knew just enough to try to narrow down the problem. This should be a higher than Medium-level priority.

@Craig_Cholar, would you be willing to run an experiment for me? "NAVPOPS" overrides Page Preview. Would you go to https://en.wikipedia.org/wiki/Special:Preferences#mw-prefsection-gadgets and turn on the item (#6) that says "Navigation popups: article previews and editing functions pop up when hovering over links", and see if this makes the memory leak go away? (Doing this will only affect the English Wikipedia, so you'll have to test it there.)

Thanks for the reply!  I already have that #6 option for "Navigation popups" turned on.  I've had that enabled for a long time.  

Hello. Just a regular, non-developer Wikipedian here.

Welcome :)

[…] I noticed that the emphasis recently is to blame Chrome for the problem, but earlier in the discussions it was mentioned that it could be reproduced on Firefox, and Opera. […] Does anyone know if this happens when using Edge?

The Opera and Edge browsers are nowadays rebranded distributions of Chromium. As such, this is unfortunately not extra information for developers in terms of whether it is specific to one browser or not.

If I remember correctly, the reason we believe there is nothing we can do here is that 1) when a Wikipedia page first loads on its own the memory use seems fine and does not increase on its own, 2) the memory consumed by our light JavaScript enhancements is low and stable, 3) the increases happen at times where "we" don't do anything, 4) the reductions happen at times where "we" don't do anything either. The increases happen when hovering a native HTML link or scrolling, with no unusual CSS or HTML features in use. To my knowledge, such activity could only increase memory usage from our end if we did so with JavaScript. We have ruled that out both by disabling it as well as by empirically measuring the JS memory heap and confirming that it remains stable. The memory is allocated within the browser for reasons we don't control, and also released again by the browser outside our control (when bringing it back to the foreground). As such, it seems very likely that the cause here is somewhere within Chromium.

I would think differently if the memory use was already going high from the start when the content is first displayed, or if the JavaScript memory size was increasing along with the overall process memory, or if the bug happened as part of interacting with one of our own buttons or widgets.

The mention of Firefox is interesting. However, I've not been able to reproduce the issue there. I believe Firefox was only mentioned once by one person across the various ways in which people report such issues, and that was here earlier in this thread. I don't see any indication at this time that this is reproducible or related to the same issue, or indeed related to Wikipedia. There has been no further indication of this, and no-one else has been able to reproduce the issue in Firefox (afaik).

One other thing I'd like to mention is that browsers are quite adaptive in their behaviour based on available device memory. If throughout a web page's lifecycle, the browser process ends up holding a certain amount of memory, that does not mean by definition that it is the amount of memory required for that web page. Loading the same page again when there is less memory available, can result in the same page working fine whilst using less memory. Merely observing an ever larger proportion of otherwise idle memory being consumed is not itself indicative of a problem per-se. Browsers may hold on to data that is internally optional or already discarded in order to postpone expensive computations. Of course, if other processes suffer, or if the browser is not yielding back this "excess" when needed, or if the browser crashes when loading the same page when there is less memory available from the start, then it probably is a genuine problem in required memory consumption or memory leak (either in our code, or in the browser).

Experienced the same (https://en.wikipedia.org/wiki/Wikipedia:Village_pump_(technical)#Memory_leaks). Browser is Edge Dev (112.0.1722.31) on macOS 13.2.1. I've found a 100% reproducible test case, which also works when I'm logged out of Wikipedia, and have all browser extensions disabled.

Steps to reproduce:

  1. In tab 1, open https://en.wikipedia.org/wiki/Main_Page
  2. Switch to another tab, and wait until tab 1 gets suspended by Edge (enable "Maximum Savings" efficiency mode in settings, then wait 5 minutes for tab 1's favicon to turn transparent)
  3. Open a new tab ("tab 2"), and go to Wikipedia's homepage in that tab
  4. Open the Edge task manager. Every time you click on a new wikilink in tab 2, tab 1's memory use will increase by 14MB.

Caveats:

  • Tab 1 must be suspended. If it isn't, its memory use will only grow by 3MB, not 14MB, and will drop back to normal at regular intervals (every few minutes). If suspended, tab 1's memory use never drops.
  • Tab 1's memory use takes several several seconds to increase after you load a new Wikipedia article in tab 2. If you click 5 links in rapid succession in tab 2, tab 1's memory use will only increase once by 14MB, not by 5*14MB. So to reproduce this, you must wait for tab 1's memory use to increase, before you click on a wikilink in tab 2.

Add: it seems Wikimedia Commons is also affected. One Commons tab I opened earlier today is now taking 2.7GB.

Update 11 April: I tried it again today, after 2 Edge Dev updates, and can no longer reproduce it. Before posting on 5 April, I tried it four separate times, logged in and logged out, with extensions and without, and it was perfectly reproducible each time; but now it's not, so I'm assuming this was a bug in Edge Dev rather than in Wikipedia (or maybe an interaction between bugs in both).

Update #2, 11 April: despite the fact that my reproduction steps no longer work, the problem definitely still exists. Tabs I opened a few hours ago are now taking 4GB each (Edge Dev 113.0.1774.7).

Update #3, 6 May 2023: did something get changed sometime this week? Issue has disappeared abruptly in the past few days. Tabs use 100MB despite having been open for days. Huge relief.

Update #3, 6 May 2023: did something get changed sometime this week? Issue has disappeared abruptly in the past few days. Tabs use 100MB despite having been open for days. Huge relief.

Doesn't look like it. I've had this issue for years now, though I don't get to experience it very often as my on-wiki activity has reduced a lot in the recent period. However, today I was working on some templates on itwiki. I had probably around 10 itwiki tabs open. In particular, since I was making edits to templates, I was constantly previewing my changes, both for the current page and for other pages ("Preview page with this template"), while also inspecting the resulting HTML. After roughly 1 hour of this, the memory usage some of the tabs was reportedly around 3GB each. Based on the previous conversation it looks like this might be an issue in chromium, but if there's something I could do to try and hopefully pinpoint the issue, please tell me.

Anyone else getting terrible memory leaks in Google Chrome starting in the last few days? I've had Wikipedia tabs getting to be gigabytes, with the worst offenders getting to 13GB.

Windows 10, Google Chrome 114.0.5735.199 (64-bit)

image.png (321×108 px, 9 KB)

image.png (216×188 px, 3 KB)

@Novem_Linguae I experienced it again, at the same time you posted it. Tried isolating the root cause, but didn't have the time to do it thoroughly. All I found was that the issue disappeared when I used the Visual Editor as my default (instead of wikitext 2010). I assume the memory leak is either in wikitext2010 itself, or in its live preview feature, or in one of the scripts in my common.js that customize the wikitext 2010 editor and aren't compatible with the Visual Editor. Hope this helps you narrow it down.

My memory leak problems went away after 2 or 3 days. I assume Chrome released a patch and that got installed when I restarted my browser or something.

I assume the memory leak is either in wikitext2010 itself, or in its live preview feature, or in one of the scripts in my common.js that customize the wikitext 2010 editor and aren't compatible with the Visual Editor.

To blame Wikipedia code for memory leaks seems incorrect to me. To handle pages that are way too large for whatever reason, a properly functioning browser should run garbage collection on that tab, or crash the tab. I'd speculate that memory leaks are 100% the fault of the browser's code.