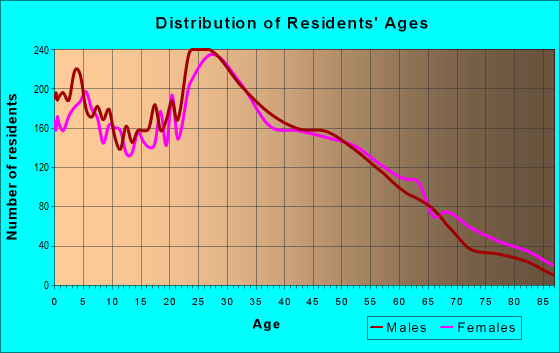
Estimated zip code population in 2023: 25,370 Zip code population in 2010: 23,397 Zip code population in 2000: 23,435
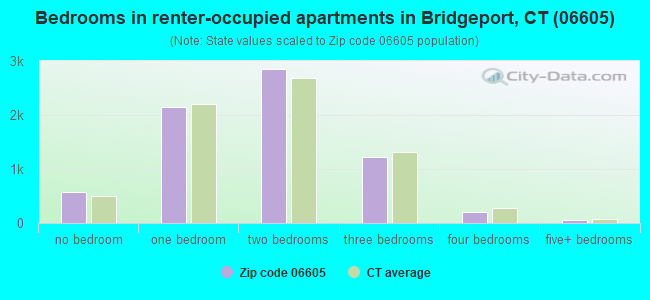
Houses and condos: 10,869 Renter-occupied apartments: 7,218
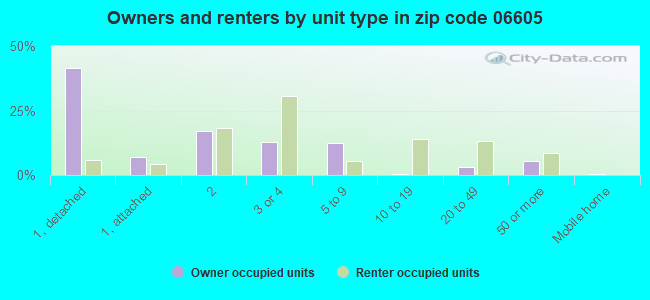
% of renters here:
70%
State:
34%
March 2022 cost of living index in zip code 06605: 129.4 (high, U.S. average is 100)
Land area: 2.3 sq. mi. Water area: 0.4 sq. mi.
Population density: 10,828 people per square mile
(high).
OSM Map
Google Map
MSN Map
OSM Map
General Map
Google Map
MSN Map
OSM Map
Google Map
MSN Map
OSM Map
Google Map
MSN Map
Please wait while loading the map...
Real estate property taxes paid for housing units in 2023:
This zip code:
2.4% ($6,898)
Connecticut:
1.7% ($6,388)
Median real estate property taxes paid for housing units with mortgages in 2023: $7,256 (2.3%) Median real estate property taxes paid for housing units with no mortgage in 2023: $5,526 (2.3%)
Averages for the 2020 tax year for zip code 06605, filed in 2021:
Average Adjusted Gross Income (AGI) in 2020: $45,830 (Individual Income Tax Returns)
Here:
$45,830
State:
$105,931
Salary/wage: $42,147 (reported on 85.0% of returns)
Here:
$42,147
State:
$83,540
(% of AGI for various income ranges: 1234.1% for AGIs below $25k, 3529.1% for AGIs $25k-50k, 6957.6% for AGIs $50k-75k, 10335.6% for AGIs $75k-100k, 20795.0% for AGIs $100k-200k, 112260.0% for AGIs over 200k)
Taxable interest for individuals: $975 (reported on 12.5% of returns)
This zip code:
$975
Connecticut:
$3,402
(% of AGI for various income ranges: 3.6% for AGIs below $25k, 5.0% for AGIs $25k-50k, 11.7% for AGIs $50k-75k, 40.7% for AGIs $75k-100k, 55.7% for AGIs $100k-200k, 980.0% for AGIs over 200k)
Ordinary dividends: $4,617 (reported on 8.6% of returns)
Here:
$4,617
State:
$12,683
(% of AGI for various income ranges: 8.9% for AGIs below $25k, 11.3% for AGIs $25k-50k, 39.3% for AGIs $50k-75k, 92.6% for AGIs $75k-100k, 324.3% for AGIs $100k-200k, 3160.0% for AGIs over 200k)
Net capital gain/loss in AGI: +$9,813 (reported on 8.2% of returns)
Here:
+$9,813
State:
+$44,158
(% of AGI for various income ranges: 4.8% for AGIs below $25k, 18.3% for AGIs $25k-50k, 28.1% for AGIs $50k-75k, 88.1% for AGIs $75k-100k, 636.0% for AGIs $100k-200k, 9118.3% for AGIs over 200k)
Profit/loss from business: +$9,900 (reported on 18.6% of returns)
Here:
+$9,900
State:
+$22,988
(% of AGI for various income ranges: 172.3% for AGIs below $25k, 143.1% for AGIs $25k-50k, 228.3% for AGIs $50k-75k, 263.3% for AGIs $75k-100k, 607.0% for AGIs $100k-200k, 7906.7% for AGIs over 200k)
Taxable individual retirement arrangement distribution: $16,475 (reported on 3.0% of returns)
06605:
$16,475
Connecticut:
$22,031
(% of AGI for various income ranges: 12.9% for AGIs below $25k, 20.7% for AGIs $25k-50k, 84.7% for AGIs $50k-75k, 97.7% for AGIs $75k-100k, 418.7% for AGIs $100k-200k, 2841.7% for AGIs over 200k)
Self-employed (Keogh) retirement plans: $21,175 (reported on 0.4% of returns)
06605:
$21,175
Connecticut:
$29,016
(% of AGI for various income ranges: 1411.7% for AGIs over 200k)
Total itemized deductions: $26,927 (reported on 5.2% of returns)
Here:
$26,927
State:
$37,613
(% of AGI for various income ranges: 25.1% for AGIs below $25k, 65.9% for AGIs $25k-50k, 210.6% for AGIs $50k-75k, 491.4% for AGIs $75k-100k, 1190.3% for AGIs $100k-200k, 7525.0% for AGIs over 200k)
Charity contributions: $7,188 (reported on 4.0% of returns)
Here:
$7,188
State:
$13,557
(% of AGI for various income ranges: 2.5% for AGIs below $25k, 8.8% for AGIs $25k-50k, 32.2% for AGIs $50k-75k, 54.7% for AGIs $75k-100k, 163.7% for AGIs $100k-200k, 2836.7% for AGIs over 200k)
Taxes paid: $8,639 (reported on 5.2% of returns)
06605:
$8,639
State:
$9,096
(% of AGI for various income ranges: 6.2% for AGIs below $25k, 23.2% for AGIs $25k-50k, 81.7% for AGIs $50k-75k, 215.3% for AGIs $75k-100k, 450.0% for AGIs $100k-200k, 1430.0% for AGIs over 200k)
Earned income credit: $2,354 (reported on 24.8% of returns)
Here:
$2,354
State:
$2,059
(% of AGI for various income ranges: 119.1% for AGIs below $25k, 78.8% for AGIs $25k-50k)
Percentage of individuals using paid preparers for their 2020 taxes: 92.3%
Here:
92%
State:
93%
(% for various income ranges: 89.8% for AGIs below $25k, 94.2% for AGIs $25k-50k, 94.1% for AGIs $50k-75k, 96.7% for AGIs $75k-100k, 93.2% for AGIs $100k-200k, 90.5% for AGIs over 200k)
Averages for the 2012 tax year for zip code 06605, filed in 2013:
Average Adjusted Gross Income (AGI) in 2012: $37,027 (Individual Income Tax Returns)
Here:
$37,027
State:
$93,290
Salary/wage: $34,208 (reported on 87.3% of returns)
Here:
$34,208
State:
$73,117
(% of AGI for various income ranges: 80.3% for AGIs below $25k, 89.3% for AGIs $25k-50k, 88.0% for AGIs $50k-75k, 83.8% for AGIs $75k-100k, 79.6% for AGIs $100k-200k, 52.3% for AGIs over 200k)
Taxable interest for individuals: $597 (reported on 19.3% of returns)
This zip code:
$597
Connecticut:
$2,530
(% of AGI for various income ranges: 0.3% for AGIs below $25k, 0.2% for AGIs $25k-50k, 0.3% for AGIs $50k-75k, 0.2% for AGIs $75k-100k, 0.3% for AGIs $100k-200k, 0.7% for AGIs over 200k)
Ordinary dividends: $4,379 (reported on 8.7% of returns)
Here:
$4,379
State:
$10,909
(% of AGI for various income ranges: 0.7% for AGIs below $25k, 0.3% for AGIs $25k-50k, 0.7% for AGIs $50k-75k, 0.9% for AGIs $75k-100k, 0.9% for AGIs $100k-200k, 3.6% for AGIs over 200k)
Net capital gain/loss in AGI: +$8,407 (reported on 5.9% of returns)
Here:
+$8,407
State:
+$34,090
(% of AGI for various income ranges: 0.3% for AGIs $50k-75k, 1.0% for AGIs $100k-200k, 8.7% for AGIs over 200k)
Profit/loss from business: +$10,727 (reported on 15.0% of returns)
Here:
+$10,727
State:
+$22,741
(% of AGI for various income ranges: 9.4% for AGIs below $25k, 3.1% for AGIs $25k-50k, 2.1% for AGIs $50k-75k, 3.8% for AGIs $75k-100k, 4.0% for AGIs $100k-200k, 3.7% for AGIs over 200k)
Taxable individual retirement arrangement distribution: $11,467 (reported on 4.3% of returns)
06605:
$11,467
Connecticut:
$19,976
(% of AGI for various income ranges: 0.8% for AGIs below $25k, 1.0% for AGIs $25k-50k, 1.1% for AGIs $50k-75k, 2.1% for AGIs $75k-100k, 3.5% for AGIs $100k-200k)
Self-employment retirement plans: $14,350 (reported on 0.4% of returns)
06605:
$14,350
Connecticut:
$24,004
Total itemized deductions: $22,897 (26% of AGI, reported on 19.5% of returns)
Here:
$22,897
State:
$33,239
Here:
26.4% of AGI
State:
18.9% of AGI
(% of AGI for various income ranges: 5.7% for AGIs below $25k, 8.5% for AGIs $25k-50k, 12.7% for AGIs $50k-75k, 15.2% for AGIs $75k-100k, 18.5% for AGIs $100k-200k, 17.4% for AGIs over 200k)
Charity contributions: $2,863 (reported on 14.9% of returns)
Here:
$2,863
State:
$4,947
(% of AGI for various income ranges: 0.3% for AGIs below $25k, 0.8% for AGIs $25k-50k, 1.3% for AGIs $50k-75k, 1.5% for AGIs $75k-100k, 1.5% for AGIs $100k-200k, 2.1% for AGIs over 200k)
Taxes paid: $11,158 (reported on 19.3% of returns)
06605:
$11,158
State:
$17,397
(% of AGI for various income ranges: 2.0% for AGIs below $25k, 3.0% for AGIs $25k-50k, 5.5% for AGIs $50k-75k, 7.6% for AGIs $75k-100k, 10.0% for AGIs $100k-200k, 11.2% for AGIs over 200k)
Earned income credit: $2,436 (reported on 29.8% of returns)
Here:
$2,436
State:
$2,053
(% of AGI for various income ranges: 9.0% for AGIs below $25k, 1.3% for AGIs $25k-50k)
Percentage of individuals using paid preparers for their 2012 taxes: 58.7%
Here:
59%
State:
55%
(% for various income ranges: 57.5% for AGIs below $25k, 58.7% for AGIs $25k-50k, 58.8% for AGIs $50k-75k, 58.5% for AGIs $75k-100k, 65.9% for AGIs $100k-200k, 90.0% for AGIs over 200k)
Averages for the 2004 tax year for zip code 06605, filed in 2005:
Average Adjusted Gross Income (AGI) in 2004: $32,301 (Individual Income Tax Returns)
Here:
$32,301
State:
$73,265
Salary/wage: $30,597 (reported on 89.2% of returns)
Here:
$30,597
State:
$62,030
(% of AGI for various income ranges: 90.7% for AGIs below $10k, 88.8% for AGIs $10k-25k, 92.5% for AGIs $25k-50k, 89.6% for AGIs $50k-75k, 86.5% for AGIs $75k-100k, 63.9% for AGIs over 100k)
Taxable interest for individuals: $772 (reported on 27.4% of returns)
This zip code:
$772
Connecticut:
$2,287
(% of AGI for various income ranges: 1.3% for AGIs below $10k, 0.7% for AGIs $10k-25k, 0.6% for AGIs $25k-50k, 0.5% for AGIs $50k-75k, 0.4% for AGIs $75k-100k, 0.9% for AGIs over 100k)
Taxable dividends: $2,074 (reported on 10.7% of returns)
Here:
$2,074
State:
$5,735
(% of AGI for various income ranges: 1.3% for AGIs below $10k, 0.4% for AGIs $10k-25k, 0.3% for AGIs $25k-50k, 0.7% for AGIs $50k-75k, 0.8% for AGIs $75k-100k, 1.3% for AGIs over 100k)
Net capital gain/loss: +$12,448 (reported on 8.1% of returns)
Here:
+$12,448
State:
+$23,694
(% of AGI for various income ranges: -0.2% for AGIs below $10k, -0.0% for AGIs $10k-25k, 0.4% for AGIs $25k-50k, 0.8% for AGIs $50k-75k, 1.0% for AGIs $75k-100k, 12.8% for AGIs over 100k)
Profit/loss from business: +$10,342 (reported on 12.0% of returns)
Here:
+$10,342
State:
+$20,783
(% of AGI for various income ranges: 11.5% for AGIs below $10k, 5.6% for AGIs $10k-25k, 2.3% for AGIs $25k-50k, 2.4% for AGIs $50k-75k, 3.2% for AGIs $75k-100k, 4.9% for AGIs over 100k)
IRA payment deduction: $2,529 (reported on 1.5% of returns)
06605:
$2,529
Connecticut:
$3,216
(% of AGI for various income ranges: 0.2% for AGIs $10k-25k, 0.1% for AGIs $25k-50k, 0.2% for AGIs $50k-75k, 0.1% for AGIs over 100k)
Self-employed pension: $9,596 (reported on 0.5% of returns)
Here:
$9,596
Connecticut:
$17,335
(% of AGI for various income ranges: 0.1% for AGIs $10k-25k, 0.1% for AGIs $50k-75k, 0.6% for AGIs over 100k)
Total itemized deductions: $18,238 (26% of AGI, reported on 21.2% of returns)
Here:
$18,238
State:
$24,919
Here:
25.8% of AGI
State:
18.6% of AGI
(% of AGI for various income ranges: 7.7% for AGIs below $10k, 7.5% for AGIs $10k-25k, 9.1% for AGIs $25k-50k, 14.7% for AGIs $50k-75k, 17.3% for AGIs $75k-100k, 16.1% for AGIs over 100k)
Charity contributions deductions: $2,795 (4% of AGI, reported on 18.3% of returns)
Here:
$2,795
State:
$3,762
Here:
3.7% of AGI
State:
2.7% of AGI
(% of AGI for various income ranges: 0.4% for AGIs below $10k, 0.8% for AGIs $10k-25k, 1.2% for AGIs $25k-50k, 1.9% for AGIs $50k-75k, 2.3% for AGIs $75k-100k, 2.4% for AGIs over 100k)
Total tax: $5,044 (reported on 64.2% of returns)
06605:
$5,044
State:
$15,148
(% of AGI for various income ranges: 2.6% for AGIs below $10k, 3.6% for AGIs $10k-25k, 7.0% for AGIs $25k-50k, 10.2% for AGIs $50k-75k, 12.2% for AGIs $75k-100k, 19.5% for AGIs over 100k)
Earned income credit: $1,817 (reported on 28.7% of returns)
Here:
$1,817
State:
$1,570
Percentage of individuals using paid preparers for their 2004 taxes: 67.6%
Here:
68%
State:
59%
(% for various income ranges: 65.3% for AGIs below $10k, 73.6% for AGIs $10k-25k, 64.2% for AGIs $25k-50k, 62.8% for AGIs $50k-75k, 63.8% for AGIs $75k-100k, 72.3% for AGIs over 100k)
Likely homosexual households (counted as self-reported same-sex unmarried-partner households)
Lesbian couples: 0.2% of all households
Gay men: 0.1% of all households
Household received Food Stamps/SNAP in the past 12 months: 2,492 Household did not receive Food Stamps/SNAP in the past 12 months: 7,702
Women who had a birth in the past 12 months: 629 (474 now married, 135 unmarried) Women who did not have a birth in the past 12 months: 6,119 (1,551 now married, 4,588 unmarried)
Housing units in zip code 06605 with a mortgage: 1,845 (236 second mortgage, 174 both second mortgage and home equity loan) Houses without a mortgage: 8
Median monthly owner costs for units with a mortgage: $2,394 Median monthly owner costs for units without a mortgage: $944
Residents with income below the poverty level in 2023:
This zip code:
25.0%
Whole state:
10.3%
Residents with income below 50% of the poverty level in 2023:
This zip code:
13.0%
Whole state:
4.9%
Median number of rooms in houses and condos:
Here:
5.3
State:
6.5
Median number of rooms in apartments:
Here:
4.2
State:
4.0
Notable locations in this zip code not listed on our city pages
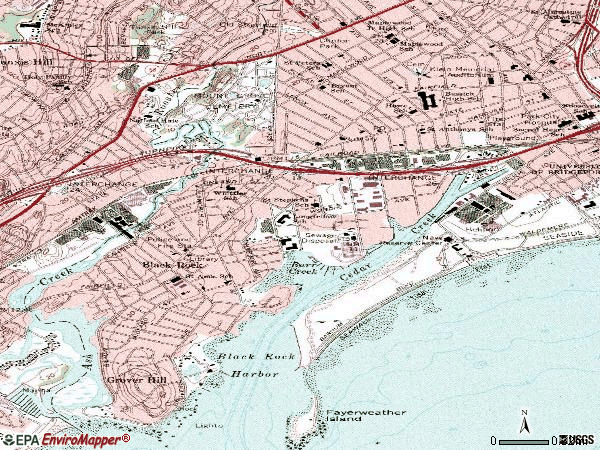
Notable locations in zip code 06605: Black Rock Yacht Club (A), Brooklawn Country Club (B), Captains Cove Seaport (C), Burr Creek Marina (D), Black Rock Branch Bridgeport Public Library (E), Bridgeport Fire Department Engine Company 3 and 4 (F), Bridgeport Fire Department Engine Company 7 and Ladder 11 (G). Display/hide their locations on the map
Churches in zip code 06605 include: Bethel Memorial Deliverance Church (A), Bridgeport Islamic Society (B), Centro Christiano Church (C), Church of God (D), Church of God New Life (E), Church of the Lord Jesus (F), Church of the Nazarene (G), Daughters of the Holy Spirit Church (H), First Assembly of God Church (I). Display/hide their locations on the map
Parks in zip code 06605 include: West Side Park (1), Tunxis Hill Park (2), Clinton Park (3), Bassickville Historic District (4), Black Rock Gardens Historic District (5), Black Rock Historic District (6), Longfellow Park (7), Went Field (8). Display/hide their locations on the map
2,567 married couples with children.
2,349 single-parent households (571 men, 1,778 women).
53.2% of residents of 06605 zip code speak English at home.
33.0% of residents speak Spanish at home (52% very well, 15% well, 27% not well, 6% not at all).
9.8% of residents speak other Indo-European language at home (69% very well, 14% well, 13% not well, 4% not at all).
1.9% of residents speak Asian or Pacific Island language at home (41% very well, 34% well, 20% not well, 5% not at all).
2.8% of residents speak other language at home (75% very well, 25% well).
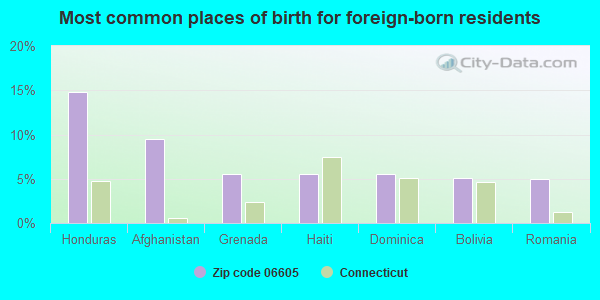
Foreign born population: 6,589 (26.0%) (50.6% of them are naturalized citizens)
Major facilities with environmental interests located in this zip code:
CASCO PRODUCTS CORPORATION (512 HANCOCK AVENUE in BRIDGEPORT, CT)
AIR MINOR (AIRS/AFS) (Integrated Compliance Information System) - ICIS-01-1995-0041, FORMAL ENFORCEMENT ACTION COMPLIANCE ACTIVITY (Tracking inspections of insecticide, fungicide, and rodenticide, and toxic substances) (Resource Conservation and Recovery Act (tracking hazardous waste)) TRI REPORTER (Tracking of toxic chemicals releasing facilities) Business SIC classification: MOTOR VEHICLE PARTS AND ACCESSORIES Business NAICS classification: ALL OTHER MOTOR VEHICLE PARTS MANUFACTURING.; ALL OTHER MISCELLANEOUS MANUFACTURING. Organizations: SUN CHEMICAL CORP (CONTACT/OWNER)
BASSICK HIGH SCHOOL (1181 FAIRFIELD AVENUE in BRIDGEPORT, CT)
AIR MINOR (AIRS/AFS) AIR MONITORING SITE (Airborne pollution emission tracking) (Geographic Names Information System) (National Center for Education Statistics) - STATE ID-61 Business SIC classification: ELEMENTARY AND SECONDARY SCHOOLS Organizations: BRIDGEPORT SCHOOL DISTRICT (SCHOOL DISTRICT)
BRIDGEPORT METAL GOODS MANUFACTURING COMPANY (365 CHERRY STREET in BRIDGEPORT, CT)
AIR MINOR (AIRS/AFS) COMPLIANCE ACTIVITY (Tracking inspections of insecticide, fungicide, and rodenticide, and toxic substances) CRITERIA AND HAZARDOUS AIR POLLUTANT INVENTORY (Inventory of air pollution sources) AIR MAJOR ("Best Available" air pollution technologies tracking) HAZARDOUS WASTE BIENNIAL REPORTER (Resource Conservation and Recovery Act (tracking hazardous waste)) (Resource Conservation and Recovery Act (tracking hazardous waste)) TRI REPORTER (Tracking of toxic chemicals releasing facilities) Business SIC classification: PLASTICS PRODUCTS; METAL STAMPINGS; LIGHTING EQUIPMENT Business NAICS classification: ALL OTHER PLASTICS PRODUCT MANUFACTURING.; METAL COATING, ENGRAVING (EXCEPT JEWELRY AND SILVERWARE), AND ALLIED SERVICES TO MANUFACTURERS. Organizations: SHORE HOLDINGS INC (CONTACT/OWNER)
Alternative names: BRIDGEPORT METAL GOODS MFG. CO.
ALUMINUM FINISHING CO (1575 RAILROAD AVENUE in BRIDGEPORT, CT)
AIR MINOR (AIRS/AFS) National Pollutant Discharge Elimination System NON-MAJOR (Tracking pollutant discharge elimination systems) - permit HAZARDOUS WASTE BIENNIAL REPORTER (Resource Conservation and Recovery Act (tracking hazardous waste)) Large Quantity Generators, more that 1000 kg of hazardous waste/month (Resource Conservation and Recovery Act (tracking hazardous waste)) - notification TRI REPORTER (Tracking of toxic chemicals releasing facilities) Business SIC and NAICS classification: ELECTROPLATING, PLATING, POLISHING, ANODIZING, AND COLORING Organizations: SIURI REALTY (CONTACT/OPERATOR)
, EDWARD SIURI (CONTACT/OWNER)
Alternative names: ALUMINUM FINISHING CO. (BRIDGE, ALUMINUM FINISHING COMPANY, IN, ALUMINUM FINISHING CO.
CALZONE LIMITED (225 BLACK ROCK AVE. in BRIDGEPORT, CT)
(Integrated Compliance Information System) - ICIS-01-1995-0096, FORMAL ENFORCEMENT ACTION COMPLIANCE ACTIVITY (Tracking inspections of insecticide, fungicide, and rodenticide, and toxic substances) TRI REPORTER (Tracking of toxic chemicals releasing facilities) Business SIC classification: LUGGAGE Alternative names: CALZONE CASE CO INC
BRYANT SCHOOL (230 POPLAR STREET in BRIDGEPORT, CT)
(Geographic Names Information System) (National Center for Education Statistics) - STATE ID-4 Organizations: BRIDGEPORT SCHOOL DISTRICT (SCHOOL DISTRICT)
O&G INDUSTRIES INC BRIDGEPORT (240-260 BOSTWICK AVE in BRIDGEPORT, CT)
AIR SYNTHETIC MINOR (AIRS/AFS) AIR MAJOR ("Best Available" air pollution technologies tracking) Conditionally Exempt Small Quantity Generators, less than 100 kg/month of hazardous waste (Resource Conservation and Recovery Act (tracking hazardous waste)) USED OIL PROGRAM (Resource Conservation and Recovery Act (tracking hazardous waste)) TRI REPORTER (Tracking of toxic chemicals releasing facilities) Business SIC classification: ASPHALT PAVING MIXTURES AND BLOCKS; READY-MIXED CONCRETE Organizations: O & G INDUSTRIES INC (CONTACT/OPERATOR)
, OWNERNAME (CONTACT/OWNER)
Alternative names: O & G INDUSTRIES, INC., O & G INDUSTRIES, INC., O&G INDUSTRIES (BRIDGEPORT), O & G IND BRIDGEPORT REPAIR GARAGE
BLACK ROCK SCHOOL (545 BREWSTER STREET in BRIDGEPORT, CT)
(Geographic Names Information System) (National Center for Education Statistics) - STATE ID-3 Organizations: BRIDGEPORT SCHOOL DISTRICT (SCHOOL DISTRICT)
HOWE SCHOOL (287 CLINTON AVENUE in BRIDGEPORT, CT)
(Geographic Names Information System) (National Center for Education Statistics) - STATE ID-14 Organizations: BRIDGEPORT SCHOOL DISTRICT (SCHOOL DISTRICT)
BLACK ROCK SHIPYARD (10 BREWSTER STREET in BRIDGEPORT, CT)
SUPERFUND (Superfund database) (Integrated Compliance Information System) - ICIS-01-2001-0015, FORMAL ENFORCEMENT ACTION Alternative names: BLOCK ROCK SHIPYARD
CAPITOL ELECTRIC CNSTR CO (14 MONTGOMERY ST in BRIDGEPORT, CT)
(Integrated Compliance Information System) - ICIS-01-1995-0027, FORMAL ENFORCEMENT ACTION COMPLIANCE ACTIVITY (Tracking inspections of insecticide, fungicide, and rodenticide, and toxic substances)
GEOCLEAN ENVIRONMENTAL INCORPORATED (555 BOSTWICK AVENUE in BRIDGEPORT, CT)
AIR MINOR (AIRS/AFS) (Resource Conservation and Recovery Act (tracking hazardous waste)) Business SIC classification: SERVICES Business NAICS classification: ORNAMENTAL AND ARCHITECTURAL METAL WORK MANUFACTURING.
DEVAR, INC (706 BOSTWICK AVE in BRIDGEPORT, CT)
AIR MINOR (AIRS/AFS) (Resource Conservation and Recovery Act (tracking hazardous waste)) Business SIC classification: INDUSTRIAL INSTRUMENTS FOR MEASUREMENT, DISPLAY, AND CONTROL OF PROCESS VARIABLES; AND RELATED PRODUCTS Organizations: ANTHONY U RUSCITO (CONTACT/OWNER)
Housing units lacking complete plumbing facilities: 0.6% Housing units lacking complete kitchen facilities: 1.6%
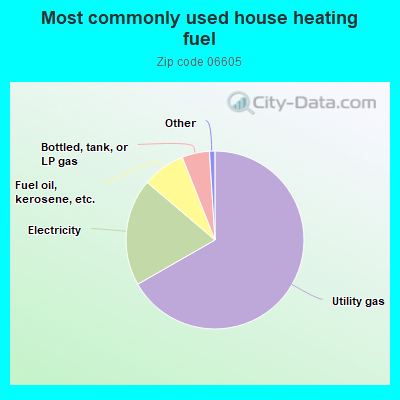
63.6%Utility gas
22.2%Electricity
7.7%Fuel oil, kerosene, etc.
5.3%Bottled, tank, or LP gas
0.6%No fuel used
Population in 1990: 23,800.
Place of birth for U.S.-born residents:
This state: 10,681
Northeast: 4,067
Midwest: 697
South: 1,203
West: 144
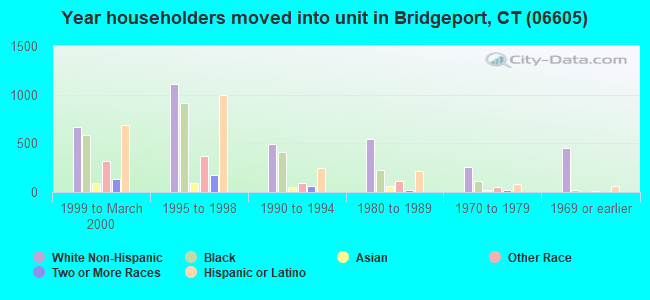
54% of the 06605 zip code residents lived in the same house 5 years ago. Out of people who lived in different houses, 78% lived in this county. Out of people who lived in different counties, 50% lived in Connecticut.
84% of the 06605 zip code residents lived in the same house 1 year ago. Out of people who lived in different houses, 44% moved from this county. Out of people who lived in different houses, 25% moved from different county within same state. Out of people who lived in different houses, 20% moved from different state. Out of people who lived in different houses, 12% moved from abroad.
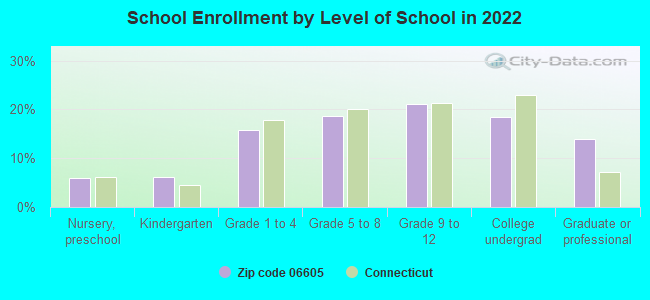
Private vs. public school enrollment:
Students in private schools in grades 1 to 8 (elementary and middle school): 304
Here:
13.8%
Connecticut:
8.6%
Students in private schools in grades 9 to 12 (high school): 150
Here:
12.0%
Connecticut:
10.3%
Students in private undergraduate colleges: 255
Here:
24.7%
Connecticut:
34.8%
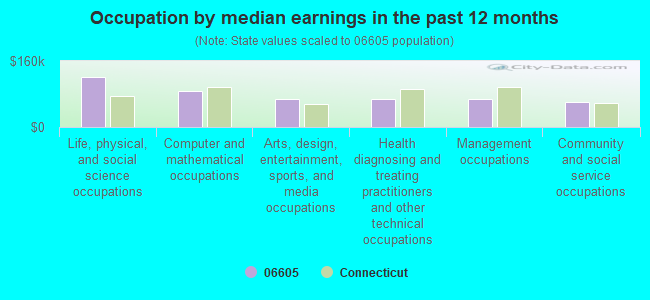
Occupation by median earnings in the past 12 months ($)
124,495Life, physical, and social science occupations
86,902Computer and mathematical occupations
76,105Management occupations
66,592Health diagnosing and treating practitioners and other technical occupations
65,834Arts, design, entertainment, sports, and media occupations
61,201Education, training, and library occupations
Companies with federal contracts located in this zip code (BRIDGEPORT, CT):
DOVER TOOL COMPANY, INC (297 ORLAND STREET; small business) : $14,797,387 in 56 contractsfrom 1999 to 2006
Contracts for Gas Turbines and Jet Engines, Aircraft; Prime Moving, and Components, Gas Turbines and Jet Engines, Non-Aircraft; and Components, Bearings, Mounted, Miscellaneous Maintenance and Repair Shop Specialized Equipment, and moreby Defense Logistics Agency, Air Force, Army Signed by year:2000: $832,748; 2001: $1,082,886; 2002: $3,145,207; 2003: $324,943; 2004: $1,280,148; 2005: $7,094,819; 2006: $81,136.
Biggest contracts:
$2,254,500 with Defense Logistics Agency for Gas Turbines and Jet Engines, Aircraft; Prime Moving, and Components. Signed on 2005-05-18. Completion date: 2007-02-07.
$2,250,000, same as above.Signed on 2005-12-28. Completion date: 2007-09-30.
$1,859,520 with Air Force for Gas Turbines and Jet Engines, Aircraft; Prime Moving, and Components. Signed on 2002-04-10. Completion date: 2003-12-31.
$1,819,808, same as above.Signed on 2005-07-21. Completion date: 2007-11-30.
BUCKLEY ENERGY GROUP LTD (154 ADMIRAL ST; small business) : $1,689,902 in 28 contractsfrom 2002 to 2006
Contracts for Fuel Oils, Fueling and Other Petroleum Services - Excluding Storage, Gas Services, Liquid Propellants and Fuels, Petroleum Base by Defense Logistics Agency, Army Signed by year:2000: $0; 2001: $0; 2002: $873,151; 2003: $1,035; 2004: $8,161; 2005: $355,641; 2006: $451,914.
Biggest contracts:
$873,151 with Defense Logistics Agency for Fuel Oils. Signed on 2002-08-01. Completion date: 2005-07-31.
$438,328, same as above.Signed on 2006-01-17. Completion date: 2011-01-31.
$316,353 with Defense Logistics Agency for Fuel Oils. Taking place in MI. Signed on 2005-03-09. Completion date: 2005-07-31.
$13,586 with Army for Fuel Oils. Signed on 2006-06-08. Completion date: 2006-06-09.
A ROYAL FLUSH INC (146 ANDOVER STREET; small business) : $874,678 in 89 contractsfrom 2000 to 2006
Contracts for Lease or Rental of Equipment -- Miscellaneous, Other Housekeeping Services, Maintenance, Repair and Rebuilding of Equipment -- Miscellaneous, Lease or Rental of Equipment -- Weapons, and moreby Army, National Park Service, Navy Signed by year:2000: $63,693; 2001: $61,105; 2002: $40,426; 2003: $90,351; 2004: $285,394; 2005: $223,723; 2006: $109,986.
Biggest contracts:
$92,612 with Army for Lease or Rental of Equipment -- Miscellaneous. Signed on 2006-05-02. Completion date: 2006-08-15.
$88,928 with Army for Lease or Rental of Equipment -- Miscellaneous. Taking place in NY. Signed on 2004-05-06. Completion date: 2004-08-20.
$85,261 with Army for Lease or Rental of Equipment -- Miscellaneous. Signed on 2005-05-05. Completion date: 2005-08-19.
$77,324 with National Park Service for Other Housekeeping Services. Taking place in DC. Signed on 2005-10-01. Completion date: 2006-09-30.
RAMPAGE,LLC (1625 RAILROAD AVE; small business) : $102,267 in 2 contractsin 2003
$54,400 with Army for Recreational and Gymnastic Equipment. Signed on 2003-09-30. Completion date: 2004-05-17.
$47,867 with Air Force for Athletic and Sporting Equipment. Signed on 2003-09-26. Completion date: 2004-04-02.
SAFETY MARKING INC (460 BOSTWICK AVE; small business) : $100,118 in 16 contractsfrom 2000 to 2003
Contracts for Maintenance, Repair or Alteration of Real Property -- Other Non-Building Facilities, Maintenance, Repair or Alteration of Real Property -- Miscellaneous Buildings by Navy Signed by year:2000: $29,133; 2001: $0; 2002: $62,100; 2003: $8,885; 2004: $0; 2005: $0; 2006: $0.
Biggest contracts:
$36,250 with Navy for Maintenance, Repair or Alteration of Real Property -- Other Non-Building Facilities. Signed on 2002-09-11. Completion date: 2002-10-30.
$30,813, same as above.Signed on 2003-01-06. Completion date: 2002-10-30.
$25,850, same as above.Signed on 2002-09-04. Completion date: 2002-11-20.
$15,643 with Navy for Maintenance, Repair or Alteration of Real Property -- Miscellaneous Buildings. Signed on 2000-07-07. Completion date: 2000-07-17.
CALZONE LTD (225 BLACK ROCK AVE; small business) : $78,138 in 11 contractsfrom 2003 to 2005
Contracts for Musical Instrument Parts and Accessories, Miscellaneous Items, Specialized Shipping and Storage Containers, Luggage by Army, Navy Signed by year:2000: $0; 2001: $0; 2002: $0; 2003: $8,175; 2004: $52,231; 2005: $17,732; 2006: $0.
Biggest contracts:
$17,872 with Army for Musical Instrument Parts and Accessories. Signed on 2004-03-23. Completion date: 2004-04-30.
$13,186 with Navy for Miscellaneous Items. Taking place in TX. Signed on 2005-09-29. Completion date: 2005-10-28.
$11,550 with Navy for Musical Instrument Parts and Accessories. Signed on 2004-12-30. Completion date: 2005-02-14.
$10,598 with Army for Musical Instrument Parts and Accessories. Signed on 2004-09-28. Completion date: 2004-11-09.
MODERN PLASTICS, INC (678 HOWARD AVE; small business) : $26,332 in 6 contractsfrom 2003 to 2006
Contracts for Plastics Fabricated Materials, Switches by Navy, Defense Logistics Agency, Army Signed by year:2000: $0; 2001: $0; 2002: $0; 2003: $9,336; 2004: $2,963; 2005: $7,433; 2006: $6,600.
Biggest contracts:
$9,036 with Navy for Plastics Fabricated Materials. Signed on 2003-11-21. Completion date: 2004-01-09.
$6,600 with Defense Logistics Agency for Switches. Signed on 2006-05-10. Completion date: 2006-06-15.
$4,569 with Navy for Plastics Fabricated Materials. Signed on 2005-07-01. Completion date: 2005-08-12.
$2,963, same as above.Signed on 2004-04-20. Completion date: 2004-04-30.
PANISH CONTROLS INCORPORATED (191 BENNETT ST; small business) : $20,335 in 4 contractsfrom 2002 to 2006
$6,663 with Navy for Cable, Cord, and Wire Assemblies: Communications Equipment. Signed on 2002-12-19. Completion date: 2003-01-10.
$5,565 with Defense Logistics Agency for Miscellaneous Power Transmission Equipment. Signed on 2006-04-11. Completion date: 2006-07-10.
$4,566 with Navy for Cable, Cord, and Wire Assemblies: Communications Equipment. Signed on 2004-01-07. Completion date: 2004-01-16.
$3,541 with Defense Logistics Agency for Miscellaneous Vehicular Components. Signed on 2004-10-22. Completion date: 2005-01-20.
RAJ INC (67 POLAND ST; small business)
$7,928 with Air Force for Cable, Cord, and Wire Assemblies: Communications Equipment. Signed on 2005-09-22. Completion date: 2005-10-31.
KLEIN MEMORIAL AUDITORIUM FOUN (910 FAIRFIELD AVE)
$5,926 with Army for Recreational Services. Signed on 2003-12-23. Completion date: 2004-02-06.
Top industries in this zip code by the number of employees in 2005:
Health Care and Social Assistance: Other Individual and Family Services (100-249 employees: 1 establishment, 20-49 employees: 2 establishments, 10-19 employees: 1 establishment)
Administrative and Support and Waste Management and Remediation Services: Solid Waste Collection (100-249: 1, 50-99: 1, 1-4: 1)
Health Care and Social Assistance: Residential Mental Retardation Facilities (100-249: 1, 10-19: 1)
Administrative and Support and Waste Management and Remediation Services: Janitorial Services (50-99: 1, 20-49: 1, 1-4: 3)
People in group quarters in 2010:
119 people in nursing facilities/skilled-nursing facilities
101 people in other noninstitutional facilities
61 people in emergency and transitional shelters (with sleeping facilities) for people experiencing homelessness
54 people in group homes intended for adults
46 people in correctional residential facilities
14 people in workers' group living quarters and job corps centers
10 people in residential treatment centers for adults
7 people in group homes for juveniles (non-correctional)
People in group quarters in 2000:
130 people in nursing homes
114 people in other noninstitutional group quarters
23 people in halfway houses
6 people in homes or halfway houses for drug/alcohol abuse
5 people in homes for the mentally retarded
Fatal accident statistics in 2014:
Fatal accident count: 1
Vehicles involved in fatal accidents: 1
Fatal accidents caused by drunken drivers: 0
Fatalities: 1
Persons involved in fatal accidents: 1
Pedestrians involved in fatal accidents: 0
Fatal accident statistics in 2013:
Fatal accident count: 1
Vehicles involved in fatal accidents: 2
Fatal accidents caused by drunken drivers: 0
Fatalities: 1
Persons involved in fatal accidents: 5
Pedestrians involved in fatal accidents: 0
Home Mortgage Disclosure Act Aggregated Statistics For Year 2009 (Based on 16 partial tracts)
A) FHA, FSA/RHS & VA Home Purchase Loans
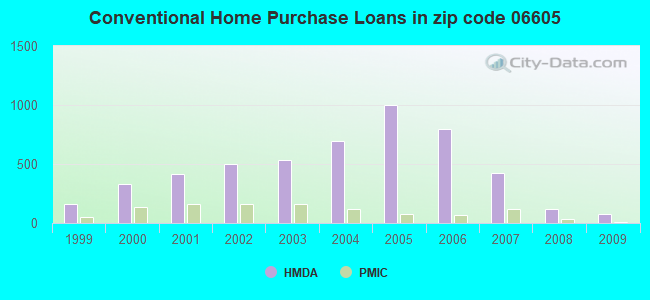
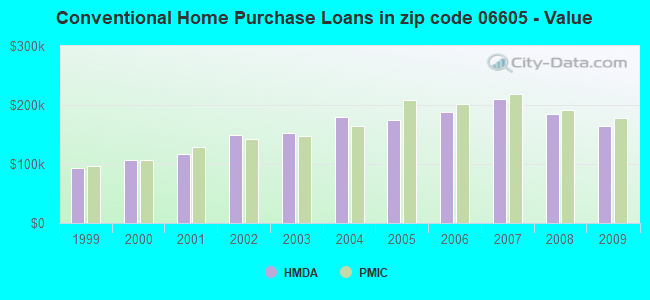
B) Conventional Home Purchase Loans
C) Refinancings
D) Home Improvement Loans
E) Loans on Dwellings For 5+ Families
F) Non-occupant Loans on < 5 Family Dwellings (A B C & D)
Number
Average Value
Number
Average Value
Number
Average Value
Number
Average Value
Number
Average Value
Number
Average Value
LOANS ORIGINATED
50
$200,227
76
$164,242
181
$210,841
20
$102,442
5
$361,254
39
$139,047
APPLICATIONS APPROVED, NOT ACCEPTED
12
$143,935
9
$107,112
35
$215,649
5
$20,338
0
$0
12
$151,381
APPLICATIONS DENIED
31
$174,603
26
$121,703
188
$224,662
39
$70,015
0
$0
41
$139,971
APPLICATIONS WITHDRAWN
11
$181,015
14
$103,449
81
$257,028
0
$0
2
$108,780
20
$187,440
FILES CLOSED FOR INCOMPLETENESS
4
$156,498
1
$131,540
19
$260,297
1
$210,460
0
$0
0
$0
Aggregated Statistics For Year 2008 (Based on 14 partial tracts)
A) FHA, FSA/RHS & VA Home Purchase Loans
B) Conventional Home Purchase Loans
C) Refinancings
D) Home Improvement Loans
E) Loans on Dwellings For 5+ Families
F) Non-occupant Loans on < 5 Family Dwellings (A B C & D)
G) Loans On Manufactured Home Dwelling (A B C & D)
Number
Average Value
Number
Average Value
Number
Average Value
Number
Average Value
Number
Average Value
Number
Average Value
Number
Average Value
LOANS ORIGINATED
37
$224,034
118
$185,153
255
$229,930
33
$61,865
14
$964,855
65
$196,106
0
$0
APPLICATIONS APPROVED, NOT ACCEPTED
7
$240,779
26
$204,902
76
$218,128
26
$47,792
3
$313,943
12
$223,220
0
$0
APPLICATIONS DENIED
19
$164,455
83
$211,522
351
$227,643
99
$52,147
7
$308,473
81
$173,499
2
$115,025
APPLICATIONS WITHDRAWN
17
$224,915
24
$176,280
78
$231,260
8
$111,200
0
$0
12
$186,698
0
$0
FILES CLOSED FOR INCOMPLETENESS
0
$0
12
$192,473
24
$230,698
0
$0
0
$0
4
$150,790
0
$0
Aggregated Statistics For Year 2007 (Based on 16 partial tracts)
A) FHA, FSA/RHS & VA Home Purchase Loans
B) Conventional Home Purchase Loans
C) Refinancings
D) Home Improvement Loans
E) Loans on Dwellings For 5+ Families
F) Non-occupant Loans on < 5 Family Dwellings (A B C & D)
G) Loans On Manufactured Home Dwelling (A B C & D)
Number
Average Value
Number
Average Value
Number
Average Value
Number
Average Value
Number
Average Value
Number
Average Value
Number
Average Value
LOANS ORIGINATED
40
$248,646
422
$210,773
410
$209,507
69
$104,702
29
$940,721
165
$228,601
0
$0
APPLICATIONS APPROVED, NOT ACCEPTED
3
$288,237
105
$192,374
177
$252,979
17
$214,200
0
$0
39
$217,657
0
$0
APPLICATIONS DENIED
3
$177,027
290
$243,909
544
$239,100
111
$84,116
6
$585,237
165
$239,267
2
$131,460
APPLICATIONS WITHDRAWN
10
$301,886
70
$187,445
209
$220,118
19
$164,020
0
$0
33
$278,225
0
$0
FILES CLOSED FOR INCOMPLETENESS
3
$139,593
50
$220,122
56
$256,054
1
$304,480
0
$0
5
$274,022
0
$0
Aggregated Statistics For Year 2006 (Based on 16 partial tracts)
A) FHA, FSA/RHS & VA Home Purchase Loans
B) Conventional Home Purchase Loans
C) Refinancings
D) Home Improvement Loans
E) Loans on Dwellings For 5+ Families
F) Non-occupant Loans on < 5 Family Dwellings (A B C & D)
G) Loans On Manufactured Home Dwelling (A B C & D)
Number
Average Value
Number
Average Value
Number
Average Value
Number
Average Value
Number
Average Value
Number
Average Value
Number
Average Value
LOANS ORIGINATED
22
$270,415
794
$188,065
741
$212,682
117
$97,655
14
$224,902
289
$218,938
0
$0
APPLICATIONS APPROVED, NOT ACCEPTED
5
$261,056
131
$177,763
195
$185,658
20
$39,990
0
$0
51
$214,995
0
$0
APPLICATIONS DENIED
3
$298,930
395
$184,893
685
$200,148
133
$84,036
3
$158,800
149
$223,790
1
$446,100
APPLICATIONS WITHDRAWN
8
$273,754
182
$188,610
363
$216,731
22
$138,385
2
$60,430
51
$212,587
5
$277,064
FILES CLOSED FOR INCOMPLETENESS
0
$0
34
$160,509
97
$194,132
7
$138,900
0
$0
11
$200,112
0
$0
Aggregated Statistics For Year 2005 (Based on 16 partial tracts)
A) FHA, FSA/RHS & VA Home Purchase Loans
B) Conventional Home Purchase Loans
C) Refinancings
D) Home Improvement Loans
E) Loans on Dwellings For 5+ Families
F) Non-occupant Loans on < 5 Family Dwellings (A B C & D)
G) Loans On Manufactured Home Dwelling (A B C & D)
Number
Average Value
Number
Average Value
Number
Average Value
Number
Average Value
Number
Average Value
Number
Average Value
Number
Average Value
LOANS ORIGINATED
42
$255,575
1,000
$175,082
917
$202,017
96
$118,063
27
$1,038,001
323
$194,607
0
$0
APPLICATIONS APPROVED, NOT ACCEPTED
3
$345,793
122
$187,086
135
$207,693
22
$58,868
3
$419,200
37
$182,416
0
$0
APPLICATIONS DENIED
8
$259,951
390
$193,485
678
$194,308
163
$82,865
4
$299,570
125
$220,399
5
$103,844
APPLICATIONS WITHDRAWN
13
$221,005
235
$175,618
526
$183,856
41
$170,784
7
$279,676
113
$182,989
2
$140,585
FILES CLOSED FOR INCOMPLETENESS
0
$0
69
$151,420
271
$201,234
6
$38,462
2
$277,105
18
$151,149
0
$0
Aggregated Statistics For Year 2004 (Based on 16 partial tracts)
A) FHA, FSA/RHS & VA Home Purchase Loans
B) Conventional Home Purchase Loans
C) Refinancings
D) Home Improvement Loans
E) Loans on Dwellings For 5+ Families
F) Non-occupant Loans on < 5 Family Dwellings (A B C & D)
G) Loans On Manufactured Home Dwelling (A B C & D)
Number
Average Value
Number
Average Value
Number
Average Value
Number
Average Value
Number
Average Value
Number
Average Value
Number
Average Value
LOANS ORIGINATED
69
$194,870
694
$179,344
894
$179,760
102
$99,812
17
$1,454,639
307
$187,091
0
$0
APPLICATIONS APPROVED, NOT ACCEPTED
5
$103,884
119
$160,511
212
$186,288
22
$64,331
2
$929,700
66
$177,407
0
$0
APPLICATIONS DENIED
10
$209,940
227
$151,850
563
$159,514
126
$61,632
4
$831,358
111
$152,590
3
$30,160
APPLICATIONS WITHDRAWN
16
$243,408
98
$180,866
330
$161,717
29
$122,309
0
$0
49
$150,034
0
$0
FILES CLOSED FOR INCOMPLETENESS
4
$155,205
45
$158,599
253
$171,811
5
$55,612
0
$0
18
$196,678
0
$0
Aggregated Statistics For Year 2003 (Based on 16 partial tracts)
A) FHA, FSA/RHS & VA Home Purchase Loans
B) Conventional Home Purchase Loans
C) Refinancings
D) Home Improvement Loans
E) Loans on Dwellings For 5+ Families
F) Non-occupant Loans on < 5 Family Dwellings (A B C & D)
Number
Average Value
Number
Average Value
Number
Average Value
Number
Average Value
Number
Average Value
Number
Average Value
LOANS ORIGINATED
62
$188,294
534
$152,491
1,240
$148,511
61
$40,824
4
$516,538
318
$140,120
APPLICATIONS APPROVED, NOT ACCEPTED
9
$121,212
83
$149,375
237
$131,943
16
$34,249
1
$322,270
48
$133,074
APPLICATIONS DENIED
12
$125,974
159
$151,665
738
$138,560
83
$26,560
1
$239,400
125
$130,744
APPLICATIONS WITHDRAWN
11
$163,003
93
$147,176
439
$138,427
25
$27,735
2
$221,270
37
$117,368
FILES CLOSED FOR INCOMPLETENESS
4
$92,358
16
$142,367
45
$138,176
2
$115,025
0
$0
18
$128,486
Aggregated Statistics For Year 2002 (Based on 16 partial tracts)
A) FHA, FSA/RHS & VA Home Purchase Loans
B) Conventional Home Purchase Loans
C) Refinancings
D) Home Improvement Loans
E) Loans on Dwellings For 5+ Families
F) Non-occupant Loans on < 5 Family Dwellings (A B C & D)
Number
Average Value
Number
Average Value
Number
Average Value
Number
Average Value
Number
Average Value
Number
Average Value
LOANS ORIGINATED
78
$134,995
504
$148,426
785
$160,497
58
$42,432
5
$350,804
216
$129,205
APPLICATIONS APPROVED, NOT ACCEPTED
9
$151,697
74
$152,633
175
$125,089
20
$24,604
3
$103,123
45
$115,095
APPLICATIONS DENIED
17
$141,986
127
$119,450
452
$120,334
109
$29,104
6
$156,328
96
$106,665
APPLICATIONS WITHDRAWN
5
$217,592
45
$144,013
265
$118,962
32
$42,364
2
$790,245
26
$106,740
FILES CLOSED FOR INCOMPLETENESS
0
$0
51
$97,188
63
$147,760
2
$12,365
0
$0
24
$98,980
Aggregated Statistics For Year 2001 (Based on 16 partial tracts)
A) FHA, FSA/RHS & VA Home Purchase Loans
B) Conventional Home Purchase Loans
C) Refinancings
D) Home Improvement Loans
E) Loans on Dwellings For 5+ Families
F) Non-occupant Loans on < 5 Family Dwellings (A B C & D)
Number
Average Value
Number
Average Value
Number
Average Value
Number
Average Value
Number
Average Value
Number
Average Value
LOANS ORIGINATED
123
$129,728
415
$116,458
555
$121,500
78
$25,285
6
$940,783
168
$107,640
APPLICATIONS APPROVED, NOT ACCEPTED
8
$151,975
66
$104,722
115
$111,921
25
$21,674
5
$193,882
40
$99,634
APPLICATIONS DENIED
17
$121,987
191
$105,146
457
$99,069
178
$25,037
3
$225,437
67
$102,256
APPLICATIONS WITHDRAWN
5
$124,804
78
$135,224
169
$91,239
79
$38,869
0
$0
33
$83,887
FILES CLOSED FOR INCOMPLETENESS
5
$97,812
19
$90,851
81
$102,041
10
$45,704
0
$0
12
$82,399
Aggregated Statistics For Year 2000 (Based on 16 partial tracts)
A) FHA, FSA/RHS & VA Home Purchase Loans
B) Conventional Home Purchase Loans
C) Refinancings
D) Home Improvement Loans
E) Loans on Dwellings For 5+ Families
F) Non-occupant Loans on < 5 Family Dwellings (A B C & D)
Number
Average Value
Number
Average Value
Number
Average Value
Number
Average Value
Number
Average Value
Number
Average Value
LOANS ORIGINATED
119
$114,434
328
$106,792
260
$91,130
142
$9,536
12
$155,148
102
$94,797
APPLICATIONS APPROVED, NOT ACCEPTED
6
$122,615
67
$111,361
72
$81,768
43
$20,797
0
$0
22
$73,820
APPLICATIONS DENIED
20
$106,612
211
$99,992
297
$77,824
109
$32,940
2
$577,150
65
$83,964
APPLICATIONS WITHDRAWN
11
$146,315
63
$99,981
126
$75,648
27
$34,620
2
$10,040
24
$76,405
FILES CLOSED FOR INCOMPLETENESS
0
$0
12
$96,330
80
$99,420
2
$21,495
0
$0
4
$82,870
Aggregated Statistics For Year 1999 (Based on 7 partial tracts)
A) FHA, FSA/RHS & VA Home Purchase Loans
B) Conventional Home Purchase Loans
C) Refinancings
D) Home Improvement Loans
E) Loans on Dwellings For 5+ Families
F) Non-occupant Loans on < 5 Family Dwellings (A B C & D)
2002 - 2018 National Fire Incident Reporting System (NFIRS) incidents
Based on the data from the years 2002 - 2018 the average number of fires per year is 77. The highest number of fires - 165 took place in 2002, and the least - 12 in 2003. The data has a dropping trend.
When looking into fire subcategories, the most incidents belonged to: Outside Fires (39.8%), and Structure Fires (32.4%).
Fire incident types reported to NFIRS in Zip Code 06605


 Nearest zip codes: 06604, 06825, 06608, 06607, 06606, 06824.


 Based on the data from the years 2002 - 2018 the average number of fires per year is 77. The highest number of fires - 165 took place in 2002, and the least - 12 in 2003. The data has a dropping trend.
 When looking into fire subcategories, the most incidents belonged to: Outside Fires (39.8%), and Structure Fires (32.4%).