Estimated zip code population in 2023: 7,749 Zip code population in 2010: 7,843 Zip code population in 2000: 7,600
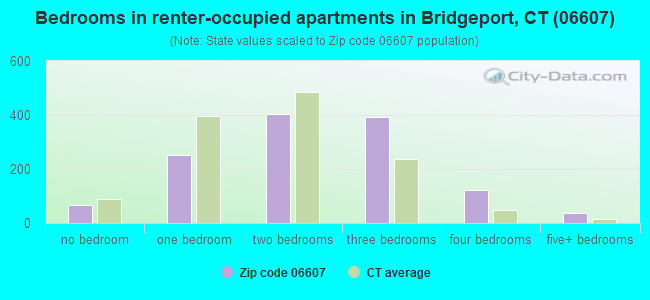
Houses and condos: 2,713 Renter-occupied apartments: 1,483
% of renters here:
59%
State:
34%
March 2022 cost of living index in zip code 06607: 129.0 (high, U.S. average is 100)
Land area: 1.2 sq. mi. Water area: 0.8 sq. mi.
Population density: 6,628 people per square mile
(high).
OSM Map
Google Map
MSN Map
OSM Map
General Map
Google Map
MSN Map
OSM Map
Google Map
MSN Map
OSM Map
Google Map
MSN Map
Please wait while loading the map...
Real estate property taxes paid for housing units in 2023:
This zip code:
2.0% ($4,791)
Connecticut:
1.7% ($6,388)
Median real estate property taxes paid for housing units with mortgages in 2023: $5,697 (2.8%) Median real estate property taxes paid for housing units with no mortgage in 2023: $4,404 (1.8%)
Averages for the 2020 tax year for zip code 06607, filed in 2021:
Average Adjusted Gross Income (AGI) in 2020: $31,061 (Individual Income Tax Returns)
Here:
$31,061
State:
$105,931
Salary/wage: $29,534 (reported on 86.2% of returns)
Here:
$29,534
State:
$83,540
(% of AGI for various income ranges: 1136.8% for AGIs below $25k, 3421.3% for AGIs $25k-50k, 6620.0% for AGIs $50k-75k, 9765.5% for AGIs $75k-100k, 17580.0% for AGIs $100k-200k)
Taxable interest for individuals: $117 (reported on 6.2% of returns)
This zip code:
$117
Connecticut:
$3,402
(% of AGI for various income ranges: 0.4% for AGIs below $25k, 0.7% for AGIs $25k-50k, 1.5% for AGIs $50k-75k, 8.2% for AGIs $75k-100k)
Ordinary dividends: $317 (reported on 1.5% of returns)
Here:
$317
State:
$12,683
(% of AGI for various income ranges: 0.9% for AGIs below $25k, 1.5% for AGIs $50k-75k)
Net capital gain/loss in AGI: +$1,114 (reported on 1.8% of returns)
Here:
+$1,114
State:
+$44,158
(% of AGI for various income ranges: 1.0% for AGIs below $25k, 18.5% for AGIs $50k-75k)
Profit/loss from business: +$6,697 (reported on 15.6% of returns)
Here:
+$6,697
State:
+$22,988
(% of AGI for various income ranges: 142.6% for AGIs below $25k, 112.1% for AGIs $25k-50k, 96.5% for AGIs $50k-75k, 265.5% for AGIs $75k-100k)
Taxable individual retirement arrangement distribution: $4,567 (reported on 0.8% of returns)
06607:
$4,567
Connecticut:
$22,031
(% of AGI for various income ranges: 9.1% for AGIs below $25k)
Total itemized deductions: $24,130 (reported on 2.6% of returns)
Here:
$24,130
State:
$37,613
(% of AGI for various income ranges: 28.9% for AGIs below $25k, 221.2% for AGIs $50k-75k, 1113.6% for AGIs $75k-100k)
Charity contributions: $8,962 (reported on 2.1% of returns)
Here:
$8,962
State:
$13,557
(% of AGI for various income ranges: 74.4% for AGIs $50k-75k, 421.8% for AGIs $75k-100k)
Taxes paid: $7,890 (reported on 2.6% of returns)
06607:
$7,890
State:
$9,096
(% of AGI for various income ranges: 13.6% for AGIs below $25k, 64.7% for AGIs $50k-75k, 330.9% for AGIs $75k-100k)
Earned income credit: $2,334 (reported on 34.4% of returns)
Here:
$2,334
State:
$2,059
(% of AGI for various income ranges: 132.1% for AGIs below $25k, 96.8% for AGIs $25k-50k)
Percentage of individuals using paid preparers for their 2020 taxes: 94.1%
Here:
94%
State:
93%
(% for various income ranges: 92.6% for AGIs below $25k, 95.6% for AGIs $25k-50k, 95.3% for AGIs $50k-75k, 93.3% for AGIs $75k-100k, 100.0% for AGIs $100k-200k)
Averages for the 2012 tax year for zip code 06607, filed in 2013:
Average Adjusted Gross Income (AGI) in 2012: $25,948 (Individual Income Tax Returns)
Here:
$25,948
State:
$93,290
Salary/wage: $25,247 (reported on 87.9% of returns)
Here:
$25,247
State:
$73,117
(% of AGI for various income ranges: 79.5% for AGIs below $25k, 91.1% for AGIs $25k-50k, 84.1% for AGIs $50k-75k, 90.1% for AGIs $75k-100k, 75.9% for AGIs $100k-200k)
Taxable interest for individuals: $448 (reported on 10.0% of returns)
This zip code:
$448
Connecticut:
$2,530
(% of AGI for various income ranges: 0.2% for AGIs $25k-50k, 0.5% for AGIs $50k-75k)
Ordinary dividends: $1,089 (reported on 2.7% of returns)
Here:
$1,089
State:
$10,909
(% of AGI for various income ranges: 0.2% for AGIs $25k-50k)
Profit/loss from business: +$5,784 (reported on 13.0% of returns)
Here:
+$5,784
State:
+$22,741
(% of AGI for various income ranges: 8.5% for AGIs below $25k, 0.7% for AGIs $25k-50k, 1.3% for AGIs $50k-75k)
Taxable individual retirement arrangement distribution: $7,514 (reported on 2.1% of returns)
06607:
$7,514
Connecticut:
$19,976
Total itemized deductions: $16,544 (32% of AGI, reported on 12.4% of returns)
Here:
$16,544
State:
$33,239
Here:
31.7% of AGI
State:
18.9% of AGI
(% of AGI for various income ranges: 3.7% for AGIs below $25k, 6.9% for AGIs $25k-50k, 12.8% for AGIs $50k-75k, 12.3% for AGIs $75k-100k, 12.2% for AGIs $100k-200k)
Charity contributions: $3,807 (reported on 9.1% of returns)
Here:
$3,807
State:
$4,947
(% of AGI for various income ranges: 0.4% for AGIs below $25k, 1.1% for AGIs $25k-50k, 2.2% for AGIs $50k-75k, 2.1% for AGIs $75k-100k, 3.6% for AGIs $100k-200k)
Taxes paid: $5,968 (reported on 12.4% of returns)
06607:
$5,968
State:
$17,397
(% of AGI for various income ranges: 1.1% for AGIs below $25k, 2.3% for AGIs $25k-50k, 4.5% for AGIs $50k-75k, 5.4% for AGIs $75k-100k, 5.0% for AGIs $100k-200k)
Earned income credit: $2,377 (reported on 42.6% of returns)
Here:
$2,377
State:
$2,053
(% of AGI for various income ranges: 11.4% for AGIs below $25k, 1.8% for AGIs $25k-50k)
Percentage of individuals using paid preparers for their 2012 taxes: 58.9%
Here:
59%
State:
55%
(% for various income ranges: 57.1% for AGIs below $25k, 59.8% for AGIs $25k-50k, 63.0% for AGIs $50k-75k, 70.0% for AGIs $75k-100k, 75.0% for AGIs $100k-200k)
Averages for the 2004 tax year for zip code 06607, filed in 2005:
Average Adjusted Gross Income (AGI) in 2004: $23,888 (Individual Income Tax Returns)
Here:
$23,888
State:
$73,265
Salary/wage: $23,310 (reported on 92.1% of returns)
Here:
$23,310
State:
$62,030
(% of AGI for various income ranges: 88.9% for AGIs below $10k, 89.8% for AGIs $10k-25k, 93.8% for AGIs $25k-50k, 91.7% for AGIs $50k-75k, 84.2% for AGIs $75k-100k, 59.4% for AGIs over 100k)
Taxable interest for individuals: $215 (reported on 16.4% of returns)
This zip code:
$215
Connecticut:
$2,287
(% of AGI for various income ranges: 0.6% for AGIs below $10k, 0.2% for AGIs $10k-25k, 0.1% for AGIs $25k-50k, 0.1% for AGIs $50k-75k, 0.1% for AGIs $75k-100k, 0.2% for AGIs over 100k)
Taxable dividends: $336 (reported on 4.5% of returns)
Here:
$336
State:
$5,735
(% of AGI for various income ranges: 0.3% for AGIs below $10k, 0.1% for AGIs $10k-25k, 0.0% for AGIs $25k-50k, 0.0% for AGIs $50k-75k, 0.2% for AGIs $75k-100k)
Net capital gain/loss: +$12,532 (reported on 2.4% of returns)
Here:
+$12,532
State:
+$23,694
(% of AGI for various income ranges: -0.3% for AGIs below $10k, -0.0% for AGIs $10k-25k, 0.0% for AGIs $25k-50k, 0.1% for AGIs $50k-75k, 27.6% for AGIs over 100k)
Profit/loss from business: +$5,985 (reported on 6.4% of returns)
Here:
+$5,985
State:
+$20,783
(% of AGI for various income ranges: 6.8% for AGIs below $10k, 3.1% for AGIs $10k-25k, 1.1% for AGIs $25k-50k, 0.0% for AGIs $50k-75k)
IRA payment deduction: $1,242 (reported on 1.0% of returns)
06607:
$1,242
Connecticut:
$3,216
Total itemized deductions: $13,954 (29% of AGI, reported on 12.9% of returns)
Here:
$13,954
State:
$24,919
Here:
29.0% of AGI
State:
18.6% of AGI
(% of AGI for various income ranges: 3.0% for AGIs below $10k, 3.8% for AGIs $10k-25k, 7.6% for AGIs $25k-50k, 10.3% for AGIs $50k-75k, 12.7% for AGIs $75k-100k, 16.5% for AGIs over 100k)
Charity contributions deductions: $3,218 (6% of AGI, reported on 11.4% of returns)
Here:
$3,218
State:
$3,762
Here:
6.5% of AGI
State:
2.7% of AGI
(% of AGI for various income ranges: 0.7% for AGIs $10k-25k, 1.4% for AGIs $25k-50k, 2.6% for AGIs $50k-75k, 2.5% for AGIs $75k-100k, 4.0% for AGIs over 100k)
Total tax: $2,736 (reported on 55.6% of returns)
06607:
$2,736
State:
$15,148
(% of AGI for various income ranges: 1.5% for AGIs below $10k, 2.9% for AGIs $10k-25k, 6.1% for AGIs $25k-50k, 9.7% for AGIs $50k-75k, 12.3% for AGIs $75k-100k, 13.9% for AGIs over 100k)
Earned income credit: $1,871 (reported on 38.8% of returns)
Here:
$1,871
State:
$1,570
Percentage of individuals using paid preparers for their 2004 taxes: 73.9%
Here:
74%
State:
59%
(% for various income ranges: 72.9% for AGIs below $10k, 76.3% for AGIs $10k-25k, 71.3% for AGIs $25k-50k, 73.6% for AGIs $50k-75k, 74.6% for AGIs $75k-100k, 85.2% for AGIs over 100k)
Household received Food Stamps/SNAP in the past 12 months: 774 Household did not receive Food Stamps/SNAP in the past 12 months: 1,737
Women who had a birth in the past 12 months: 175 (68 now married, 122 unmarried) Women who did not have a birth in the past 12 months: 1,592 (475 now married, 1,121 unmarried)
Housing units in zip code 06607 with a mortgage: 472 (116 second mortgage, 27 both second mortgage and home equity loan) Houses without a mortgage: 56
Median monthly owner costs for units with a mortgage: $1,802 Median monthly owner costs for units without a mortgage: $940
Residents with income below the poverty level in 2023:
This zip code:
33.2%
Whole state:
10.3%
Residents with income below 50% of the poverty level in 2023:
This zip code:
24.5%
Whole state:
4.9%
Median number of rooms in houses and condos:
Here:
4.8
State:
6.5
Median number of rooms in apartments:
Here:
4.4
State:
4.0
Notable locations in this zip code not listed on our city pages
Notable locations in zip code 06607: East End Yacht Club (A), East Breakwater Light (B), Newfield Branch Bridgeport Public Library (C), Bridgeport Fire Department Engine and Ladder 6 (D). Display/hide their locations on the map
Churches in zip code 06607 include: First Baptist Church (A), House of Prayer and Deliverance Church (B), Saint Joseph of Stratford Church (C). Display/hide their locations on the map
Parks in zip code 06607 include: Gateway Village Historic District (1), Johnson Oak Park (2), Newfield Park (3), Pleasure Beach Park (4), Water View Park (5). Display/hide their locations on the map
In group quarters: 45 (-1 institutionalized population)
Size of family households: 632 2-persons, 345 3-persons, 393 4-persons, 117 5-persons, 118 6-persons, 94 7-or-more-persons
Size of nonfamily households: 586 1-person, 196 2-persons, 28 3-persons
1,179 married couples with children.
897 single-parent households (63 men, 834 women).
51.0% of residents of 06607 zip code speak English at home.
44.0% of residents speak Spanish at home (58% very well, 15% well, 24% not well, 3% not at all).
2.1% of residents speak other Indo-European language at home (36% very well, 15% well, 37% not well, 12% not at all).
2.0% of residents speak Asian or Pacific Island language at home (100% not well).
1.6% of residents speak other language at home (93% very well, 7% well).
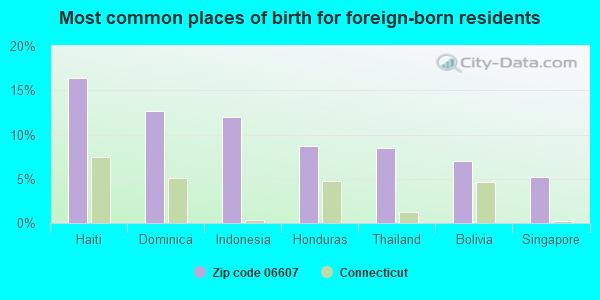
Foreign born population: 2,027 (26.2%) (37.8% of them are naturalized citizens)
Major facilities with environmental interests located in this zip code:
PARALLAX POWER COMPONENTS (902 CRESCENT AVENUE in BRIDGEPORT, CT)
AIR MAJOR (AIRS/AFS) (Integrated Compliance Information System) - ICIS-01-1998-0006, FORMAL ENFORCEMENT ACTION COMPLIANCE ACTIVITY (Tracking inspections of insecticide, fungicide, and rodenticide, and toxic substances) CRITERIA AND HAZARDOUS AIR POLLUTANT INVENTORY (Inventory of air pollution sources) HAZARDOUS WASTE BIENNIAL REPORTER (Resource Conservation and Recovery Act (tracking hazardous waste)) Large Quantity Generators, more that 1000 kg of hazardous waste/month (Resource Conservation and Recovery Act (tracking hazardous waste)) - notification TRI REPORTER (Tracking of toxic chemicals releasing facilities) Business SIC classification: ELECTRONIC CAPACITORS Business NAICS classification: ELECTRONIC CAPACITOR MANUFACTURING.; ELECTRONIC CAPACITOR MANUFACTURING. Organizations: PARALLAX POWER COMPONENTS LLC (CONTACT/OPERATOR)
Alternative names: MAGNETEK, MAGNETEK INC, PARALLAX POWER COMPONENTS L.L.C., UNIVERSAL MFG. CO.
CONNECTICUT ANODIZING & FINISHING CO. INC. (128 LOGAN ST in BRIDGEPORT, CT)
AIR MINOR (AIRS/AFS) National Pollutant Discharge Elimination System NON-MAJOR (Tracking pollutant discharge elimination systems) - permit HAZARDOUS WASTE BIENNIAL REPORTER (Resource Conservation and Recovery Act (tracking hazardous waste)) Large Quantity Generators, more that 1000 kg of hazardous waste/month (Resource Conservation and Recovery Act (tracking hazardous waste)) - notification TRI REPORTER (Tracking of toxic chemicals releasing facilities) - ICIS-, ENFORCEMENT/COMPLIANCE ACTIVITY, ICIS-01-2005-9045, Business SIC classification: ELECTROPLATING, PLATING, POLISHING, ANODIZING, AND COLORING; COATING, ENGRAVING, AND ALLIED SERVICES Business NAICS classification: ELECTROPLATING, PLATING, POLISHING, ANODIZING, AND COLORING. Organizations: VICTOR SINKO JR AND VICTOR (CONTACT/OPERATOR)
DUNBAR SCHOOL (445 UNION AVENUE in BRIDGEPORT, CT)
(Geographic Names Information System) (National Center for Education Statistics) - STATE ID-41 Organizations: BRIDGEPORT SCHOOL DISTRICT (SCHOOL DISTRICT)
HITCHCOCK TERMINAL SERVICES (1 SEAVIEW AVE in BRIDGEPORT, CT)
AIR MINOR (AIRS/AFS) (Resource Conservation and Recovery Act (tracking hazardous waste)) Business SIC classification: PETROLEUM BULK STATIONS AND TERMINALS Organizations: JOHN & RICHARD BROWN & EVELYN DUNCAN (CONTACT/OWNER)
Alternative names: HITCHCOCK GAS ENGINE CO
AMERICAN FABRICS CO (1069 CONNECTICUT AVE in BRIDGEPORT, CT)
AIR MINOR (AIRS/AFS) COMPLIANCE ACTIVITY (Tracking inspections of insecticide, fungicide, and rodenticide, and toxic substances) Business SIC classification: LACE AND WARP KNIT FABRIC MILLS; THREAD MILLS; TEXTILE GOODS
A NEW LOOK (955 CONNECTICUT AVENUE in BRIDGEPORT, CT)
(Resource Conservation and Recovery Act (tracking hazardous waste)) Organizations: STEVE SOBELL (CONTACT/OWNER)
Chrome Engineering (405 CENTRAL AVENUE in BRIDGEPORT, CT)
SUPERFUND (Superfund database) (Resource Conservation and Recovery Act (tracking hazardous waste)) Business NAICS classification: ELECTROPLATING, PLATING, POLISHING, ANODIZING, AND COLORING. Organizations: CHROME ENGINEERING INC (CONTACT/OWNER)
ELECTRO MANUFACTURING INCORPORATED (405 CENTRAL AVENUE in BRIDGEPORT, CT)
(Resource Conservation and Recovery Act (tracking hazardous waste)) Business NAICS classification: OTHER COMMERCIAL AND SERVICE INDUSTRY MACHINERY MANUFACTURING. Organizations: HARRY L SIMON (CONTACT/OWNER)
ARCHITECTURAL CULTURD MBL CNN# (480 BUNNEL ST in BRIDGEPORT, CT)
(Resource Conservation and Recovery Act (tracking hazardous waste)) Organizations: ARCHITECTURAL CULTURED MARBLE OF CT INC (CONTACT/OWNER)
Housing units lacking complete plumbing facilities: 1.9% Housing units lacking complete kitchen facilities: 1.2%
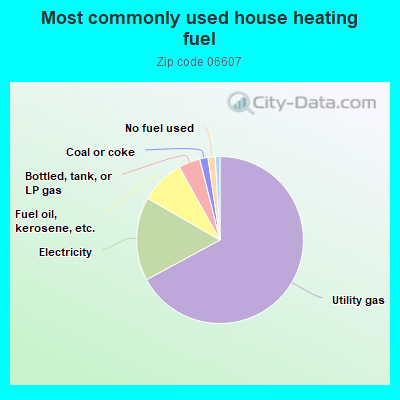
68.7%Utility gas
14.3%Fuel oil, kerosene, etc.
11.1%Electricity
3.2%Bottled, tank, or LP gas
1.7%Coal or coke
0.9%Other fuel
Population in 1990: 9,292.
Place of birth for U.S.-born residents:
This state: 3,633
Northeast: 681
South: 431
63% of the 06607 zip code residents lived in the same house 5 years ago. Out of people who lived in different houses, 84% lived in this county. Out of people who lived in different counties, 50% lived in Connecticut.
77% of the 06607 zip code residents lived in the same house 1 year ago. Out of people who lived in different houses, 70% moved from this county. Out of people who lived in different houses, 5% moved from different county within same state. Out of people who lived in different houses, 20% moved from different state. Out of people who lived in different houses, 5% moved from abroad.
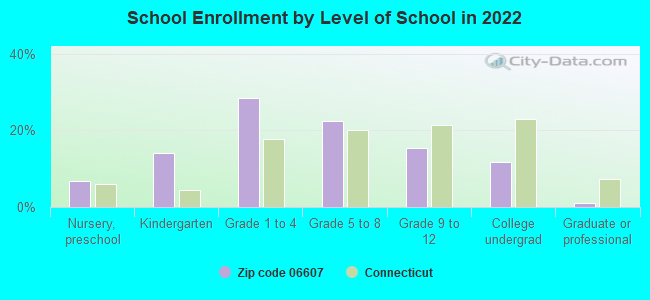
Private vs. public school enrollment:
Students in private schools in grades 1 to 8 (elementary and middle school): 46
Here:
4.2%
Connecticut:
8.6%
Students in private schools in grades 9 to 12 (high school): 22
Here:
6.8%
Connecticut:
10.3%
Students in private undergraduate colleges: 90
Here:
28.0%
Connecticut:
34.8%
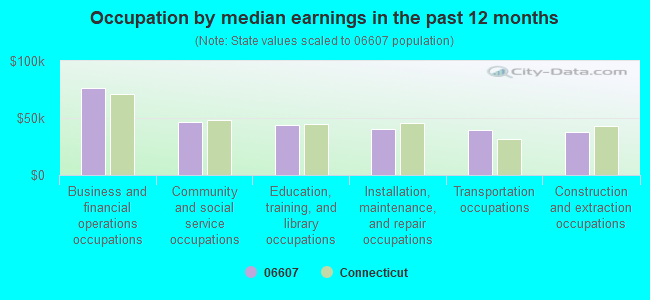
Occupation by median earnings in the past 12 months ($)
62,531Business and financial operations occupations
46,373Community and social service occupations
45,823Education, training, and library occupations
45,152Construction and extraction occupations
43,061Installation, maintenance, and repair occupations
39,723Transportation occupations
Companies with federal contracts located in this zip code (BRIDGEPORT, CT):
ROTAIR INDUSTRIES INC (964 CRESCENT AVE; small business) : $57,975,203 in 349 contractsfrom 1999 to 2006
Contracts for Aircraft Hydraulic, Vacuum, and De-icing System Components, Miscellaneous Communication Equipment, Aircraft Maintenance and Repair Shop Specialized Equipment, Miscellaneous Aircraft Accessories and Components, and moreby Army, Defense Logistics Agency, Air Force, Navy, and others Signed by year:2000: $506,614; 2001: $3,282,467; 2002: $4,537,751; 2003: $7,642,020; 2004: $884,342; 2005: $30,787,452; 2006: $10,309,202.
Biggest contracts:
$8,196,000 with Army for Aircraft Hydraulic, Vacuum, and De-icing System Components. Signed on 2005-03-22. Completion date: 2009-09-30.
$7,506,235 with Army for Miscellaneous Communication Equipment. Signed on 2005-09-12. Completion date: 2009-10-05.
$7,506,235, same as above.Signed on 2005-09-19. Completion date: 2009-10-05.
$6,313,016 with Army for Aircraft Maintenance and Repair Shop Specialized Equipment. Signed on 2006-01-31. Completion date: 2007-12-31.
IPPOLITO, JAMES & COMPANY OF C (1069 CONNECTICUT AVE; small business) : $1,072,619 in 36 contractsfrom 2003 to 2006
Contracts for Guns, 75 mm through 125 mm, Guns, over 150 mm through 200 mm, Specialized Ammunition Handling Servicing Equipment, Optical Sighting and Ranging Equipment, and moreby Army, Navy Signed by year:2000: $0; 2001: $0; 2002: $0; 2003: $152,232; 2004: $316,235; 2005: $170,650; 2006: $433,502.
Biggest contracts:
$175,500 with Army for Guns, 75 mm through 125 mm. Signed on 2006-04-03. Completion date: 2007-01-08.
$96,375 with Army for Guns, over 150 mm through 200 mm. Signed on 2003-12-08. Completion date: 2004-09-07.
$76,296 with Navy for Specialized Ammunition Handling Servicing Equipment. Signed on 2004-07-29. Completion date: 2005-01-27.
$75,677, same as above.Signed on 2006-06-26. Completion date: 2006-08-31.
MOORE TOOL COMPANY, INC (800 UNION AVE; small business) : $272,573 in 5 contractsfrom 2000 to 2006
Contracts for Maintenance, Repair and Rebuilding of Equipment -- Metalworking Machinery, Packing/Crating Services, Mathematical and Computer Sciences -- Advanced Development (R&D) by Air Force, NASA, Army, Navy, and others Signed by year:2000: $62,000; 2001: $0; 2002: $0; 2003: $0; 2004: -$1,262; 2005: $199,235; 2006: $12,600.
Biggest contracts:
$190,000 with Air Force for Maintenance, Repair and Rebuilding of Equipment -- Metalworking Machinery. Taking place in OK. Signed on 2005-12-28. Completion date: 2006-04-14.
$62,000 with NASA for Packing/Crating Services. Signed on 2000-01-15. Completion date: 2000-03-15.
$12,600 with Air Force for Maintenance, Repair and Rebuilding of Equipment -- Metalworking Machinery. Signed on 2006-03-31. Completion date: 2006-06-02.
$9,235 with Army for Maintenance, Repair and Rebuilding of Equipment -- Metalworking Machinery. Taking place in TX. Signed on 2005-10-21. Completion date: 2005-11-07.
$23,840 with Navy for Non-nuclear Ship Repair (West) Ship repair (including overhauls and conversions) performed on. non-nuclear propelled and nonpropelled ships west of the 108th meridian. Taking place in CA. Signed on 2005-05-23. Completion date: 2005-06-01.
CARBTROL CORPORATION (955 CONNECTICUT AVE; small business)
$18,395 with Navy for Water Purification Equipment. Signed on 2004-02-12. Completion date: 2004-03-26.
ALFA TEC MFG CO INC (220 5TH ST; small business)
$16,250 with Navy for Hand Tools, Nonedged, Nonpowered. Signed on 2006-06-26. Completion date: 2006-09-04.
Top industries in this zip code by the number of employees in 2005:
Other Services (except Public Administration): Religious Organizations (20-49 employees: 1 establishment, 10-19 employees: 2 establishments, 5-9 employees: 2 establishments, 1-4 employees: 4 establishments)
Construction: Water and Sewer Line and Related Structures Construction (50-99: 1)
Health Care and Social Assistance: Other Individual and Family Services (20-49: 2)
Health Care and Social Assistance: Outpatient Mental Health and Substance Abuse Centers (20-49: 1, 5-9: 1)
Health Care and Social Assistance: Child Day Care Services (20-49: 1, 1-4: 1)
People in group quarters in 2010:
32 people in other noninstitutional facilities
10 people in correctional residential facilities
9 people in residential treatment centers for adults
People in group quarters in 2000:
24 people in homes or halfway houses for drug/alcohol abuse
Fatal accident statistics in 2011:
Fatal accident count: 1
Vehicles involved in fatal accidents: 1
Fatal accidents caused by drunken drivers: 0
Fatalities: 1
Persons involved in fatal accidents: 1
Pedestrians involved in fatal accidents: 2
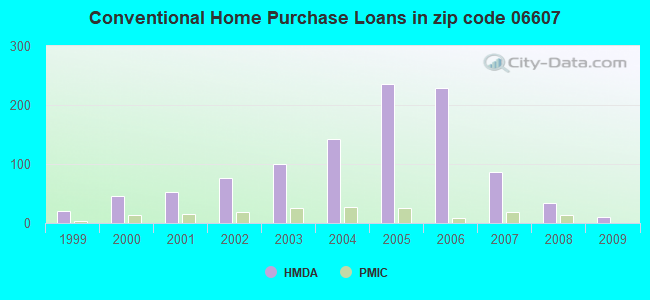
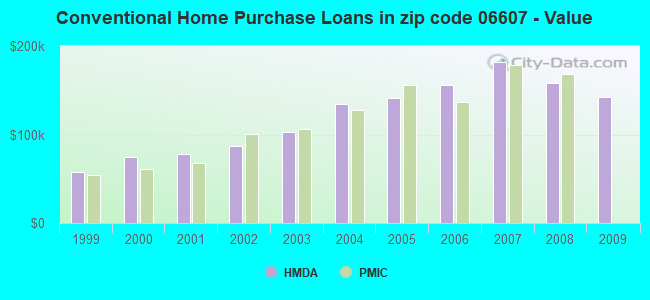
Home Mortgage Disclosure Act Aggregated Statistics For Year 2009 (Based on 4 partial tracts)
A) FHA, FSA/RHS & VA Home Purchase Loans
B) Conventional Home Purchase Loans
C) Refinancings
D) Home Improvement Loans
E) Loans on Dwellings For 5+ Families
F) Non-occupant Loans on < 5 Family Dwellings (A B C & D)
Number
Average Value
Number
Average Value
Number
Average Value
Number
Average Value
Number
Average Value
Number
Average Value
LOANS ORIGINATED
23
$137,516
11
$142,119
28
$174,977
3
$21,377
1
$833,980
17
$164,764
APPLICATIONS APPROVED, NOT ACCEPTED
4
$86,378
2
$116,160
4
$118,152
1
$8,730
1
$778,000
2
$116,160
APPLICATIONS DENIED
18
$126,319
7
$78,384
62
$155,856
18
$79,771
0
$0
14
$122,846
APPLICATIONS WITHDRAWN
9
$140,136
4
$46,558
9
$211,634
1
$95,310
0
$0
6
$135,630
FILES CLOSED FOR INCOMPLETENESS
4
$102,960
1
$78,630
4
$120,630
0
$0
0
$0
2
$78,035
Aggregated Statistics For Year 2008 (Based on 4 partial tracts)
A) FHA, FSA/RHS & VA Home Purchase Loans
B) Conventional Home Purchase Loans
C) Refinancings
D) Home Improvement Loans
E) Loans on Dwellings For 5+ Families
F) Non-occupant Loans on < 5 Family Dwellings (A B C & D)
Number
Average Value
Number
Average Value
Number
Average Value
Number
Average Value
Number
Average Value
Number
Average Value
LOANS ORIGINATED
13
$164,530
34
$158,513
38
$187,307
9
$66,662
6
$547,592
4
$158,268
APPLICATIONS APPROVED, NOT ACCEPTED
5
$165,450
7
$169,784
14
$188,845
4
$27,548
0
$0
5
$156,074
APPLICATIONS DENIED
15
$157,245
20
$155,546
114
$197,370
39
$78,511
0
$0
32
$185,562
APPLICATIONS WITHDRAWN
9
$146,277
11
$152,413
14
$170,650
1
$327,630
0
$0
4
$201,222
FILES CLOSED FOR INCOMPLETENESS
0
$0
4
$117,352
10
$141,184
0
$0
0
$0
6
$116,305
Aggregated Statistics For Year 2007 (Based on 4 partial tracts)
A) FHA, FSA/RHS & VA Home Purchase Loans
B) Conventional Home Purchase Loans
C) Refinancings
D) Home Improvement Loans
E) Loans on Dwellings For 5+ Families
F) Non-occupant Loans on < 5 Family Dwellings (A B C & D)
Number
Average Value
Number
Average Value
Number
Average Value
Number
Average Value
Number
Average Value
Number
Average Value
LOANS ORIGINATED
11
$230,833
86
$181,759
117
$175,714
30
$111,935
7
$315,769
43
$201,612
APPLICATIONS APPROVED, NOT ACCEPTED
0
$0
31
$163,538
36
$159,436
13
$89,790
2
$142,970
13
$177,956
APPLICATIONS DENIED
2
$310,360
92
$207,154
202
$174,135
25
$111,270
1
$314,110
61
$199,243
APPLICATIONS WITHDRAWN
0
$0
16
$164,529
85
$176,265
5
$259,918
1
$508,970
12
$203,675
FILES CLOSED FOR INCOMPLETENESS
0
$0
12
$231,972
15
$233,890
1
$178,710
0
$0
2
$110,205
Aggregated Statistics For Year 2006 (Based on 4 partial tracts)
A) FHA, FSA/RHS & VA Home Purchase Loans
B) Conventional Home Purchase Loans
C) Refinancings
D) Home Improvement Loans
E) Loans on Dwellings For 5+ Families
F) Non-occupant Loans on < 5 Family Dwellings (A B C & D)
G) Loans On Manufactured Home Dwelling (A B C & D)
Number
Average Value
Number
Average Value
Number
Average Value
Number
Average Value
Number
Average Value
Number
Average Value
Number
Average Value
LOANS ORIGINATED
9
$236,803
229
$156,014
226
$170,992
38
$85,026
13
$352,193
109
$192,834
0
$0
APPLICATIONS APPROVED, NOT ACCEPTED
0
$0
48
$157,016
44
$179,720
9
$106,816
1
$536,130
27
$172,750
1
$152,500
APPLICATIONS DENIED
0
$0
133
$160,748
214
$159,290
67
$77,356
1
$14,540
67
$186,170
0
$0
APPLICATIONS WITHDRAWN
5
$276,644
61
$152,579
126
$178,308
9
$111,756
1
$190,620
16
$167,720
2
$139,990
FILES CLOSED FOR INCOMPLETENESS
0
$0
18
$113,315
43
$177,147
0
$0
0
$0
9
$186,818
0
$0
Aggregated Statistics For Year 2005 (Based on 4 partial tracts)
A) FHA, FSA/RHS & VA Home Purchase Loans
B) Conventional Home Purchase Loans
C) Refinancings
D) Home Improvement Loans
E) Loans on Dwellings For 5+ Families
F) Non-occupant Loans on < 5 Family Dwellings (A B C & D)
G) Loans On Manufactured Home Dwelling (A B C & D)
Number
Average Value
Number
Average Value
Number
Average Value
Number
Average Value
Number
Average Value
Number
Average Value
Number
Average Value
LOANS ORIGINATED
11
$224,455
235
$141,189
218
$158,074
26
$70,967
10
$686,135
95
$158,858
0
$0
APPLICATIONS APPROVED, NOT ACCEPTED
1
$439,170
35
$127,793
46
$138,158
4
$30,008
3
$197,303
19
$142,587
1
$97,430
APPLICATIONS DENIED
4
$257,955
142
$135,770
188
$143,800
66
$46,801
0
$0
37
$152,280
0
$0
APPLICATIONS WITHDRAWN
6
$254,487
82
$140,251
121
$134,665
6
$113,495
4
$1,215,875
28
$134,147
1
$174,500
FILES CLOSED FOR INCOMPLETENESS
1
$359,190
22
$120,161
75
$175,055
6
$37,795
0
$0
16
$174,461
1
$33,360
Aggregated Statistics For Year 2004 (Based on 4 partial tracts)
A) FHA, FSA/RHS & VA Home Purchase Loans
B) Conventional Home Purchase Loans
C) Refinancings
D) Home Improvement Loans
E) Loans on Dwellings For 5+ Families
F) Non-occupant Loans on < 5 Family Dwellings (A B C & D)
G) Loans On Manufactured Home Dwelling (A B C & D)
Number
Average Value
Number
Average Value
Number
Average Value
Number
Average Value
Number
Average Value
Number
Average Value
Number
Average Value
LOANS ORIGINATED
26
$190,646
142
$133,997
214
$128,803
42
$101,394
7
$351,990
104
$142,263
0
$0
APPLICATIONS APPROVED, NOT ACCEPTED
1
$264,490
32
$131,518
47
$110,758
14
$45,316
1
$237,090
10
$114,583
1
$106,160
APPLICATIONS DENIED
6
$224,555
67
$106,529
178
$108,576
30
$45,060
0
$0
37
$124,590
4
$88,705
APPLICATIONS WITHDRAWN
1
$305,380
37
$139,285
89
$116,030
12
$102,549
0
$0
21
$112,820
0
$0
FILES CLOSED FOR INCOMPLETENESS
5
$210,640
9
$158,963
93
$128,928
6
$31,085
0
$0
11
$105,168
0
$0
Aggregated Statistics For Year 2003 (Based on 4 partial tracts)
A) FHA, FSA/RHS & VA Home Purchase Loans
B) Conventional Home Purchase Loans
C) Refinancings
D) Home Improvement Loans
E) Loans on Dwellings For 5+ Families
F) Non-occupant Loans on < 5 Family Dwellings (A B C & D)
Number
Average Value
Number
Average Value
Number
Average Value
Number
Average Value
Number
Average Value
Number
Average Value
LOANS ORIGINATED
29
$161,727
100
$102,507
182
$97,962
16
$29,114
7
$182,160
59
$100,535
APPLICATIONS APPROVED, NOT ACCEPTED
0
$0
33
$101,773
61
$100,236
1
$7,150
3
$112,457
21
$113,821
APPLICATIONS DENIED
5
$141,062
70
$93,543
232
$92,683
28
$29,157
0
$0
52
$96,348
APPLICATIONS WITHDRAWN
4
$100,072
18
$113,165
141
$100,894
7
$45,146
0
$0
30
$113,395
FILES CLOSED FOR INCOMPLETENESS
4
$174,872
9
$91,702
11
$118,536
0
$0
0
$0
6
$110,653
Aggregated Statistics For Year 2002 (Based on 4 partial tracts)
A) FHA, FSA/RHS & VA Home Purchase Loans
B) Conventional Home Purchase Loans
C) Refinancings
D) Home Improvement Loans
E) Loans on Dwellings For 5+ Families
F) Non-occupant Loans on < 5 Family Dwellings (A B C & D)
Number
Average Value
Number
Average Value
Number
Average Value
Number
Average Value
Number
Average Value
Number
Average Value
LOANS ORIGINATED
24
$127,490
76
$87,359
122
$84,091
11
$24,658
3
$154,560
47
$92,628
APPLICATIONS APPROVED, NOT ACCEPTED
6
$109,950
17
$66,624
42
$80,391
9
$40,679
0
$0
14
$72,332
APPLICATIONS DENIED
7
$135,399
28
$76,790
133
$85,141
38
$18,763
0
$0
19
$72,494
APPLICATIONS WITHDRAWN
4
$64,993
16
$89,016
92
$92,126
11
$34,217
0
$0
17
$84,710
FILES CLOSED FOR INCOMPLETENESS
0
$0
9
$68,956
22
$97,558
0
$0
0
$0
2
$101,270
Aggregated Statistics For Year 2001 (Based on 4 partial tracts)
A) FHA, FSA/RHS & VA Home Purchase Loans
B) Conventional Home Purchase Loans
C) Refinancings
D) Home Improvement Loans
E) Loans on Dwellings For 5+ Families
F) Non-occupant Loans on < 5 Family Dwellings (A B C & D)
Number
Average Value
Number
Average Value
Number
Average Value
Number
Average Value
Number
Average Value
Number
Average Value
LOANS ORIGINATED
27
$109,553
53
$77,606
81
$79,953
22
$17,695
3
$99,370
29
$70,178
APPLICATIONS APPROVED, NOT ACCEPTED
1
$111,970
22
$63,742
37
$78,734
9
$20,527
0
$0
20
$61,072
APPLICATIONS DENIED
7
$93,390
53
$67,438
149
$67,919
72
$23,758
0
$0
24
$55,412
APPLICATIONS WITHDRAWN
4
$115,425
5
$61,182
54
$83,227
25
$24,010
0
$0
5
$61,220
FILES CLOSED FOR INCOMPLETENESS
1
$165,780
6
$48,473
27
$78,530
1
$7,270
0
$0
3
$21,030
Aggregated Statistics For Year 2000 (Based on 4 partial tracts)
A) FHA, FSA/RHS & VA Home Purchase Loans
B) Conventional Home Purchase Loans
C) Refinancings
D) Home Improvement Loans
E) Loans on Dwellings For 5+ Families
F) Non-occupant Loans on < 5 Family Dwellings (A B C & D)
Number
Average Value
Number
Average Value
Number
Average Value
Number
Average Value
Number
Average Value
Number
Average Value
LOANS ORIGINATED
23
$82,518
46
$74,568
75
$63,841
58
$4,439
7
$137,486
21
$73,150
APPLICATIONS APPROVED, NOT ACCEPTED
2
$70,890
7
$64,376
27
$62,910
18
$40,537
0
$0
12
$66,813
APPLICATIONS DENIED
6
$94,857
46
$80,127
142
$53,887
42
$21,768
2
$136,415
20
$70,635
APPLICATIONS WITHDRAWN
0
$0
4
$60,462
58
$51,199
5
$28,906
0
$0
6
$56,405
FILES CLOSED FOR INCOMPLETENESS
0
$0
1
$65,440
34
$74,377
0
$0
0
$0
0
$0
Aggregated Statistics For Year 1999 (Based on 2 partial tracts)
A) FHA, FSA/RHS & VA Home Purchase Loans
B) Conventional Home Purchase Loans
C) Refinancings
D) Home Improvement Loans
E) Loans on Dwellings For 5+ Families
F) Non-occupant Loans on < 5 Family Dwellings (A B C & D)
Detailed PMIC statistics for the following Tracts:0743.00
, 0744.00
2002 - 2018 National Fire Incident Reporting System (NFIRS) incidents
Based on the data from the years 2002 - 2018 the average number of fires per year is 36. The highest number of fires - 75 took place in 2002, and the least - 9 in 2003. The data has a dropping trend.
When looking into fire subcategories, the most incidents belonged to: Mobile Property/Vehicle Fires (37.9%), and Outside Fires (27.7%).
Fire incident types reported to NFIRS in Zip Code 06607


 Nearest zip codes: 06608, 06615, 06610, 06604, 06605, 06606.


 Based on the data from the years 2002 - 2018 the average number of fires per year is 36. The highest number of fires - 75 took place in 2002, and the least - 9 in 2003. The data has a dropping trend.
 When looking into fire subcategories, the most incidents belonged to: Mobile Property/Vehicle Fires (37.9%), and Outside Fires (27.7%).