Open In App

How to Make a Line Graph in Excel – Easy Tutorial

Last Updated: 19 Dec, 2024

A

Summarize
Comments
Improve
Suggest changes
Like Article
Like
Share
Report
News Follow

Line graphs are a highly valuable tool in Excel, helping users analyze trends and patterns effectively over time. They are widely used for time-series analysis in Excel, allowing a clear visual representation of changes in data. In this guide, you’ll learn how to create a line graph in Excel, including steps to build single or multiple line graphs, explore different Excel chart types, and customize line charts to suit your needs. Whether you’re preparing a presentation or conducting in-depth analysis, this Excel line chart tutorial will help you turn raw data into insightful visuals.

Disclaimer: Ensure your data is accurate and well-organized to achieve precise and reliable visualizations.

How to  Make a Line Graph in Excel

How to Create a Line Chart in Excel

What is a Line Chart in Excel

A line chart also known as a line graph, is a visual representation that shows a series of data points connected by a straight line. In a line chart, the independent values such as time intervals or categories, are plotted on the horizontal x-axis, while the dependent values, like prices or sales, are plotted on the vertical y-axis. Values that are represented below the x-axis are the negative values. Line graphs are widely used in various fields to track trends and patterns in data over time.

How to Create a Line Chart in Excel

If you’re wondering how to generate a line graph in Excel, follow these simple steps. You can also customize line charts for better visualization:

Step 1: Prepare Your Data

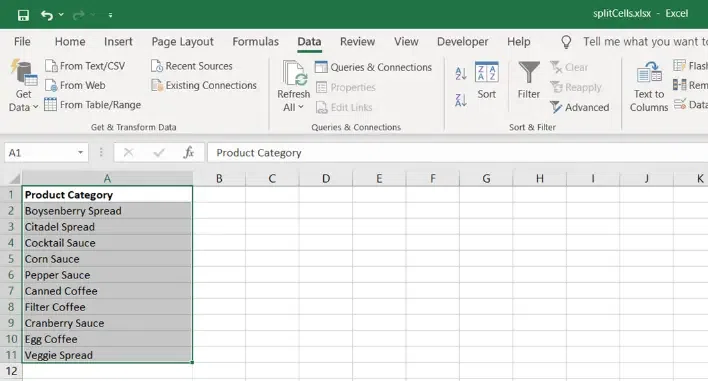
In this step, we will be inserting random sales data for three different courses for the last five years in our Excel sheet. Below is the screenshot of the random sales data that we are going to use for our line chart.

How to  Make a Line Graph in Excel

Prepare Your Data

Step 2: Insert the Line Chart

  • Highlight the Data
  • Go to the Insert tab on the Excel ribbon.
  • In the Charts group, click on the Insert Line or Area Chart dropdown.
  • Choose the 2-D Line Chart option.

Excel will now create a Line Chart that plots:

  • Years on the X-axis.
  • DSA, Java, and AI/ML as separate lines on the Y-axis.

Once we select our desired line chart (Here, Line with Markers). Excel will automatically plot a graph for our dataset.

How to  Make a Line Graph in Excel

Select Data>> Go to Insert Tab >>Select the 2-D Line >> Chart

In the above graph, we can easily visualize the different courses that are sold. In the next step, we will try to format our graph.

Step 3: Customize and Format the Line Chart

We will try to format our graph according to our needs in this step.

Add Chart Title

  • Click on the default Chart Title at the top of the chart.
  • Type a meaningful title like “Line Chart – Courses Sales
How to  Make a Line Graph in Excel

Change the Graph Title

Add Axis Titles

  • Click on the chart to activate the Chart Elements button (the “+” icon on the chart).
  • Check the Axis Titles box.

Add titles:

  • Horizontal Axis: “Year”
  • Vertical Axis: “Number of Students (or Values)”
How to  Make a Line Graph in Excel

Click on the “Plus” icon

Format Lines and Markers

  • Click on any line in the chart (e.g., the DSA line).
  • Right-click and select Format Data Series.
  • Customize the line color, width, and marker style:
  • Example: Use a solid line with circles as markers for better visibility.
  • Repeat this for the other lines (Java and AI/ML).
How to  Make a Line Graph in Excel

Format Lines and Markers

Add Data Labels

  • Right-click on one of the lines in the chart.
  • Select Add Data Labels.
  • The values will appear at each point on the line.
  • Customize the data label position if needed.

Customize the Legend

  • Click on the legend (showing DSA, Java, AI/ML) to select it.
  • Move the legend to your preferred location (e.g., top, bottom, or right of the chart).
How to  Make a Line Graph in Excel

Add Data Labels and Customize the Legend

Step 4: Finalize the Chart

  • Resize the Chart: Click and drag the edges to resize the chart as needed.
  • Format the Gridlines: Right-click on the gridlines and choose Format Gridlines to adjust their style or remove them.
  • Save the Workbook: Press Ctrl + S to save the Excel file with the chart.

How to Make a Multiple Line Graph in Excel

A Multiple Line Graph (also called a multi-line chart) allows you to compare trends or changes across multiple datasets over time or categories. Here’s a step-by-step guide to create one in Excel:

Step 1: Organize Your Data

Prepare your data in a table format where:

  • The first column contains categories (e.g., years, months, or labels).
  • The following columns contain values for each dataset.
Year Series 1 Series 2 Series 3
2017 30 15 5
2018 50 60 10
2019 67 35 25
2020 40 65 30
2021 85 80 25
2022 100 90 40

Step 2: Select Your Data

  • Highlight the entire data range, including headers (e.g., A1:B7).
  • This will create a Single series Line Chart in Excel

Step 3: Insert the Single Line Graph

  • Go to the Insert tab on the Excel ribbon.
  • In the Charts group, click the Insert Line or Area Chart dropdown.
  • Choose Line Chart (2-D Line).
How to  Make a Line Graph in Excel

Select the Data>> Go to Insert Tab >> Select the 2-D Chart

Step 4: Add Another Data Series

  • Right-click on the chart and select “Select Data“.
  • In the Select Data Source window, click “Add” to add a new data series.
  • For the Series Name, click on the header in cell C2 (e.g., “Sales“).
  • For the Series Values, select the data range C3:C14.
  • Click OK to confirm.
  • Click OK again to close the Select Data Source window.
How to  Make a Line Graph in Excel

Right Click >> Choose “Select Data”>>Click on “Add”>> Add “Series Name” and “Series Value”>>Click ok

Note: Similarly you can add multiple lines.

Step 5: Customize and Format the Line Chart

1: Add Chart Title and Axis Titles

  • Click on the Chart Title and type a meaningful title, such as “Trends Over Time”.

To add axis titles:

  • Click the chart.
  • Use the Chart Elements button (+) and check Axis Titles.
  • Rename the X-axis as “Years” and the Y-axis as “Values“.
How to  Make a Line Graph in Excel

Click on the Add Button >>Check the “Axis Titles” and ” Chart Title” Checkbox >> Add the Chart Title and Axis Title

2: Format the Lines

  • Click on any line to select it.
  • Right-click and choose Format Data Series.

Customize:

  • Line Color: Choose a unique color for each series.
  • Line Style: Adjust line thickness or make it dashed.
  • Markers: Add data markers to highlight points on each line.
How to  Make a Line Graph in Excel

Right Click >> Select “Format Data Series”” >> Customize

3: Add a Legend

Excel automatically adds a legend (e.g., Series 1, Series 2, etc.). To customize it:

  • Click on the legend.
  • Move it to the desired position (top, bottom, right, or left).

4: Add Data Labels (Optional)

  • Right-click on a line and select Add Data Labels.
  • Adjust label positions for better clarity.
How to  Make a Line Graph in Excel

Right Click >> Select ” Add Data Labels”>> Preview Results

Step 6: Compare Multiple Lines

Once your chart is created, you can easily see:

  • How each dataset changes over time (trends).
  • Differences or similarities between multiple lines.
  • Peaks, dips, or intersections between datasets.

Step 7: Save and Update the Graph

  • Save your Excel workbook.
  • If your data changes, the chart will automatically update.
How to  Make a Line Graph in Excel

Preview the Multiple Lines Chart

Different Types of Line Charts in Excel

When creating line graphs, there are several Excel chart types to choose from depending on your data and analysis needs:

1. Stacked Line

It aims to demonstrate how different elements of a whole alter over time. The top line in this graph represents the sum of all the lines below it because the lines in this graph are cumulative, which means that each new data series is added to the first.

How to  Make a Line Graph in Excel

Stacked Line

2. 100% Stacked Line

It resembles a stacked line graph, but the y-axis displays percentages rather than absolute numbers. The top line, which spans the top of the chart directly, indicates a sum of 100% at all times. This kind is usually used to illustrate the gradual contribution of a part to the whole.

How to  Make a Line Graph in Excel

100% Stacked Line

3. Line with Markers

The line graph with markers at each data point in the marked form. Stacked Line and 100% Stacked Line graphs are also available in marked forms. Use this chart type when there are few data points.

How to  Make a Line Graph in Excel

Line with Markers

4. 100% Stacked Line with Markers

Use this chart type to show the percentage contribution to a whole over time or categories. Show the change to the percentage that each value contributes over time.

How to  Make a Line Graph in Excel

Stacked Line with Markers

5. 3-D Line

An alternative to the traditional line graph in three dimensions.

How to  Make a Line Graph in Excel

3-D Line

Advanced Tips for Line Graphs in Excel

When you make a line graph in Excel, these advanced tips can help you improve your chart:

1. Adding a Secondary Axis

  • Use a secondary axis to display two datasets with different scales on the same chart.
  • For example, plot sales numbers on the primary axis and profit percentages on the secondary axis for better comparison.
  • In Excel, right-click on a data series, choose Format Data Series, and select Secondary Axis.

2. Using Combo Charts (Line + Bar)

  • Combine line graphs with bar charts to show trends alongside categorical data.
  • For example, use a bar chart to show revenue by product and overlay a line graph for profit trends.
  • Select Insert Combo Chart in Excel and customize the chart for a dynamic presentation.

3. Handling Large Datasets with Filters

  • Apply filters to focus on specific subsets of data in large datasets.
  • For example, filter by date range, region, or category to analyze specific trends without overcrowding the chart.
  • In Excel, use slicers or the filter dropdown to display only the relevant data points.

These tips help you enhance line graphs for complex datasets and more effective visual storytelling.

Also Read:

Conclusion

Creating a line graph in Excel is an essential skill for presenting data trends and patterns effectively. With the steps outlined in this guide, you can easily make a line graph in Excel, customize it, and even compare multiple datasets for a deeper understanding of your data. Use these tools to elevate your analysis and create compelling visuals that communicate your insights clearly and professionally.

FAQs about Line Graphs in Excel

How to handle missing data in a line graph?

  • Ignore Missing Data: Most tools automatically skip blank cells, leaving gaps in the line graph.
  • Interpolate Missing Data: Use linear interpolation to estimate missing values and create a smoother line. For example, in Excel, select Select Data > Hidden and Empty Cells > Connect Data Points with a Line.
  • Fill with Averages: Replace missing data with the average of adjacent values if it’s suitable for your dataset.

Best practices for formatting line charts

  • Use Clear Labels: Add meaningful axis titles and a descriptive chart title for better understanding.
  • Choose Contrasting Colors: Use distinct colors for multiple lines to differentiate data series.
  • Add Data Markers: Highlight specific data points with markers to make trends more visible.
  • Limit Gridlines: Reduce gridlines to declutter the chart and improve readability.

Troubleshooting issues like overlapping labels or uneven scales.

  • Overlapping Labels: Adjust the label position or use abbreviations to prevent labels from overlapping.
  • Uneven Scales: Ensure both axes have appropriate and consistent scales to avoid distortion. Use a secondary axis if needed.
  • Cluttered Data Series: Reduce the number of series or split data into multiple charts for clarity.

These strategies help you handle missing data, format line graphs effectively, and resolve common issues.

How do I create a Line chart in Excel?

Follow the below steps to create a line chart in Excel:

  • Prepare your data.
  • Select the dataset you want to use for the line chart.
  • Go to the “Insert” tab on the Excel ribbon.
  • Click on the “line” chart icon in the “Charts” group.
  • Choose the line chart type that best fits your need.

How to make line graph in excel with 2 variables?

Follow the steps given below:

  • Prepare Your Data
  • Select Data
  • Go to the Insert tab
  • Insert Line Chart
  • Choose the desired line chart style

How to create line graph in excel with x and y axis?

Here are some steps to create line graph in Excel:

  • Prepare Your Data
  • Select Data
  • Go to the Insert tab
  • Insert Scatter Plot
  • Select the Scatter with Straight Lines

How to make line graph in excel with 3 variables?

Steps to make a line graph in Excel:

  • Select Data
  • Insert Line Chart
  • Go to the Insert tab.
  • In the Charts group, click on the Line chart icon.
  • Choose the Line with Markers

How do I make a line up chart in Excel?

Follow the steps given below:

  • Select Data
  • Insert Line Chart
  • Go to the Insert tab
  • In the Charts group, click on the Line chart icon.
  • Select the desired line chart


A

News
Improve
Discuss
Do you want to advertise with us?Click here to know more

How to Start a New Line in Excel Cell: 4 Easy Methods

article_img
How to Insert a Line Break in a Cell- Quick Steps Click on Cell >> Press F2Press "Alt+ Enter" to Create a new Line Press Enter Starting a new line within a cell in Excel can be incredibly useful when you want to enter multiple pieces of information or data in a single cell without cluttering your spreadsheet. Whether you're organizing addresses, adding comments, or formatting text for readability, knowing how to create a new line within a cell helps you maintain a clean and structured look. Fortunately, Excel makes this easy to do. In this guide, you'll learn how to start a new line in an Excel cell using a simple keyboard shortcut or a formula, allowing you to customize your spreadsheet with ease.Table of ContentMethod 1: Using Keyboard Shortcut in ExcelMethod 2: How to Create a New line in Excel cell Using FormulaMethod 3: Multiple Line Breaks in ExcelMethod 4: Line Break After a Specific Character in ExcelMethod 1: Using Keyboard Shortcut in ExcelTo start a new line of text or add spacing between lines or paragraphs of text in a worksheet cell, press Alt+Enter to insert a line break. To quickly insert a line break in Excel on both Windows and Mac, you can use the following
Read More

How to Make a Histogram in Excel: 3 Easy Methods

article_img
A histogram is a vital tool for analyzing and visualizing the distribution of data, allowing users to easily identify patterns, trends, and outliers. Commonly used in statistics and data-driven decision-making, histograms help present data frequency in a structured and readable format. Excel provides multiple ways to create histograms, catering to different versions and user preferences. In this guide, you’ll learn how to make a histogram in Excel using three methods: the built-in Histogram Chart for Excel 2016 and later, the Data Analysis ToolPak for earlier versions, and creating a Frequency Chart in Excel using formulas.Disclaimer: Always double-check your data for accuracy to ensure precise and reliable results.How to Make a Histogram in ExcelMethod 1: Using the Built-in Histogram Chart (Excel 2016 and Later)For Excel 2016 and later versions, a Histogram Chart is available as a built-in feature. Follow the below step by step process to make a histogram chart in excel: Step 1: Prepare Your DataOrganize your data in a single column. For example: Here we have Test scores of a Student:Prepare your DataStep 2: Insert a HistogramSelect the data range (e.g., A2:A8).Go to the Insert ta
Read More

How to Sort Data in Excel: Easy Step by Step Process

article_img
Sorting data in Excel is a fundamental skill that can greatly enhance your data analysis capabilities. Whether you're dealing with a simple list or a complex dataset, knowing how to sort data in Excel can help you organize and make sense of your information quickly and efficiently. In this article, you will learn the easy, step-by-step process of sorting data in Excel. From basic alphabetical or numerical sorting to more advanced multi-level sorts, you'll learn how to manage your data like a pro. Know how to organize your data in Excel by using some sorting techniques. Microsoft Excel offers two widely used features: sorting and filtering. They are frequently used in data analysis to set up, organize, and subset your data according to particular criteria. You will discover how to sort data in Excel in this article. You will also get knowledge of data filtering. How to Sort Data in ExcelTable of Content What is Sorting in ExcelHow to Sort a Single Column in ExcelHow to Sort Multiple Columns in ExcelHow to Apply a Custom Sort in Excel Types of Filter in ExcelHow to Apply Filter in ExcelHow to Apply an Advanced Filter in ExcelWhat is Sorting in ExcelSorting is the process of arranging
Read More

How to Compare Two Columns in Excel : Easy and Quick Methods

article_img
In the world of data analysis, knowing how to compare two columns in Excel is a fundamental skill that can unveil valuable insights and ensure data accuracy. If you're looking to spot differences, find duplicates, or identify similarities, mastering Excel's compare columns functionality is key. This article will walk you through effective methods on how to compare two columns in Excel, exploring techniques to streamline your workflow and make informed decisions. By the end, you'll be equipped with the knowledge to confidently manage and analyze your data using Excel compare two columns features. Let's explore and learn the power of data comparison!How to Compare Two Columns in ExcelTable of ContentWhy Compare Two Columns in ExcelHow to Compare Two Columns in ExcelCompare Two Columns in Excel using Conditional FormattingHighlight Unique DataCompare Two Columns in Excel Using Equals OperatorCompare Two Columns in Excel Using the IF Condition Using the Lookup Function to Compare Two ColumnsWhy Compare Two Columns in ExcelExcel is a versatile tool that stores data and manipulates data for better decision-making. We are required to compare Excel columns data for the following reasons:To
Read More

Data Table In Excel : One Variable and Two Variable (In Easy Steps )

article_img
Data Table is a tool present in Microsoft Excel as one of the three What-If Analysis tools namely Scenario Manager, Goal Seek, and Data Table. It is a tool, that allows one to try out various input values for the formulas present in their sheet and see how changes in those values affect the output in the cells. To apply a data table tool anywhere in the Excel sheet, there must be a table and the formula whose values will be replaced by the row and column values must be kept in the top-left corner or the top-right corner of the table according to the variables used to replace the formula values. In this article, we will learn about data tables in Excel. What is a Data Table in ExcelExcel data tables shine brightest when dealing with intricate formulas that rely on multiple variables. With the ability to manipulate diverse inputs and witness the ripple effect on formula outcomes, data tables provide an invaluable avenue for comparative analysis and insightful decision-making. Currently, two variations of data tables grace Excel's repertoire: the one-variable data table and the two-variable data table. While the two-variable data table is restricted to a maximum of two distinct input
Read More

How to Hide and Unhide Columns in Excel 2024: Easy Steps and Tips

article_img
Want to master Excel and improve your data management skills? Knowing how to hide and unhide columns in Excel can streamline your workflow, especially when dealing with large datasets. Instead of deleting columns, hiding them allows you to focus on essential information. In this 2024 article, you will learn effective methods for hiding and unhiding columns in Excel, ensuring a cleaner and more organized spreadsheet.We'll cover everything from hiding columns in Excel 2016 to using formulas to manage your spreadsheet's visibility. By the end of this article, you'll be able to easily hide and unhide columns in Excel, making your workflow smoother and more organized. Let's get started and explore the various methods and shortcuts to hide columns in Excel.How to Hide Columns in ExcelTable of ContentHow to Hide the Column in ExcelWhat is Hiding a Column in Excel How to Hide a Column Using Ribbon in ExcelHow to Hide Columns in Excel using Shortcut How to Hide Columns Using a Context Menu in ExcelHow to Hide Excel Columns by Setting the Column Width as ZeroHow to Hide Column Using VBA CodeHow to Hide Unused Column in Excel How to Hide and Show Columns using the Group FeatureHow to Hide Col
Read More

K

How to Calculate Standard Error in Excel: Easy Steps, Formula, and Tips for Accurate Data Analysis

article_img
How to Calculate Standard Error in Excel - Quick StepsEnter your dataCreate labelsCalculate your standard deviationCount your itemsCalculate standard errorStandard error is essential for assessing how closely a sample's mean matches the overall population mean. In this article you will learn how to calculate standard error in Excel using both formulas and step-by-step instructions.  Calculate Standard Error in ExcelWhat is Standard ErrorStandard error calculation provides valuable insight into the likely deviation of the mean value of a sample dataset from the overall mean value of the larger data population under evaluation. For instance, consider a scenario where a company aims to gauge customer satisfaction ratings within its customer base. By collecting ratings from a representative subset of their client, the standard error calculation aids the company in assessing the extent to which the sampled information aligns with the broader sentiment of all customers. Why is the Standard Error Calculation ImportantThe Standard error emerges as a crucial calculation, particularly when working with sample data sets, as it furnishes a reliable estimation of their credibility. As the numbe
Read More

How to Wrap Text in Excel Automatically and Manually - 3 Easy Methods

article_img
How to Wrap Around Text in Excel - Quick StepsSelect the cell(s).Go to Home >> Click Wrap Text.Adjust the row height if needed.Wrapping text in Excel is a simple yet essential feature that ensures your data is displayed clearly and fits neatly within each cell. When working with long entries, such as names, addresses, or descriptions, text may overflow into adjacent cells or become hidden. This guide will show you how to wrap text in Excel, making your data more readable and organized. Whether you're managing reports, creating tables, or formatting large datasets, wrapping text improves presentation and helps maintain a professional look.How to Wrap Text in ExcelTable of ContentWhat Is Text Wrapping in Excel?How to Wrap Text in Excel Automatically (Windows & Mac)Method 1: Wrap Text Using the Ribbon (Wrap Text Button)Method 2: Wrap Text Using Format CellsMethod 3: Using the Keyboard ShortcutHow to Wrap Text in Excel Manually with Line BreaksHow to Unwrap Text in Excel using Right ClickTroubleshooting Common Text Wrapping IssuesWhat Is Text Wrapping in ExcelText wrapping in Excel adjusts the way text is displayed in a cell. Instead of text overflowing into adjacent cells or
Read More

How to Separate First and Last Name in Excel: 3 Easy Methods

article_img
How to Split Names in Excel - Quick StepsOpen MS Excel>>Select the ColumnOpen Text to Columns WizardChoose Delimited>>Select DelimitersSet Destination>>Adjust ColumnsManaging datasets with full names in a single column can be challenging when you need the names split into first and last names. Knowing how to separate first and last names in Excel is a practical skill that improves data clarity and organization. Whether you're working on a mailing list, a contact sheet, or any dataset requiring distinct name columns, Excel offers straightforward solutions.Using tools like Text to Columns, Flash Fill, Excel formulas or formulas like LEFT, RIGHT, and SEARCH, you can effortlessly break names into individual components. This guide will walk you through step-by-step methods to split names in Excel, saving time and ensuring your data is well-structured and ready for analysis.Table of ContentHow to Separate Names in Excel: 3 MethodsMethod 1: How to Split Names in Excel Using Text to ColumnsMethod 2: How to Separate First and Last Name in Excel with FormulasMethod 3: How to Split Names in Excel Using Flash FillHow to Split Full Name into First, Last, and Middle Name in Exc
Read More

How to Split Cells in Excel: Easy Methods Explained

article_img
How to Separate a Cell in Excel- Quick StepsOpen MS Excel>>Select Data Go to the Data tab>>Click Text to Columns.Choose Delimited and click NextSplitting cells in Excel can simplify data management, especially when dealing with combined information in a single column or cell. Whether you’re separating names, dates, or other data points, understanding how to split cells in Excel is essential for better organization and clarity.This guide will show you how to break up cells in Excel using different methods. By the end, you'll know how to split cells horizontally, divide a cell in Excel for better Management.Table of ContentWhat Does Splitting Cells in Excel MeanHow to Split Cells in Excel Using Text to Columns - 2 MethodsHow to Split Cells in Excel Using FormulasHow to Split Cells in Excel Using Flash Fill - 2 MethodsHow to Split Cells in Excel Using Power QueryHow to Divide a Cell in Excel in Excel Using Text Functions in ExcelCommon Use Cases for Splitting Cells in ExcelWhat Does Splitting Cells in Excel MeanSplitting a cell in Excel involves dividing its content into multiple cells or columns. For instance, you can:Separate first and last names.Break product categories
Read More
three90RightbarBannerImg