


Types of Infographics and When to Use Them
There’s no one-size-fits-all infographic out there.
Infographics are of various different types, and if you want yours to actually be effective, you need to pick a type that’s aligned with your purpose and nature of content.
Generally, infographics are used for one or more of the following reasons:
- Illustrating data: Present statistics, facts and figures visually using charts, graphs and other graphic tools.
- Simplifying a complex subject: Explain difficult concepts with the help of illustrations and visual cues.
- Drawing a comparison: Visually compare two or more products, services, features, brands or concepts.
- Creating awareness: Spread word about an important cause or create brand awareness and visibility.
- Summarizing longer content: Repurpose long videos, blog posts and reports into bite-sized infographics.
Once you’re sure about what you need an infographic for, you can move on to selecting the right type of infographic for your needs.
Here are the different types of infographics available in Visme.
- Statistical infographics
- Informational infographics
- Process infographics
- Timeline infographics
- Anatomical infographics
- Hierarchical infographics
- List infographics
- Comparison infographics
- Location-based infographics
- Visual resume infographics
Statistical Infographics
Statistical infographics make use of typography, charts and graphs to present research, facts and figures in a visual way. This helps make data look more interesting and easier to digest than a bunch of plain numbers or tables.
A statistical infographic can either focus on a single research or data visualization, or use a mix of different visualizations to present various facts and figures about a topic.
The infographic template below displays data about the global penetration of social media platforms in the form of a colorful bar graph.

This type of statistical infographic is ideal for using as part of a report or presentation, or for visualizing a statistic mentioned in your blog post.
Now, take a look at the infographic template below. Instead of a single visualization, it focuses on giving a statistical overview of a more general topic—technology in education.

This type of statistical infographics ideal for educational purposes and creating awareness about a subject or cause.
Statistical infographics are usually less text-heavy and more data-focused.
Informational Infographics
Informational infographics use a mix of text and visual elements to explain or simplify a topic, or guide readers through a series of steps.
The example below explains the concept of blockchain with the help of a colorful informational infographic that’s easy to follow and fun to read.
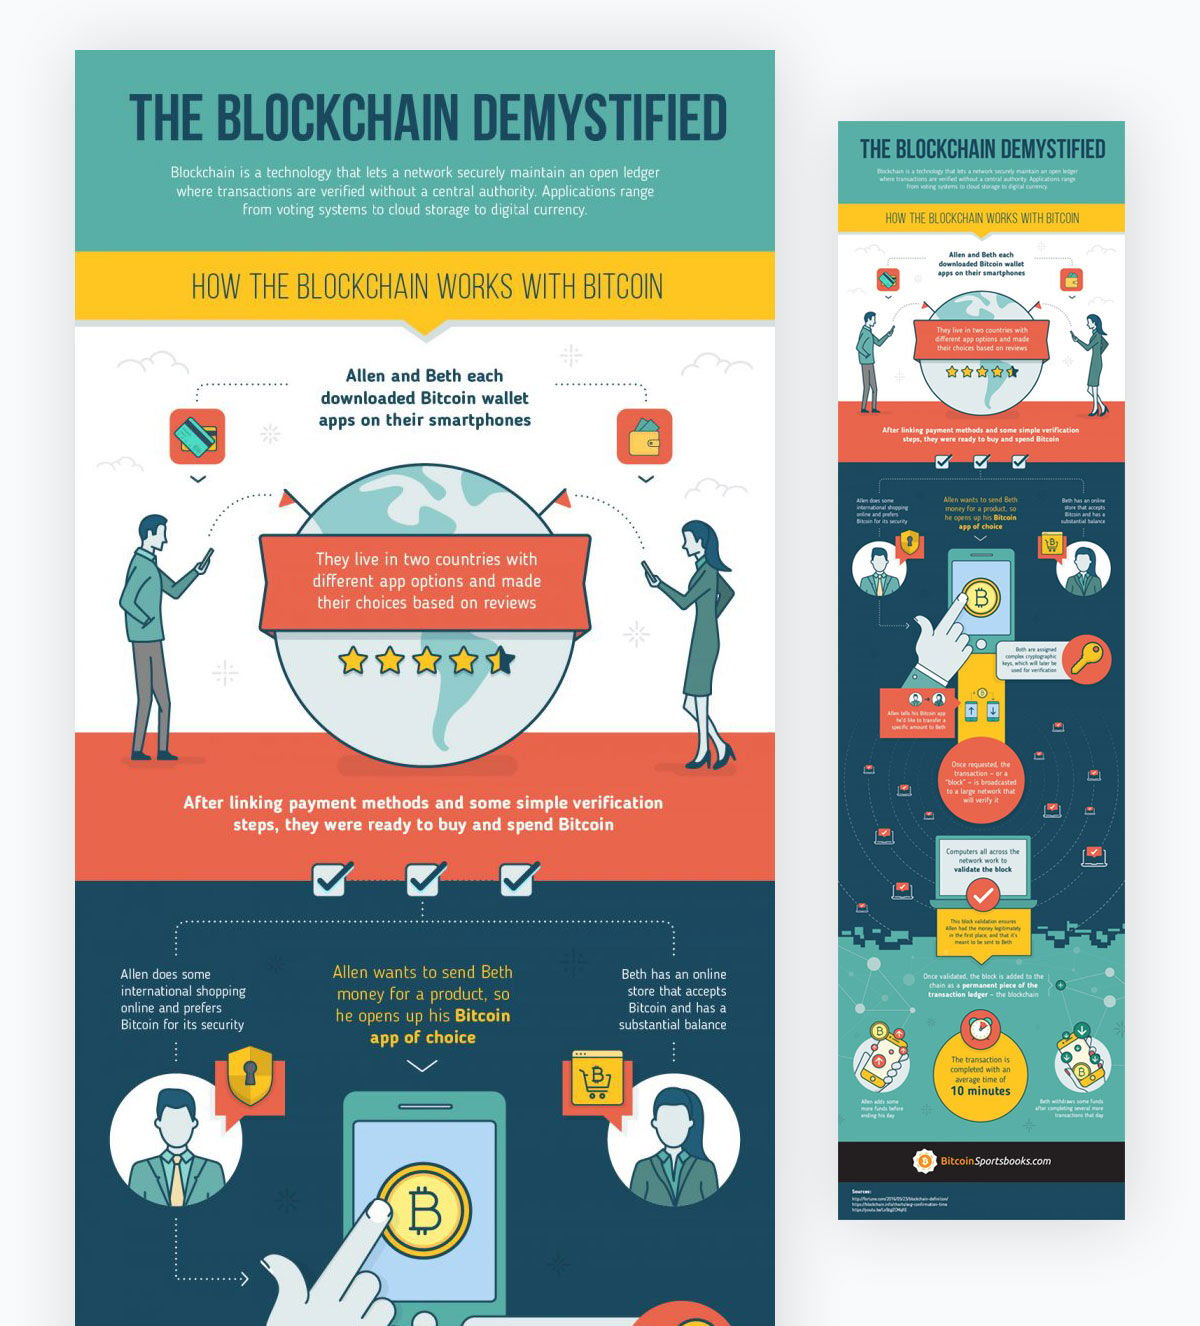
These are usually text-heavy infographics and can be used to summarize long blog posts and videos. You can also share an informational infographic as a stand-alone content piece.
Check out this informational infographic template to use for your own content.

Informational infographics usually follow a visual narrative to tell a story. This includes leveraging font size and styling, imagery and the placement of different objects to lead the reader’s eye from one point to the next in the order of importance or position.
Process Infographics
Process infographics usually make use of flowcharts, diagrams and even timelines to guide readers through a series of steps or to help simplify the decision-making process.
Here’s an example of a process infographic template.

These types of infographics are useful for giving instructions to employees, explaining a step-by-step process to customers or for light-hearted, humorous purposes.
Timeline Infographics
Timeline infographics are useful for presenting information in a chronological order. Whether you’re visually showcasing your brand history or showing how something has evolved over time, a timeline infographic can help you out.
Here’s a timeline infographic template from Visme to get you started.

You can use a timeline infographic to creatively display your brand story on your website’s About page.
This type of infographic can also help you with project management purposes, such as creating project timelines.
Anatomical Infographics
Looking to break down and explain the different parts of something? An anatomical infographic can help you do just that.
This type of infographic has a labelled diagram format, which can help you highlight and explain ingredients, product parts, characteristics, personality traits and more.
Check out this anatomical infographic template as an example.

Hierarchical Infographics
This type of infographic usually features a pyramid to help you display different levels of information.
Take a look at the hierarchical infographic template below.

If you want to organize information by different levels, such as by priority, importance or difficulty, a hierarchical infographic like the one above is a good way to go.
List Infographics
List infographics help you summarize and present list-based information. This could be a list of items, factors and even steps to do something.
Here’s a list infographic template you can customize.

You can use this type of infographic to sum up a how-to or listicle blog post. List infographics are also likely to get shared as they’re usually straightforward and fun to read.
Comparison Infographics
Comparison infographics are useful for comparing multiple objects, people, concepts, products or brands. Visually comparing ideas can help illustrate similarities and differences.
Here’s an example of a comparison infographic template.
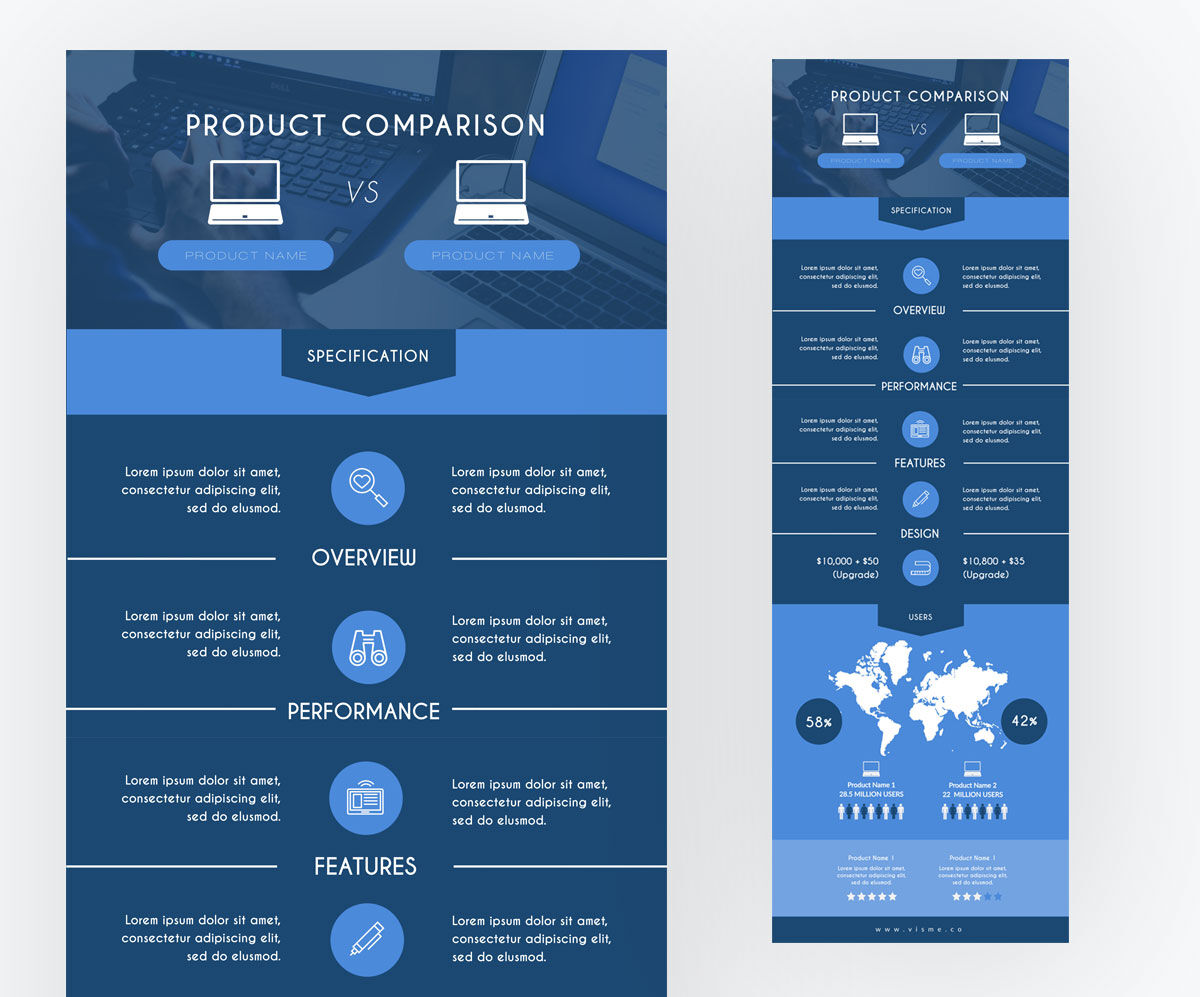
These types of infographics usually have a multi-column layout, which is useful for comparing and contrasting two different topics side by side.
Another type of comparison infographic is a comparison chart, which compares and contrasts multiple features or brands in the form of a visual table.
Here’s a comparison chart template for that purpose.

Location-Based Infographics
If you want to showcase geographic information in a visual form, a location-based or map infographic is a great option.
Here’s a map infographic template from Visme.

Map or location infographics can be used to display local, national or global data and statistics. You can color-code the map to highlight different regions, and even make them interactive by adding hover effects, links and animations.
Location-based infographics make excellent visuals to add to your blog posts, reports and presentations. You can also use them as solo graphics and share on social media to drive engagement and traffic.
Visual Resume Infographics
Employers receive hundreds of resumes at a time and only a handful of them manage to stand out from the pile. If you want to take your resume to the next level, consider creating a visual resume infographic.
Check out this creative resume infographic template.

Resume infographics offer a refreshingly new take on the standard infographic style. They make use of visualizations like radials, progress bars, icons and arrows to illustrate skills, interests, experiences and more.
Tips to Make Your Infographic Stand Out
Now that you know the different types of infographics you can use and how to create one for yourself, here are some tips to help you take your visuals to the next level.
1. Be original and creative.
There are millions of infographics and visuals floating on the internet. If you want to get yours noticed, create something unique and different.
Do some research before creating your infographic. Find out what kind of topics will appeal to your audience and what questions they might have unanswered. Search to see if there are any existing interesting visuals or infographics on the topic.
If there’s a topic that’s already been covered before but you still want to create an infographic about it, make sure you create it with a fresh, new angle.
2. Know your audience.
The most important piece of homework you need to do before creating an infographic is to find out if it will actually work with your audience.
Understand the kind of topics they like and what type of design will appeal to them. You also need to know the kind of tone that works with your audience, as you’ll use that to craft compelling copy for your infographic.
You also need to know the social channels that are most used by your audience so you can create an infographic that is optimized to perform best on those specific platforms.
3. Use appealing colors and fonts.
Color psychology is real. And marketers all over the world rely on it to create effective designs that actually bring results.
If your infographic doesn’t use colors and fonts that resonate with your audience or bring your content to life, it might fail to stand out.
Check out these resources put together by experts to help you choose the best colors and fonts for your infographic designs.
Additionally, check out this video on color psychology in marketing to help guide your designs.
4. Illustrate text with icons and graphics.
Too much text can make an infographic look boring and uninteresting.
Make sure you use as many visuals and as less text as you can. One way to do that is to replace or supplement subheadings, labels, captions and other text in your infographic with icons, illustrations or images.
5. Establish visual hierarchy.
Visual hierarchy is all about organizing information on your design according to the level of importance or order so that the reader’s eye naturally goes from one section to the next.
Establishing visual hierarchy makes your infographic design look cleaner, attractive and more professional instead of cluttered with all kinds of information.
6. Make it interactive.
If you really want to make your infographic stand out, consider taking it a step further from just being a static image.
If you’re using a tool like Visme, you can add animations to your infographic, insert clickable links and buttons, and even add hover effects.
•••
Originally published at visme.co/blog/what-is-an-infographic.
(0) comments
Welcome to the discussion.
Log In
Keep it Clean. Please avoid obscene, vulgar, lewd, racist or sexually-oriented language.
PLEASE TURN OFF YOUR CAPS LOCK.
Don't Threaten. Threats of harming another person will not be tolerated.
Be Truthful. Don't knowingly lie about anyone or anything.
Be Nice. No racism, sexism or any sort of -ism that is degrading to another person.
Be Proactive. Use the 'Report' link on each comment to let us know of abusive posts.
Share with Us. We'd love to hear eyewitness accounts, the history behind an article.