Chapter 10-DATA ANALYSIS & PRESENTATION
- 3. Data Analysis The purpose To answer the research questions and to help determine the trends and relationships among the variables.
- 4. Steps in Data Analysis Before Data Collection, the researcher should accomplish the following: Determine the method of data analysis Determine how to process the data Consult a statistician Prepare dummy tables After Data Collection: Process the data Prepare tables and graphs Analyze and interpret findings Consult again the statistician Prepare for editing Prepare for presentation
- 5. Classification of Descriptive Analysis Kinds of Data Analysis 1. Descriptive Analysis 2. Inferential Analysis
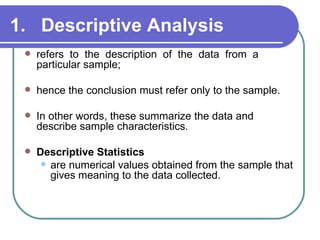
- 6. 1. Descriptive Analysis refers to the description of the data from a particular sample; hence the conclusion must refer only to the sample. In other words, these summarize the data and describe sample characteristics. Descriptive Statistics are numerical values obtained from the sample that gives meaning to the data collected.
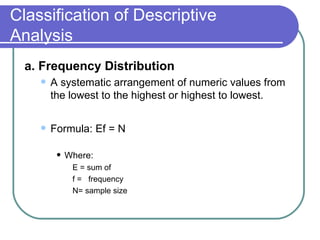
- 7. Classification of Descriptive Analysis a. Frequency Distribution A systematic arrangement of numeric values from the lowest to the highest or highest to lowest. Formula: Ef = N Where: E = sum of f = frequency N= sample size
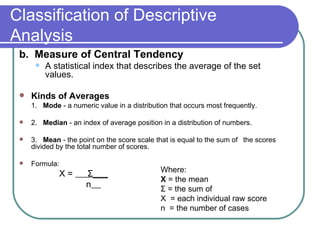
- 8. Classification of Descriptive Analysis b. Measure of Central Tendency A statistical index that describes the average of the set values. Kinds of Averages 1. Mode - a numeric value in a distribution that occurs most frequently. 2. Median - an index of average position in a distribution of numbers. 3. Mean - the point on the score scale that is equal to the sum of the scores divided by the total number of scores. Formula: Where: X= Σ___ X = the mean n Σ = the sum of X = each individual raw score n = the number of cases
- 9. Classification of Descriptive Analysis c. Measure of Variability Statistics that concern the degree to which the scores in a distribution are different from or similar to each other.
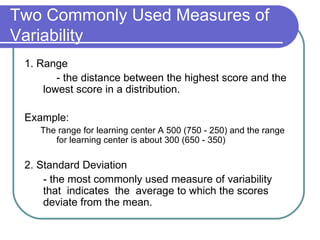
- 10. Two Commonly Used Measures of Variability 1. Range - the distance between the highest score and the lowest score in a distribution. Example: The range for learning center A 500 (750 - 250) and the range for learning center is about 300 (650 - 350) 2. Standard Deviation - the most commonly used measure of variability that indicates the average to which the scores deviate from the mean.
- 11. Classification of Descriptive Analysis d. Bivariate Descriptive Statistics Derived from the simultaneous analysis of two variables to examine the relationships between the variables. Two Commonly Used Bivariate Descriptive Analysis 5. Contingency tables - is essentially a two-dimensional frequency distribution in which the frequencies of two variables are cross-tabulated. Correlation - the most common method of describing the relationship between two measures
- 12. Classification of Descriptive Analysis Kinds of Data Analysis 1. Descriptive Analysis 2. Inferential Analysis
- 13. 2. Inferential Analysis The use of statistical tests, either to test for significant relationships among variables or to find statistical support for the hypotheses. Inferential Statistics are numerical values that enable the researcher to draw conclusion about a population based on the characteristics of a population sample. This is based on the laws of probability.
- 14. Level of Significance An important factor in determining the representativeness of the sample population and the degree to which the chance affects the findings. The level of significance is a numerical value selected by the researcher before data collection to indicate the probability of erroneous findings being accepted as true. This value is represented typically as 0.01 or 0.05. (Massey,1991)
- 15. Uses of Inferential Analysis Cited some statistical test for inferential analysis. 1. t-test is used to examine the difference between the means of two independent groups. 2. Analysis of Variance (ANOVA) - is used to test the significance of differences between means of two or more groups. 3. Chi-square - this is used to test hypotheses about the proportion of elements that fall into various cells of a contingency table.
- 16. Hypothesis - Testing Procedures The outcome of the study perhaps may retain, revise or reject the hypothesis and this determines the acceptability of hypotheses and the theory from which it was derived.
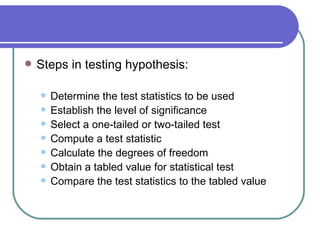
- 17. Steps in testing hypothesis: Determine the test statistics to be used Establish the level of significance Select a one-tailed or two-tailed test Compute a test statistic Calculate the degrees of freedom Obtain a tabled value for statistical test Compare the test statistics to the tabled value
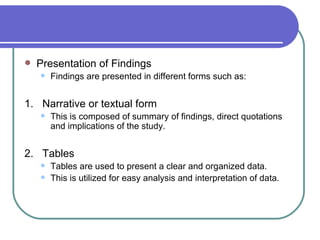
- 18. Presentation of Findings Findings are presented in different forms such as: 1. Narrative or textual form This is composed of summary of findings, direct quotations and implications of the study. 2. Tables Tables are used to present a clear and organized data. This is utilized for easy analysis and interpretation of data.
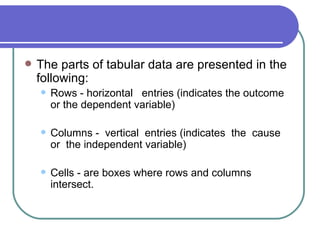
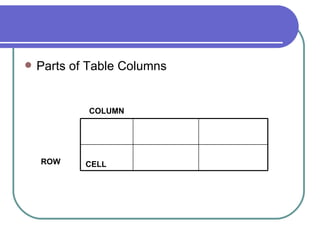
- 19. The parts of tabular data are presented in the following: Rows - horizontal entries (indicates the outcome or the dependent variable) Columns - vertical entries (indicates the cause or the independent variable) Cells - are boxes where rows and columns intersect.
- 20. Parts of Table Columns COLUMN ROW CELL
- 21. Interpretation of Data After analysis of data and the appropriate statistical procedure, the next chapter of the research paper is to present the interpretation of the data, which is the final step of research process. The three areas: Summary of Findings Conclusions Recommendations
- 22. Summary of Findings This portion summarizes the result of data analysis from chapter 4. The best thing is to review the stated problem and tie up with the result of your data analysis.
- 23. Conclusions A conclusion is drawn from the summary of findings. focuses on the answers to the problem including the outcome of the hypotheses whether it is rejected or accepted.
- 24. Recommendations This is based on the result of the conclusions The main goal is geared toward improvement or development
- 26. Writing the Final Output The researcher should know not only the parts in research process but also the forms and style in writing the research proposal and the research paper
- 27. The Format of Writing the Study
- 28. Preliminary Pages 1. Title page/ Title of the Study - is a phrase that describes the research study. - It should not be too long or too short as well as too vague and general. 2. Acknowledgement Page - is a section wherein the researcher expresses his deep gratitude for those persons who assisted and helped him to make the study a successful one.
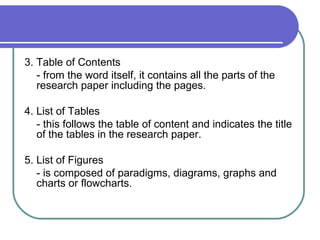
- 29. 3. Table of Contents - from the word itself, it contains all the parts of the research paper including the pages. 4. List of Tables - this follows the table of content and indicates the title of the tables in the research paper. 5. List of Figures - is composed of paradigms, diagrams, graphs and charts or flowcharts.
- 30. Main Body
- 31. Main Body Chapter I. Introduction This section refers to: “What this study is all about” or “What makes the researcher interested in doing the study”. Purpose: to introduce the reader to the subject matter. The introduction serves as a springboard for the statement of the problem as stated by Dr. Barrientos-Tan.
- 32. Chapter II. Review of Related Literature Chapter III. Research Design and Methodology Chapter IV. Analysis and Interpretation of Data Chapter V. Summary, Conclusions, and Recommendations Supplementary Pages Bibliography Appendix
- 33. Sample of Table of Contents
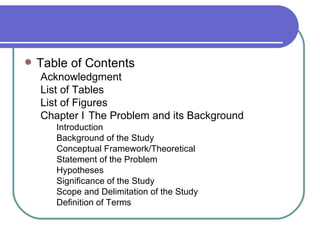
- 34. Table of Contents Acknowledgment List of Tables List of Figures Chapter I The Problem and its Background Introduction Background of the Study Conceptual Framework/Theoretical Statement of the Problem Hypotheses Significance of the Study Scope and Delimitation of the Study Definition of Terms
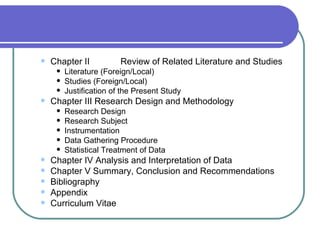
- 35. Chapter II Review of Related Literature and Studies Literature (Foreign/Local) Studies (Foreign/Local) Justification of the Present Study Chapter III Research Design and Methodology Research Design Research Subject Instrumentation Data Gathering Procedure Statistical Treatment of Data Chapter IV Analysis and Interpretation of Data Chapter V Summary, Conclusion and Recommendations Bibliography Appendix Curriculum Vitae
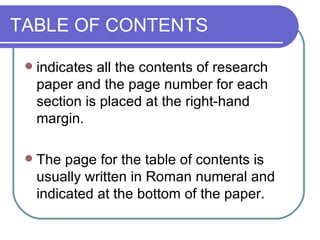
- 37. TABLE OF CONTENTS indicates all the contents of research paper and the page number for each section is placed at the right-hand margin. The page for the table of contents is usually written in Roman numeral and indicated at the bottom of the paper.
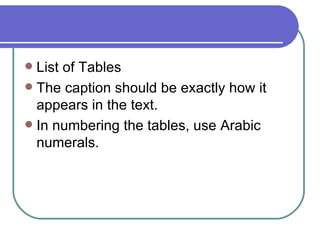
- 38. List of Tables The caption should be exactly how it appears in the text. In numbering the tables, use Arabic numerals.

