SlideShare a Scribd company logo
Quantitative evaluation
Examine procedures in which data from 2 or more logs will be used to evaluate
for the amount of hydrocarbon compared to pore water within a formation
The proportion of pore space occupied by water is known as water saturation (Sw)
e.g. if 65% of the formation is occupied by water and 35% by hydrocarbons the
water saturation is 0.65 (percent water saturation is 65%)
Definition of the formation factor (F)
F = Ro/Rw
Where
Ro is the resistivity of the total formation (rock matrix + fluids) saturated with
water
Rw is the resistivity of the water itself
 F= Formation factor is used to help calculate water
saturation – function of porosity
 Definition F = Ro/Rw
 Definition for water saturation Sw = √RO/RT
RO = RT (for a 100% saturated sand)
 Substituting in the equations and rewriting for water
saturation we have:
RO = F. RW
SW = F. RW/RT
QUANTITATIVE EVALUATION FOR HYDROCARBON POTENTIAL
Archie equation (1942) … F = a/φm
a = constant which is lithology dependent
m = empirically derived constant
φ = porosity (e.g. 30% enter as 0.30)
Actual values for a and m are lithology and region dependent
Some examples
F = 0.82/φ uncompacted sands
F = 1/ φ2 compacted formations, chalk
F = 1/ φ2.2 compacted clastic and oolitic rocks
F = 0.62/ φ2.15 recrystallized carbonates (sucrosic texture)
F = 1.13/φ1.73 generic value for large number of samples
Analysis for Hydrocarbon Potential
Definition: Rwa = Rt / F
 Rwa = apparent water resistivity
 Rt is measured from a deeply focused induction log
 F is calculated from the formula using log measured porosity
value
 est Sw (%) = √Rw/ Rwax 100
 Rw = Rwa of a 100% water saturated formation. Measure from
an obvious water-bearing formation
 Rwa Analysis Rwa/ Rw
 Ratio Rwa < 2 No oil production
 Ratio Rwa > 4 Oil production expected
Hydrocarbon potential
Locations SP
mv
Resistivity ohm-m φ F Rwa est
Sw%
Rwa
analysis
Rwa/Rw
Hydrocarbon
Production
y/n
sh dp dp in.
1
2
3
4
5
Use F = 0.83 / φ2
READINGS AND CALCULATIONS
Levels SP
mv
Resistivity ohm-m φ F Rwa est Sw
%
Rwa/
Rw
Prod.
y/n
sh dp dp in.
1 - 62 0.26 0.2 0.20 .30 9 0.02 100 1 N
2 - 45 7.50 6.0 6.70 .06 228 0.03 82 1.5 N
3 - 49 1.50 0.5 0.50 .23 16 0.03 82 1.5 N
4 - 18 1.08 0.8 0.98 .13 49 0.02 100 1 N
5 - 15 0.94 0.8 0.98 .26 12 0.08 50 4 Y

More Related Content

geophysical_logs4.ppt

  • 1. Quantitative evaluation Examine procedures in which data from 2 or more logs will be used to evaluate for the amount of hydrocarbon compared to pore water within a formation The proportion of pore space occupied by water is known as water saturation (Sw) e.g. if 65% of the formation is occupied by water and 35% by hydrocarbons the water saturation is 0.65 (percent water saturation is 65%) Definition of the formation factor (F) F = Ro/Rw Where Ro is the resistivity of the total formation (rock matrix + fluids) saturated with water Rw is the resistivity of the water itself
  • 2.  F= Formation factor is used to help calculate water saturation – function of porosity  Definition F = Ro/Rw  Definition for water saturation Sw = √RO/RT RO = RT (for a 100% saturated sand)  Substituting in the equations and rewriting for water saturation we have: RO = F. RW SW = F. RW/RT
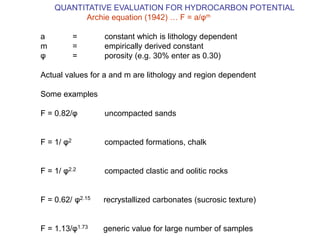
  • 3. QUANTITATIVE EVALUATION FOR HYDROCARBON POTENTIAL Archie equation (1942) … F = a/φm a = constant which is lithology dependent m = empirically derived constant φ = porosity (e.g. 30% enter as 0.30) Actual values for a and m are lithology and region dependent Some examples F = 0.82/φ uncompacted sands F = 1/ φ2 compacted formations, chalk F = 1/ φ2.2 compacted clastic and oolitic rocks F = 0.62/ φ2.15 recrystallized carbonates (sucrosic texture) F = 1.13/φ1.73 generic value for large number of samples
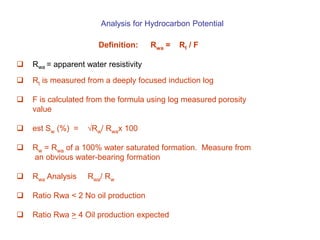
  • 4. Analysis for Hydrocarbon Potential Definition: Rwa = Rt / F  Rwa = apparent water resistivity  Rt is measured from a deeply focused induction log  F is calculated from the formula using log measured porosity value  est Sw (%) = √Rw/ Rwax 100  Rw = Rwa of a 100% water saturated formation. Measure from an obvious water-bearing formation  Rwa Analysis Rwa/ Rw  Ratio Rwa < 2 No oil production  Ratio Rwa > 4 Oil production expected
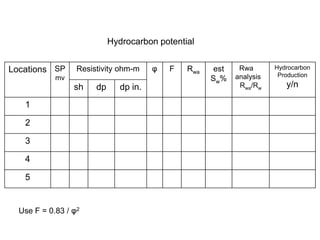
  • 5. Hydrocarbon potential Locations SP mv Resistivity ohm-m φ F Rwa est Sw% Rwa analysis Rwa/Rw Hydrocarbon Production y/n sh dp dp in. 1 2 3 4 5 Use F = 0.83 / φ2
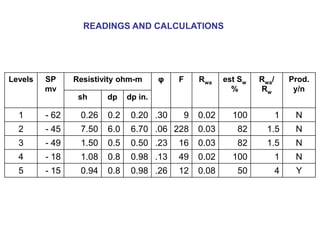
  • 6. READINGS AND CALCULATIONS Levels SP mv Resistivity ohm-m φ F Rwa est Sw % Rwa/ Rw Prod. y/n sh dp dp in. 1 - 62 0.26 0.2 0.20 .30 9 0.02 100 1 N 2 - 45 7.50 6.0 6.70 .06 228 0.03 82 1.5 N 3 - 49 1.50 0.5 0.50 .23 16 0.03 82 1.5 N 4 - 18 1.08 0.8 0.98 .13 49 0.02 100 1 N 5 - 15 0.94 0.8 0.98 .26 12 0.08 50 4 Y