You also want an ePaper? Increase the reach of your titles
YUMPU automatically turns print PDFs into web optimized ePapers that Google loves.
<strong>Genetics</strong> STAO 2010<br />
<strong>Gummy</strong> <strong>Bear</strong> <strong>Genetics</strong><br />
Purpose<br />
To determine the genotypes of parents by counting and sorting the phenotype ratios of their offspring.<br />
Procedure:<br />
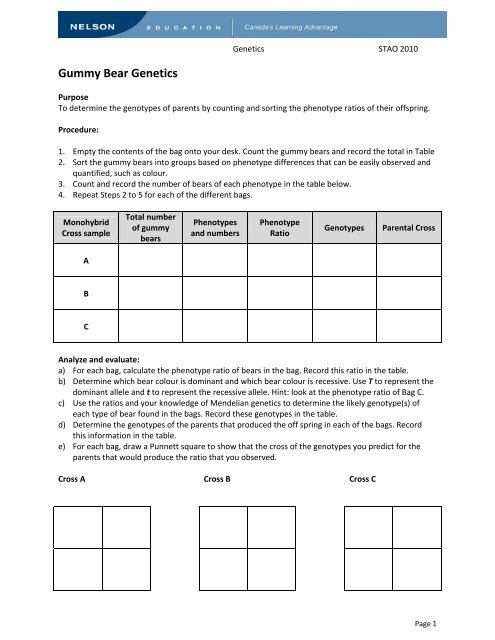
1. Empty the contents of the bag onto your desk. Count the gummy bears and record the total in Table<br />
2. Sort the gummy bears into groups based on phenotype differences that can be easily observed and<br />
quantified, such as colour.<br />
3. Count and record the number of bears of each phenotype in the table below.<br />
4. Repeat Steps 2 to 5 for each of the different bags.<br />
Monohybrid<br />
Cross sample<br />
Total number<br />
of gummy<br />
bears<br />
Phenotypes<br />
and numbers<br />
Phenotype<br />
Ratio<br />
Genotypes<br />
Parental Cross<br />
A<br />
B<br />
C<br />
Analyze and evaluate:<br />
a) For each bag, calculate the phenotype ratio of bears in the bag. Record this ratio in the table.<br />
b) Determine which bear colour is dominant and which bear colour is recessive. Use T to represent the<br />
dominant allele and t to represent the recessive allele. Hint: look at the phenotype ratio of Bag C.<br />
c) Use the ratios and your knowledge of Mendelian genetics to determine the likely genotype(s) of<br />
each type of bear found in the bags. Record these genotypes in the table.<br />
d) Determine the genotypes of the parents that produced the off spring in each of the bags. Record<br />
this information in the table.<br />
e) For each bag, draw a Punnett square to show that the cross of the genotypes you predict for the<br />
parents that would produce the ratio that you observed.<br />
Cross A Cross B Cross C<br />
Page 1
My Genetic Profile Worksheet<br />
Human genetic characteristics and phenotypes<br />
Characteristic Dominant Phenotype Recessive Phenotype<br />
Dimples Present (D) Absent (d)<br />
Hairline Widow’s peak (W) Straight (w)<br />
Tongue rolling Roller (R) Non‐roller (r)<br />
Thumb placement with folded<br />
hands<br />
Left thumb on top (P)<br />
Right thumb on top (p)<br />
Parent #1 Parent #2<br />
Phenotype Genotype Phenotype Genotype<br />
Dimpled Dd Dimpled Dd<br />
Straight<br />
Widow’s peak<br />
ww<br />
hairline<br />
Ww<br />
Tongue roller Rr Non‐ roller rr<br />
Right thumb<br />
on top<br />
pp<br />
Child (F1)<br />
Phenotype Genotype<br />
Right thumb<br />
on top<br />
pp<br />
Grandchild (F2)<br />
Phenotype Genotype<br />
Pedigree Chart for a SINGLE characteristic<br />
Parent #1<br />
____<br />
Parent #2<br />
_____<br />
Parent #3<br />
_____<br />
Parent #4<br />
_____<br />
Child #1<br />
_____<br />
Child #2<br />
_____<br />
Grandchild<br />
_____<br />
Page 2
What are the chances?<br />
In this investigation you will model a cross between two heterozygous individuals. You will then<br />
determine the genotype and phenotype ratios of your model F1 generation. In addition, you will<br />
investigate the role that sample size and probability play in producing a 25:50:25 ratio in the F1<br />
generation.<br />
Equipment and Materials: two small opaque bags containing 40 beads each (20 blue beads and 20 red<br />
beads)<br />
Note: Red beads are the dominant allele, R, for red flowered, and the blue beads are the recessive allele,<br />
r, for blue flowered. Together, the two pouches represent the parent generation.<br />
Without looking, draw one bead from bag 1 (P1) and one bead from bag 2 (P2).<br />
This represents the joining of two gametes to form a new individual. Record the “genotype” of this<br />
offspring. Return the “gametes” to their original bags. Repeat for a total of 20 times.<br />
Offspring Genotypes<br />
1 2 3 4 5 6 7 8 9 10<br />
11 12 13 14 15 16 17 18 19 20<br />
Expected Genotype ratio:<br />
Expected Phenotype ratio:<br />
______ RR : ______ Rr: ______ rr<br />
______ Red : ______ Blue<br />
Actual Genotype ratio:<br />
Actual Phenotype ratio:<br />
______ RR : ______ Rr: ______ rr<br />
______ Red : ______ Blue<br />
How did your results compare to the expected ratio?<br />
How did the total class results compare to the expected ratio?<br />
Page 3
Explore an Issue in Genetic Screening: Who Wants to Know? Who<br />
Needs to Know?<br />
The Issue<br />
The ethics of legal access to, and ownership of genetic information needs to be considered carefully as<br />
technology for collecting and testing genetic disorders and other inherited characteristics increases.<br />
Who decides? Who wants to know? Who should know? Who should we be required by law to tell?<br />
Brainstorm a list of FIVE people that might have an interest in knowing YOUR DNA – then list the<br />
possible benefits and risks of their knowing – to them and to you!<br />
Who? Benefits Risks<br />
You may wish to consider the following situations:<br />
• Parenting: Should parents be able to test their children for any genetic disorder or trait?<br />
• Relationships: Should people have access to a potential partner’s genetic information? What if your<br />
partner might develop Huntington’s disease? Should you have the legal right to know?<br />
• Employment: Should prospective employers have access to genetic information about an applicant?<br />
If so, how much of this information should be used to determine eligibility for employment? For<br />
example, should an airline be able to screen its pilots for a gene that increases the risk of a heart<br />
attack?<br />
Page 4


