Big Lake, AK Map & Demographics
Big Lake Map
Big Lake Overview
$40,697
PER CAPITA INCOME
$99,743
AVG FAMILY INCOME
$77,292
AVG HOUSEHOLD INCOME
41.7%
WAGE / INCOME GAP [ % ]
58.3¢/ $1
WAGE / INCOME GAP [ $ ]
0.45
INEQUALITY / GINI INDEX
3,232
TOTAL POPULATION
1,695
MALE POPULATION
1,537
FEMALE POPULATION
110.28
MALES / 100 FEMALES
90.68
FEMALES / 100 MALES
35.8
MEDIAN AGE
2.9
AVG FAMILY SIZE
2.4
AVG HOUSEHOLD SIZE
1,587
LABOR FORCE [ PEOPLE ]
61.3%
PERCENT IN LABOR FORCE
6.3%
UNEMPLOYMENT RATE
Big Lake Zip Codes
Big Lake Area Codes
Income in Big Lake
Income Overview in Big Lake
Per Capita Income in Big Lake is $40,697, while median incomes of families and households are $99,743 and $77,292 respectively.
| Characteristic | Number | Measure |
| Per Capita Income | 3,232 | $40,697 |
| Median Family Income | 874 | $99,743 |
| Mean Family Income | 874 | $116,064 |
| Median Household Income | 1,343 | $77,292 |
| Mean Household Income | 1,343 | $97,322 |
| Income Deficit | 874 | $0 |
| Wage / Income Gap (%) | 3,232 | 41.68% |
| Wage / Income Gap ($) | 3,232 | 58.32¢ per $1 |
| Gini / Inequality Index | 3,232 | 0.45 |
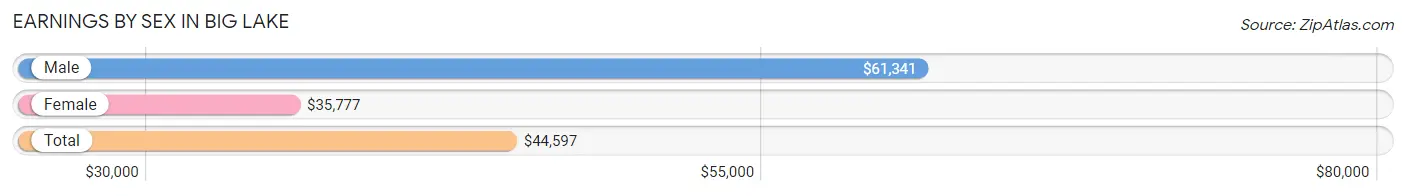
Earnings by Sex in Big Lake
Average Earnings in Big Lake are $44,597, $61,341 for men and $35,777 for women, a difference of 41.7%.
| Sex | Number | Average Earnings |
| Male | 907 (55.9%) | $61,341 |
| Female | 715 (44.1%) | $35,777 |
| Total | 1,622 (100.0%) | $44,597 |
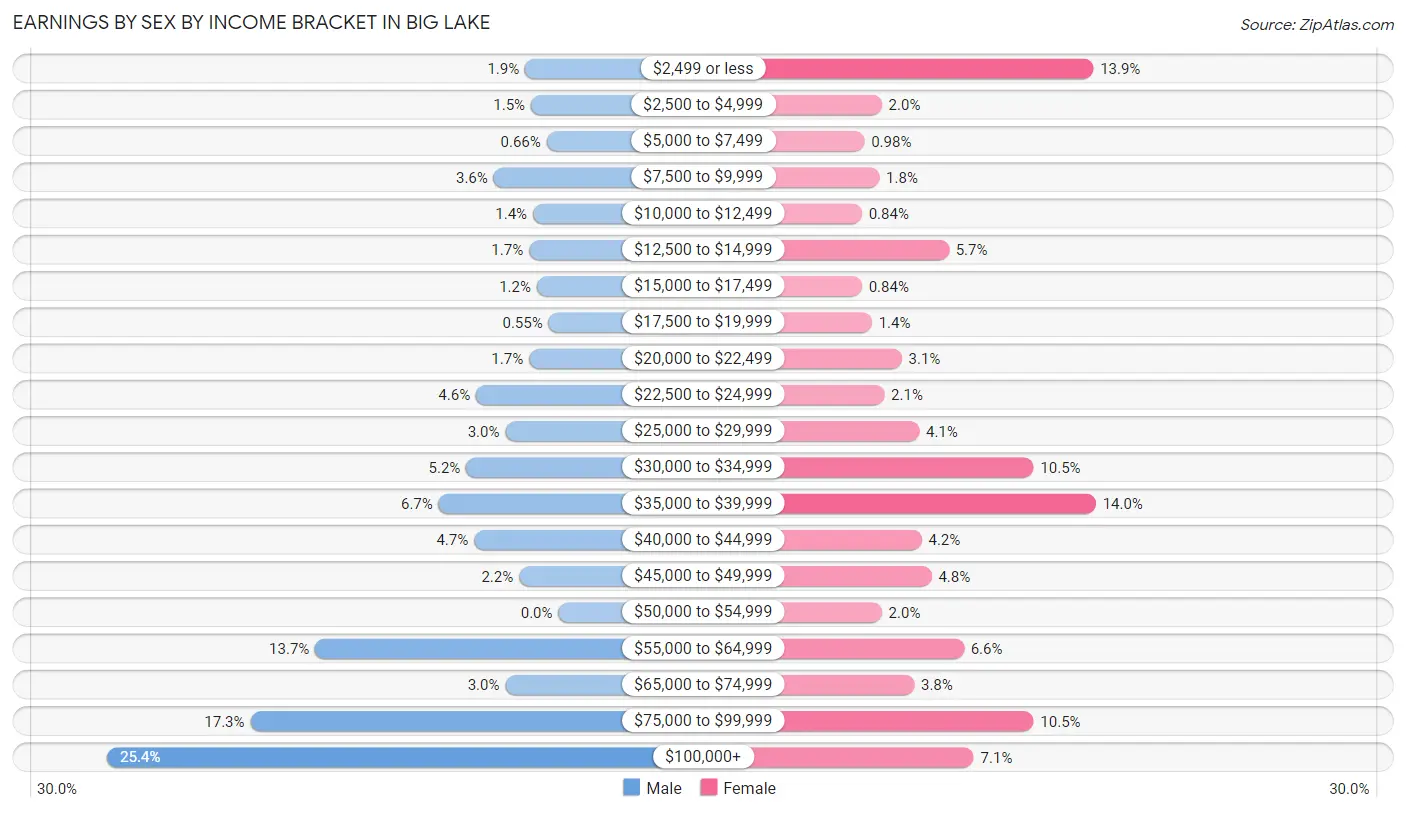
Earnings by Sex by Income Bracket in Big Lake
The most common earnings brackets in Big Lake are $100,000+ for men (230 | 25.4%) and $35,000 to $39,999 for women (100 | 14.0%).
| Income | Male | Female |
| $2,499 or less | 17 (1.9%) | 99 (13.9%) |
| $2,500 to $4,999 | 14 (1.5%) | 14 (2.0%) |
| $5,000 to $7,499 | 6 (0.7%) | 7 (1.0%) |
| $7,500 to $9,999 | 33 (3.6%) | 13 (1.8%) |
| $10,000 to $12,499 | 13 (1.4%) | 6 (0.8%) |
| $12,500 to $14,999 | 15 (1.7%) | 41 (5.7%) |
| $15,000 to $17,499 | 11 (1.2%) | 6 (0.8%) |
| $17,500 to $19,999 | 5 (0.5%) | 10 (1.4%) |
| $20,000 to $22,499 | 15 (1.7%) | 22 (3.1%) |
| $22,500 to $24,999 | 42 (4.6%) | 15 (2.1%) |
| $25,000 to $29,999 | 27 (3.0%) | 29 (4.1%) |
| $30,000 to $34,999 | 47 (5.2%) | 75 (10.5%) |
| $35,000 to $39,999 | 61 (6.7%) | 100 (14.0%) |
| $40,000 to $44,999 | 43 (4.7%) | 30 (4.2%) |
| $45,000 to $49,999 | 20 (2.2%) | 34 (4.8%) |
| $50,000 to $54,999 | 0 (0.0%) | 14 (2.0%) |
| $55,000 to $64,999 | 124 (13.7%) | 47 (6.6%) |
| $65,000 to $74,999 | 27 (3.0%) | 27 (3.8%) |
| $75,000 to $99,999 | 157 (17.3%) | 75 (10.5%) |
| $100,000+ | 230 (25.4%) | 51 (7.1%) |
| Total | 907 (100.0%) | 715 (100.0%) |
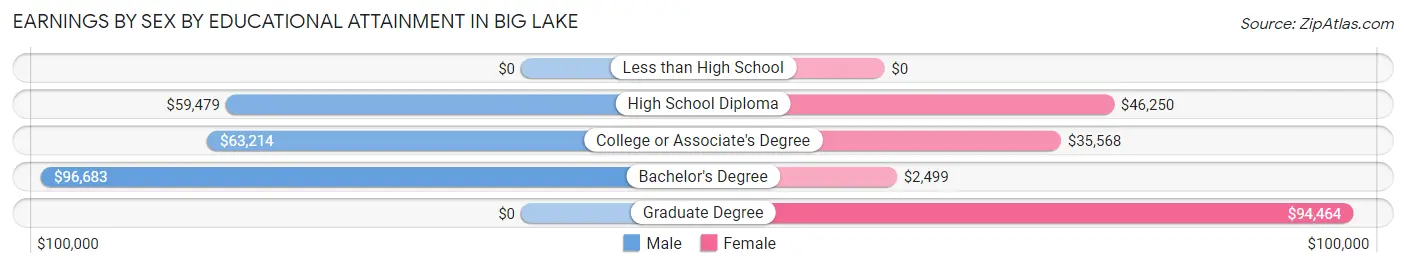
Earnings by Sex by Educational Attainment in Big Lake
Average earnings in Big Lake are $64,911 for men and $36,379 for women, a difference of 44.0%. Men with an educational attainment of bachelor's degree enjoy the highest average annual earnings of $96,683, while those with high school diploma education earn the least with $59,479. Women with an educational attainment of graduate degree earn the most with the average annual earnings of $94,464, while those with bachelor's degree education have the smallest earnings of $2,499.
| Educational Attainment | Male Income | Female Income |
| Less than High School | - | - |
| High School Diploma | $59,479 | $46,250 |
| College or Associate's Degree | $63,214 | $35,568 |
| Bachelor's Degree | $96,683 | $2,499 |
| Graduate Degree | - | - |
| Total | $64,911 | $36,379 |
Family Income in Big Lake
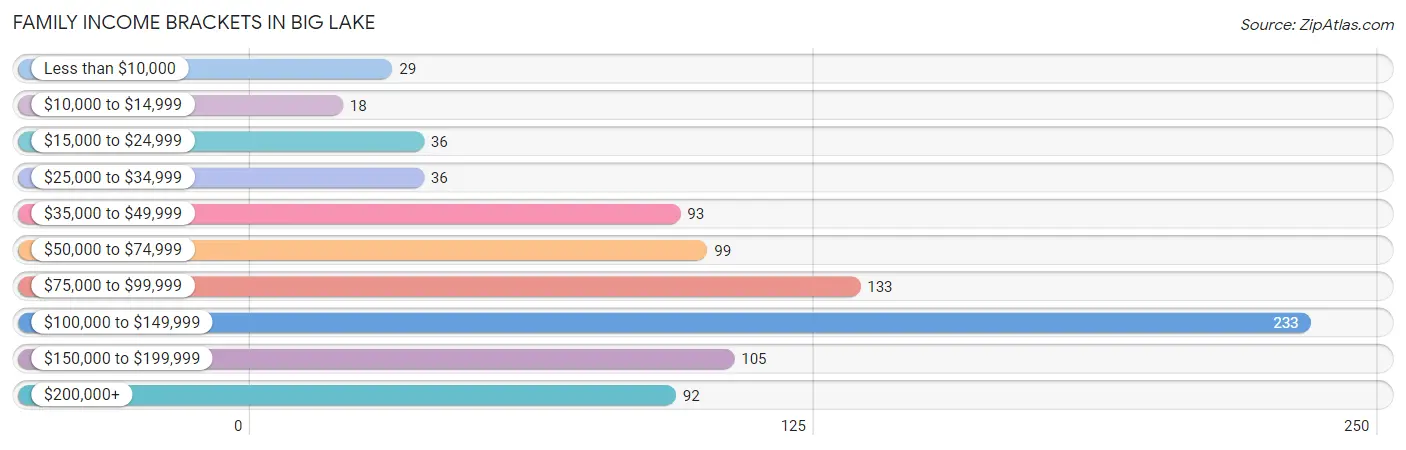
Family Income Brackets in Big Lake
According to the Big Lake family income data, there are 233 families falling into the $100,000 to $149,999 income range, which is the most common income bracket and makes up 26.7% of all families. Conversely, the $10,000 to $14,999 income bracket is the least frequent group with only 18 families (2.1%) belonging to this category.
| Income Bracket | # Families | % Families |
| Less than $10,000 | 29 | 3.3% |
| $10,000 to $14,999 | 18 | 2.1% |
| $15,000 to $24,999 | 36 | 4.1% |
| $25,000 to $34,999 | 36 | 4.1% |
| $35,000 to $49,999 | 93 | 10.6% |
| $50,000 to $74,999 | 99 | 11.3% |
| $75,000 to $99,999 | 133 | 15.2% |
| $100,000 to $149,999 | 233 | 26.7% |
| $150,000 to $199,999 | 105 | 12.0% |
| $200,000+ | 92 | 10.5% |
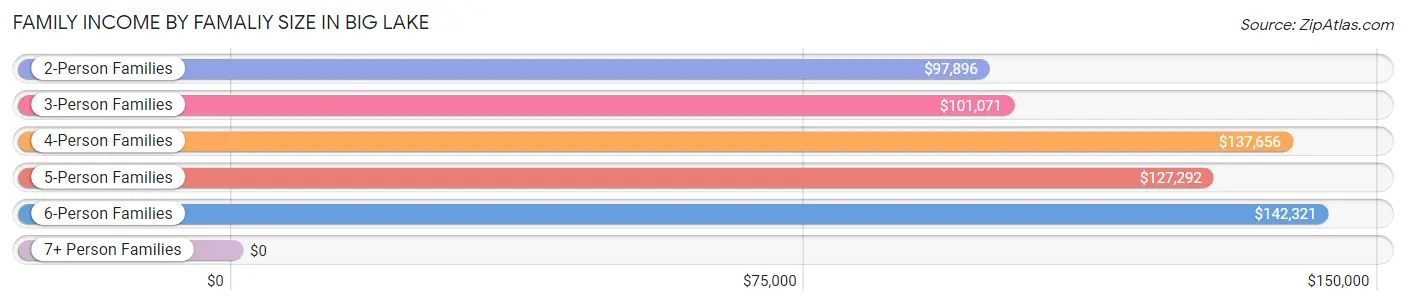
Family Income by Famaliy Size in Big Lake
6-person families (35 | 4.0%) account for the highest median family income in Big Lake with $142,321 per family, while 2-person families (483 | 55.3%) have the highest median income of $48,948 per family member.
| Income Bracket | # Families | Median Income |
| 2-Person Families | 483 (55.3%) | $97,896 |
| 3-Person Families | 148 (16.9%) | $101,071 |
| 4-Person Families | 147 (16.8%) | $137,656 |
| 5-Person Families | 45 (5.1%) | $127,292 |
| 6-Person Families | 35 (4.0%) | $142,321 |
| 7+ Person Families | 16 (1.8%) | $0 |
| Total | 874 (100.0%) | $99,743 |
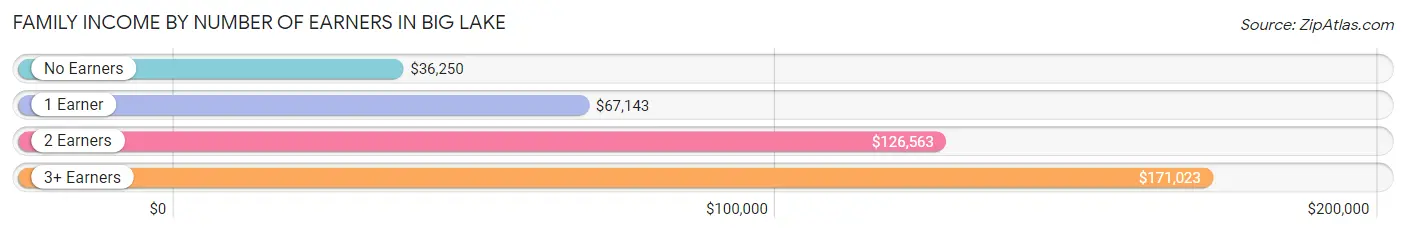
Family Income by Number of Earners in Big Lake
The median family income in Big Lake is $99,743, with families comprising 3+ earners (43) having the highest median family income of $171,023, while families with no earners (152) have the lowest median family income of $36,250, accounting for 4.9% and 17.4% of families, respectively.
| Number of Earners | # Families | Median Income |
| No Earners | 152 (17.4%) | $36,250 |
| 1 Earner | 324 (37.1%) | $67,143 |
| 2 Earners | 355 (40.6%) | $126,563 |
| 3+ Earners | 43 (4.9%) | $171,023 |
| Total | 874 (100.0%) | $99,743 |
Household Income in Big Lake
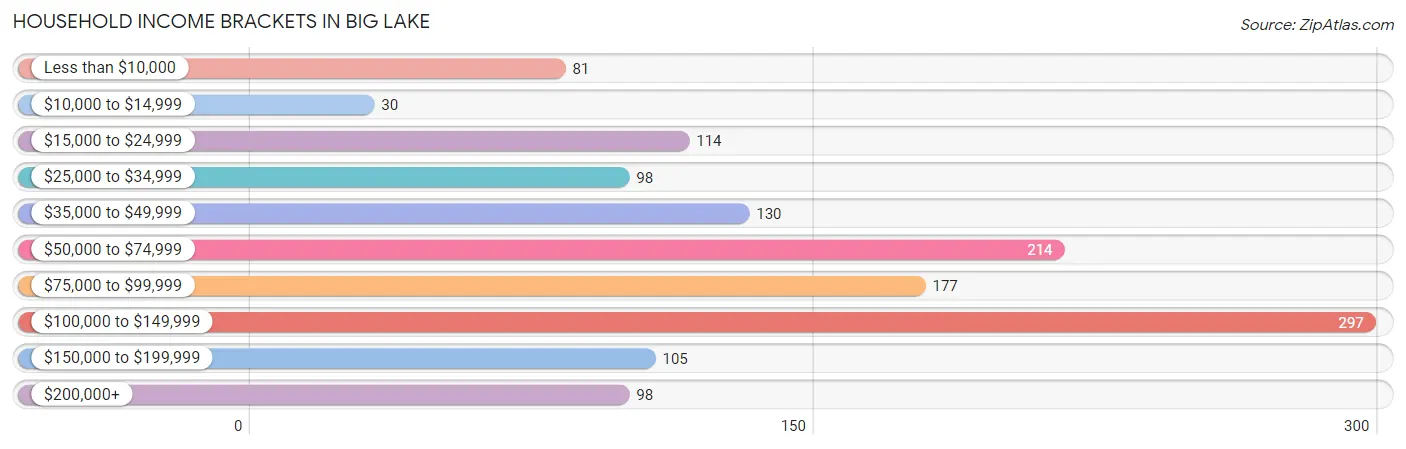
Household Income Brackets in Big Lake
With 297 households falling in the category, the $100,000 to $149,999 income range is the most frequent in Big Lake, accounting for 22.1% of all households. In contrast, only 30 households (2.2%) fall into the $10,000 to $14,999 income bracket, making it the least populous group.
| Income Bracket | # Households | % Households |
| Less than $10,000 | 81 | 6.0% |
| $10,000 to $14,999 | 30 | 2.2% |
| $15,000 to $24,999 | 114 | 8.5% |
| $25,000 to $34,999 | 98 | 7.3% |
| $35,000 to $49,999 | 130 | 9.7% |
| $50,000 to $74,999 | 214 | 15.9% |
| $75,000 to $99,999 | 177 | 13.2% |
| $100,000 to $149,999 | 297 | 22.1% |
| $150,000 to $199,999 | 105 | 7.8% |
| $200,000+ | 98 | 7.3% |
Household Income by Householder Age in Big Lake
The median household income in Big Lake is $77,292, with the highest median household income of $100,536 found in the 25 to 44 years age bracket for the primary householder. A total of 475 households (35.4%) fall into this category. Meanwhile, the 15 to 24 years age bracket for the primary householder has the lowest median household income of $31,250, with 42 households (3.1%) in this group.
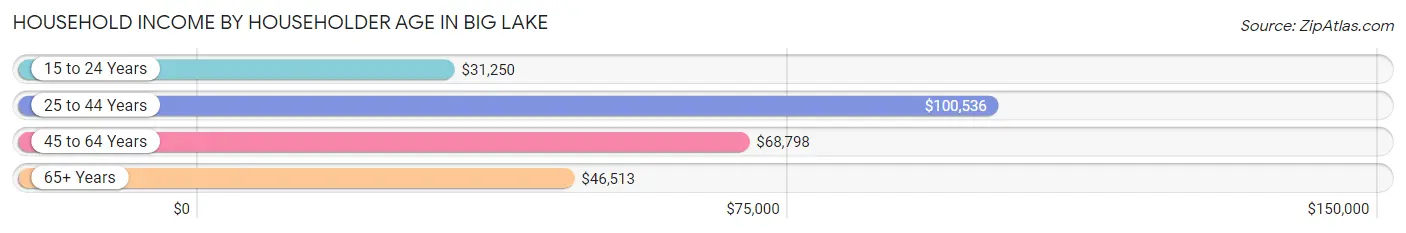
| Income Bracket | # Households | Median Income |
| 15 to 24 Years | 42 (3.1%) | $31,250 |
| 25 to 44 Years | 475 (35.4%) | $100,536 |
| 45 to 64 Years | 525 (39.1%) | $68,798 |
| 65+ Years | 301 (22.4%) | $46,513 |
| Total | 1,343 (100.0%) | $77,292 |
Poverty in Big Lake
Income Below Poverty by Sex and Age in Big Lake
With 13.0% poverty level for males and 12.4% for females among the residents of Big Lake, 15 year old males and 15 year old females are the most vulnerable to poverty, with 7 males (50.0%) and 7 females (41.2%) in their respective age groups living below the poverty level.
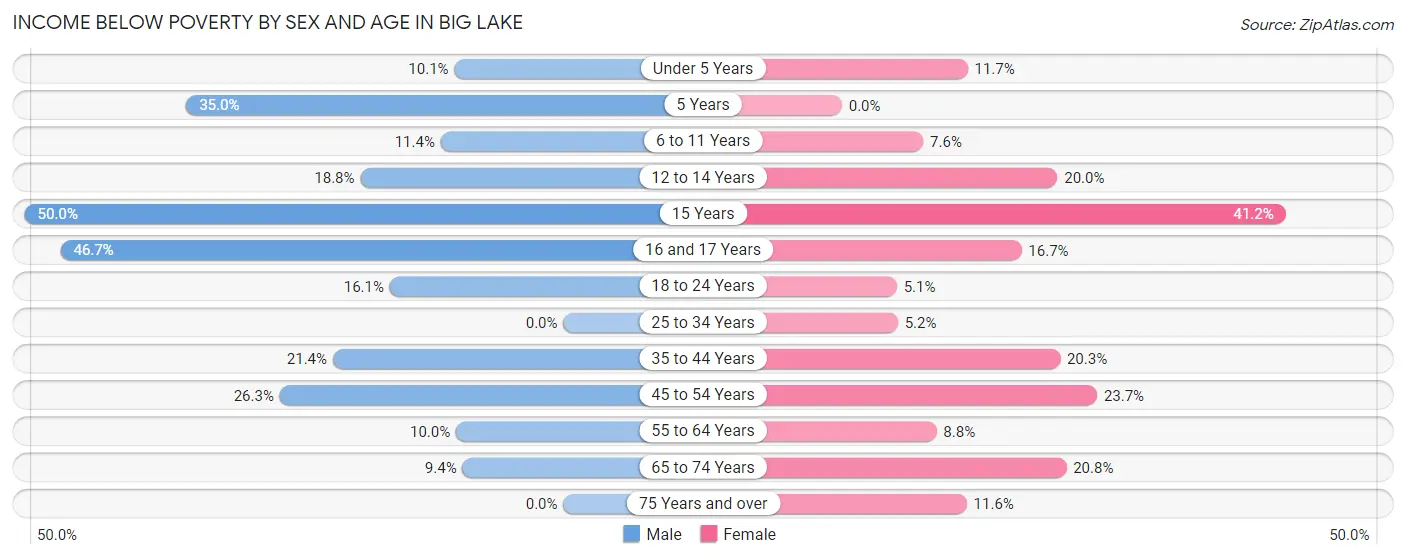
| Age Bracket | Male | Female |
| Under 5 Years | 9 (10.1%) | 14 (11.7%) |
| 5 Years | 7 (35.0%) | 0 (0.0%) |
| 6 to 11 Years | 14 (11.4%) | 8 (7.5%) |
| 12 to 14 Years | 13 (18.8%) | 10 (20.0%) |
| 15 Years | 7 (50.0%) | 7 (41.2%) |
| 16 and 17 Years | 14 (46.7%) | 6 (16.7%) |
| 18 to 24 Years | 24 (16.1%) | 5 (5.1%) |
| 25 to 34 Years | 0 (0.0%) | 16 (5.2%) |
| 35 to 44 Years | 43 (21.4%) | 33 (20.3%) |
| 45 to 54 Years | 45 (26.3%) | 36 (23.7%) |
| 55 to 64 Years | 26 (10.0%) | 23 (8.8%) |
| 65 to 74 Years | 19 (9.4%) | 25 (20.8%) |
| 75 Years and over | 0 (0.0%) | 8 (11.6%) |
| Total | 221 (13.0%) | 191 (12.4%) |
Income Above Poverty by Sex and Age in Big Lake
According to the poverty statistics in Big Lake, males aged 25 to 34 years and females aged 5 years are the age groups that are most secure financially, with 100.0% of males and 100.0% of females in these age groups living above the poverty line.
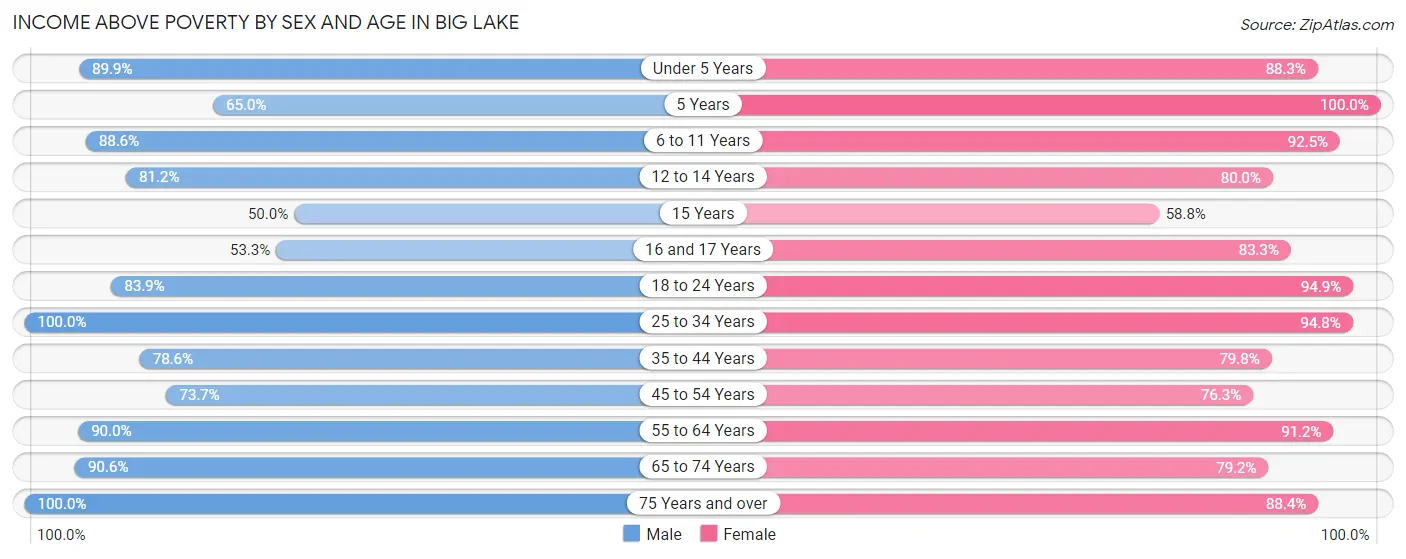
| Age Bracket | Male | Female |
| Under 5 Years | 80 (89.9%) | 106 (88.3%) |
| 5 Years | 13 (65.0%) | 35 (100.0%) |
| 6 to 11 Years | 109 (88.6%) | 98 (92.4%) |
| 12 to 14 Years | 56 (81.2%) | 40 (80.0%) |
| 15 Years | 7 (50.0%) | 10 (58.8%) |
| 16 and 17 Years | 16 (53.3%) | 30 (83.3%) |
| 18 to 24 Years | 125 (83.9%) | 93 (94.9%) |
| 25 to 34 Years | 300 (100.0%) | 292 (94.8%) |
| 35 to 44 Years | 158 (78.6%) | 130 (79.7%) |
| 45 to 54 Years | 126 (73.7%) | 116 (76.3%) |
| 55 to 64 Years | 235 (90.0%) | 239 (91.2%) |
| 65 to 74 Years | 184 (90.6%) | 95 (79.2%) |
| 75 Years and over | 65 (100.0%) | 61 (88.4%) |
| Total | 1,474 (87.0%) | 1,345 (87.6%) |
Income Below Poverty Among Married-Couple Families in Big Lake
The poverty statistics for married-couple families in Big Lake show that 5.7% or 38 of the total 673 families live below the poverty line. Families with 5 or more children have the highest poverty rate of 43.8%, comprising of 7 families. On the other hand, families with 3 or 4 children have the lowest poverty rate of 0.0%, which includes 0 families.
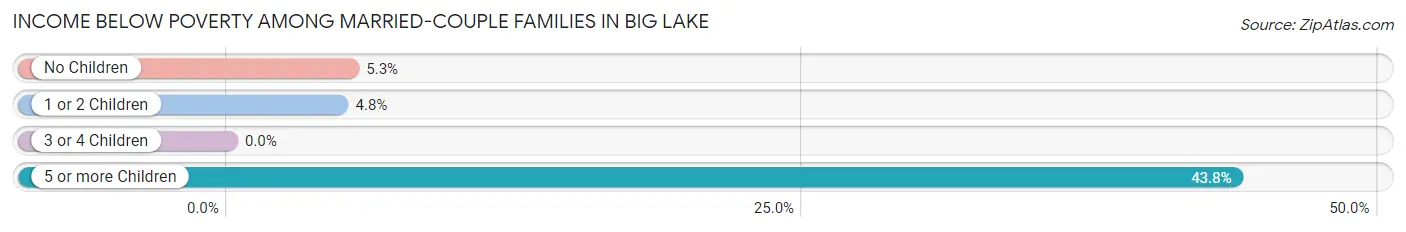
| Children | Above Poverty | Below Poverty |
| No Children | 395 (94.7%) | 22 (5.3%) |
| 1 or 2 Children | 178 (95.2%) | 9 (4.8%) |
| 3 or 4 Children | 53 (100.0%) | 0 (0.0%) |
| 5 or more Children | 9 (56.2%) | 7 (43.8%) |
| Total | 635 (94.4%) | 38 (5.7%) |
Income Below Poverty Among Single-Parent Households in Big Lake
According to the poverty data in Big Lake, 12.1% or 11 single-father households and 17.3% or 19 single-mother households are living below the poverty line. Among single-father households, those with 1 or 2 children have the highest poverty rate, with 11 households (16.2%) experiencing poverty. Likewise, among single-mother households, those with 1 or 2 children have the highest poverty rate, with 12 households (18.5%) falling below the poverty line.
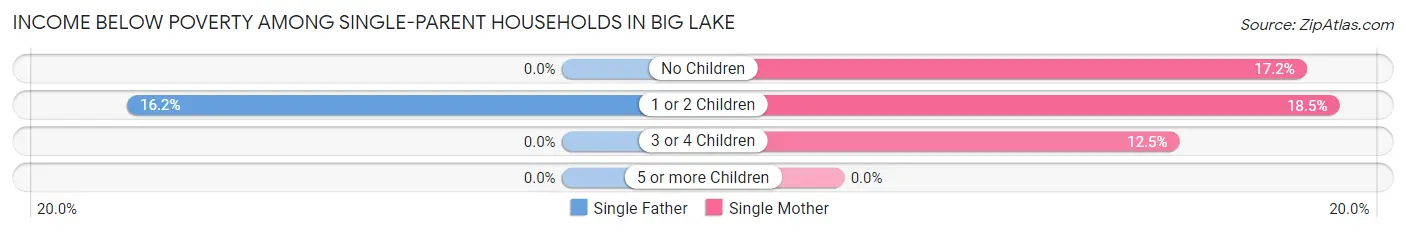
| Children | Single Father | Single Mother |
| No Children | 0 (0.0%) | 5 (17.2%) |
| 1 or 2 Children | 11 (16.2%) | 12 (18.5%) |
| 3 or 4 Children | 0 (0.0%) | 2 (12.5%) |
| 5 or more Children | 0 (0.0%) | 0 (0.0%) |
| Total | 11 (12.1%) | 19 (17.3%) |
Income Below Poverty Among Married-Couple vs Single-Parent Households in Big Lake
The poverty data for Big Lake shows that 38 of the married-couple family households (5.7%) and 30 of the single-parent households (14.9%) are living below the poverty level. Within the married-couple family households, those with 5 or more children have the highest poverty rate, with 7 households (43.8%) falling below the poverty line. Among the single-parent households, those with 1 or 2 children have the highest poverty rate, with 23 household (17.3%) living below poverty.
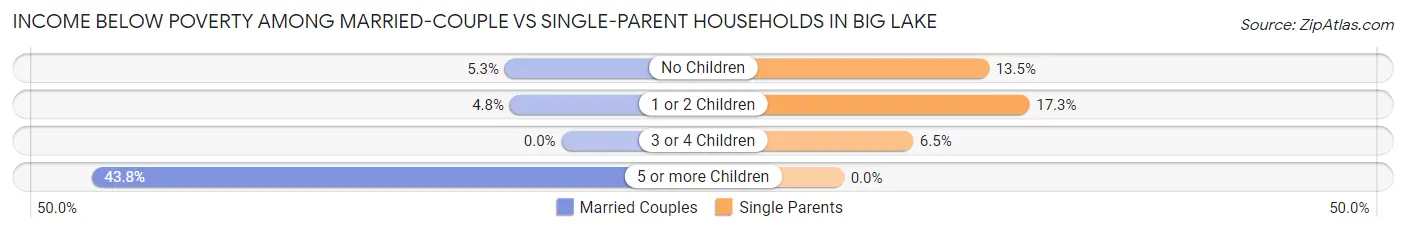
| Children | Married-Couple Families | Single-Parent Households |
| No Children | 22 (5.3%) | 5 (13.5%) |
| 1 or 2 Children | 9 (4.8%) | 23 (17.3%) |
| 3 or 4 Children | 0 (0.0%) | 2 (6.5%) |
| 5 or more Children | 7 (43.8%) | 0 (0.0%) |
| Total | 38 (5.7%) | 30 (14.9%) |
Race in Big Lake
The most populous races in Big Lake are White / Caucasian (2,802 | 86.7%), Two or more Races (168 | 5.2%), and Native / Alaskan (167 | 5.2%).
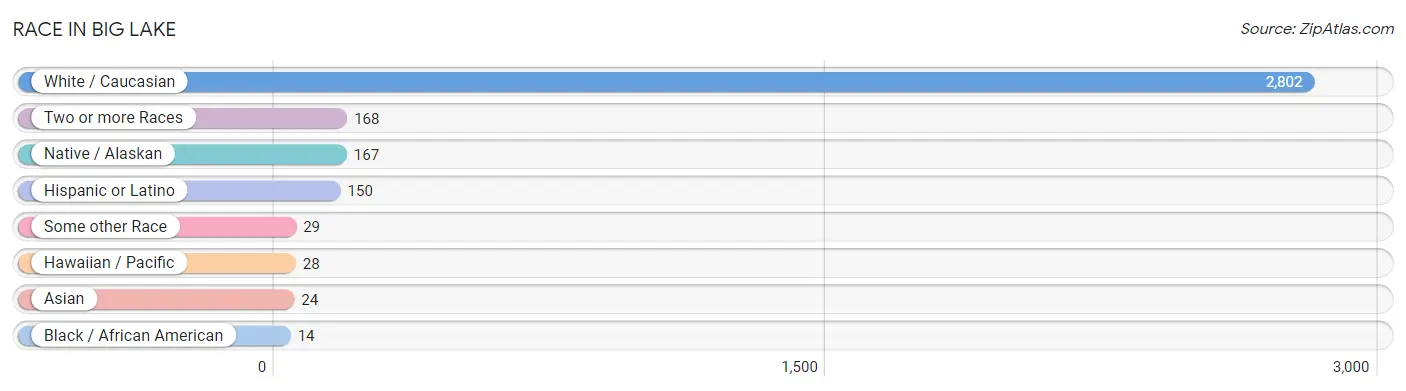
| Race | # Population | % Population |
| Asian | 24 | 0.7% |
| Black / African American | 14 | 0.4% |
| Hawaiian / Pacific | 28 | 0.9% |
| Hispanic or Latino | 150 | 4.6% |
| Native / Alaskan | 167 | 5.2% |
| White / Caucasian | 2,802 | 86.7% |
| Two or more Races | 168 | 5.2% |
| Some other Race | 29 | 0.9% |
| Total | 3,232 | 100.0% |
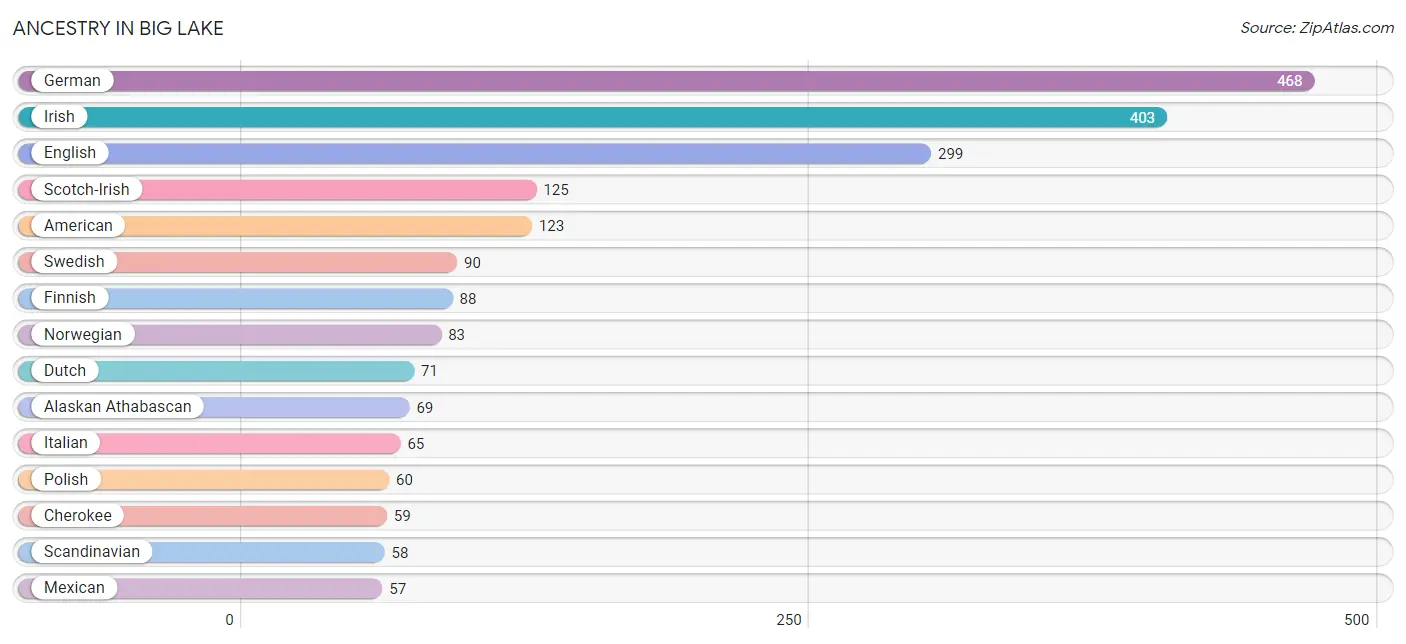
Ancestry in Big Lake
The most populous ancestries reported in Big Lake are German (468 | 14.5%), Irish (403 | 12.5%), English (299 | 9.2%), Scotch-Irish (125 | 3.9%), and American (123 | 3.8%), together accounting for 43.9% of all Big Lake residents.
| Ancestry | # Population | % Population |
| Alaska Native | 34 | 1.1% |
| Alaskan Athabascan | 69 | 2.1% |
| Aleut | 47 | 1.5% |
| American | 123 | 3.8% |
| Apache | 12 | 0.4% |
| Arab | 6 | 0.2% |
| Australian | 9 | 0.3% |
| Blackfeet | 8 | 0.3% |
| Brazilian | 5 | 0.2% |
| British | 5 | 0.2% |
| Canadian | 32 | 1.0% |
| Central American | 18 | 0.6% |
| Cherokee | 59 | 1.8% |
| Colville | 7 | 0.2% |
| Croatian | 3 | 0.1% |
| Crow | 7 | 0.2% |
| Czech | 37 | 1.1% |
| Czechoslovakian | 1 | 0.0% |
| Danish | 2 | 0.1% |
| Dominican | 28 | 0.9% |
| Dutch | 71 | 2.2% |
| English | 299 | 9.2% |
| European | 53 | 1.6% |
| Finnish | 88 | 2.7% |
| French | 40 | 1.2% |
| French Canadian | 19 | 0.6% |
| German | 468 | 14.5% |
| Greek | 7 | 0.2% |
| Guamanian / Chamorro | 28 | 0.9% |
| Honduran | 18 | 0.6% |
| Hungarian | 10 | 0.3% |
| Indian (Asian) | 9 | 0.3% |
| Inupiat | 56 | 1.7% |
| Iranian | 17 | 0.5% |
| Irish | 403 | 12.5% |
| Italian | 65 | 2.0% |
| Korean | 22 | 0.7% |
| Mexican | 57 | 1.8% |
| Northern European | 12 | 0.4% |
| Norwegian | 83 | 2.6% |
| Osage | 5 | 0.2% |
| Polish | 60 | 1.9% |
| Portuguese | 4 | 0.1% |
| Puerto Rican | 28 | 0.9% |
| Puget Sound Salish | 5 | 0.2% |
| Russian | 6 | 0.2% |
| Scandinavian | 58 | 1.8% |
| Scotch-Irish | 125 | 3.9% |
| Scottish | 54 | 1.7% |
| Slovene | 9 | 0.3% |
| Spanish | 19 | 0.6% |
| Swedish | 90 | 2.8% |
| Swiss | 6 | 0.2% |
| Tlingit-Haida | 5 | 0.2% |
| Welsh | 39 | 1.2% |
| Yup'ik | 29 | 0.9% | View All 56 Rows |
Immigrants in Big Lake
The most numerous immigrant groups reported in Big Lake came from Asia (21 | 0.6%), Latin America (20 | 0.6%), Central America (14 | 0.4%), Philippines (12 | 0.4%), and South Eastern Asia (12 | 0.4%), together accounting for 2.4% of all Big Lake residents.
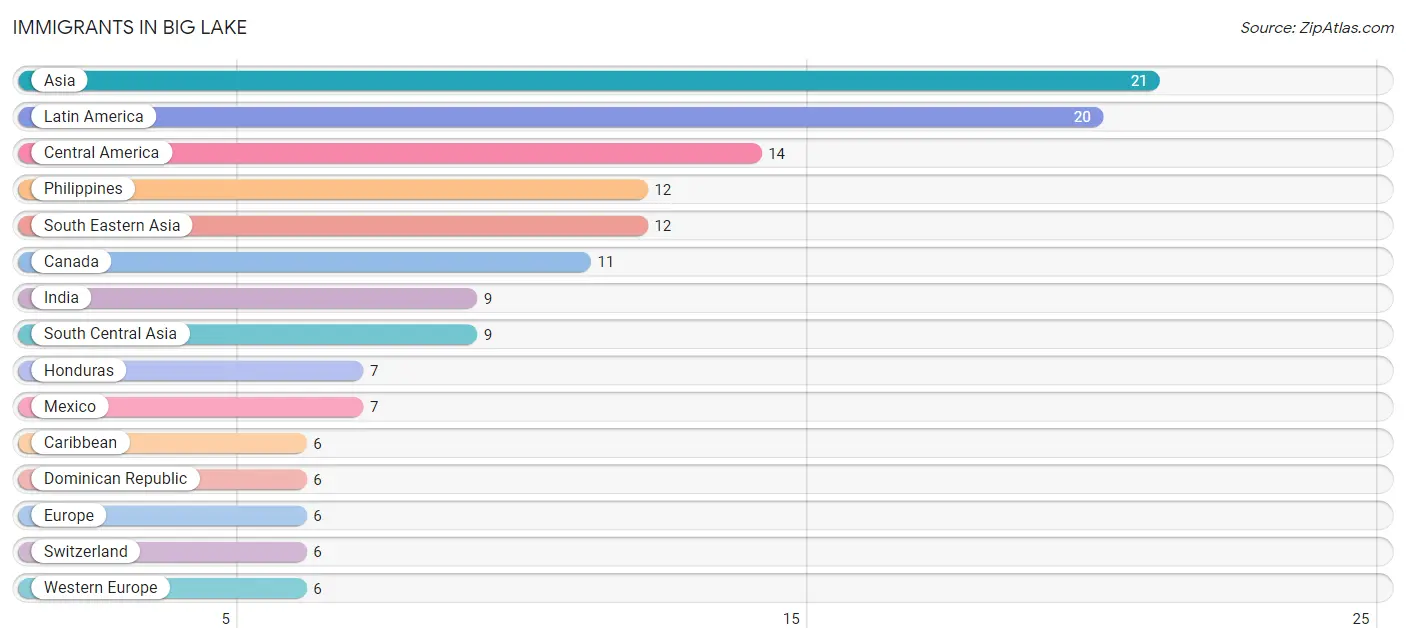
| Immigration Origin | # Population | % Population |
| Asia | 21 | 0.6% |
| Canada | 11 | 0.3% |
| Caribbean | 6 | 0.2% |
| Central America | 14 | 0.4% |
| Dominican Republic | 6 | 0.2% |
| Europe | 6 | 0.2% |
| Honduras | 7 | 0.2% |
| India | 9 | 0.3% |
| Latin America | 20 | 0.6% |
| Mexico | 7 | 0.2% |
| Philippines | 12 | 0.4% |
| South Central Asia | 9 | 0.3% |
| South Eastern Asia | 12 | 0.4% |
| Switzerland | 6 | 0.2% |
| Western Europe | 6 | 0.2% | View All 15 Rows |
Sex and Age in Big Lake
Sex and Age in Big Lake
The most populous age groups in Big Lake are 30 to 34 Years (156 | 9.2%) for men and 30 to 34 Years (157 | 10.2%) for women.
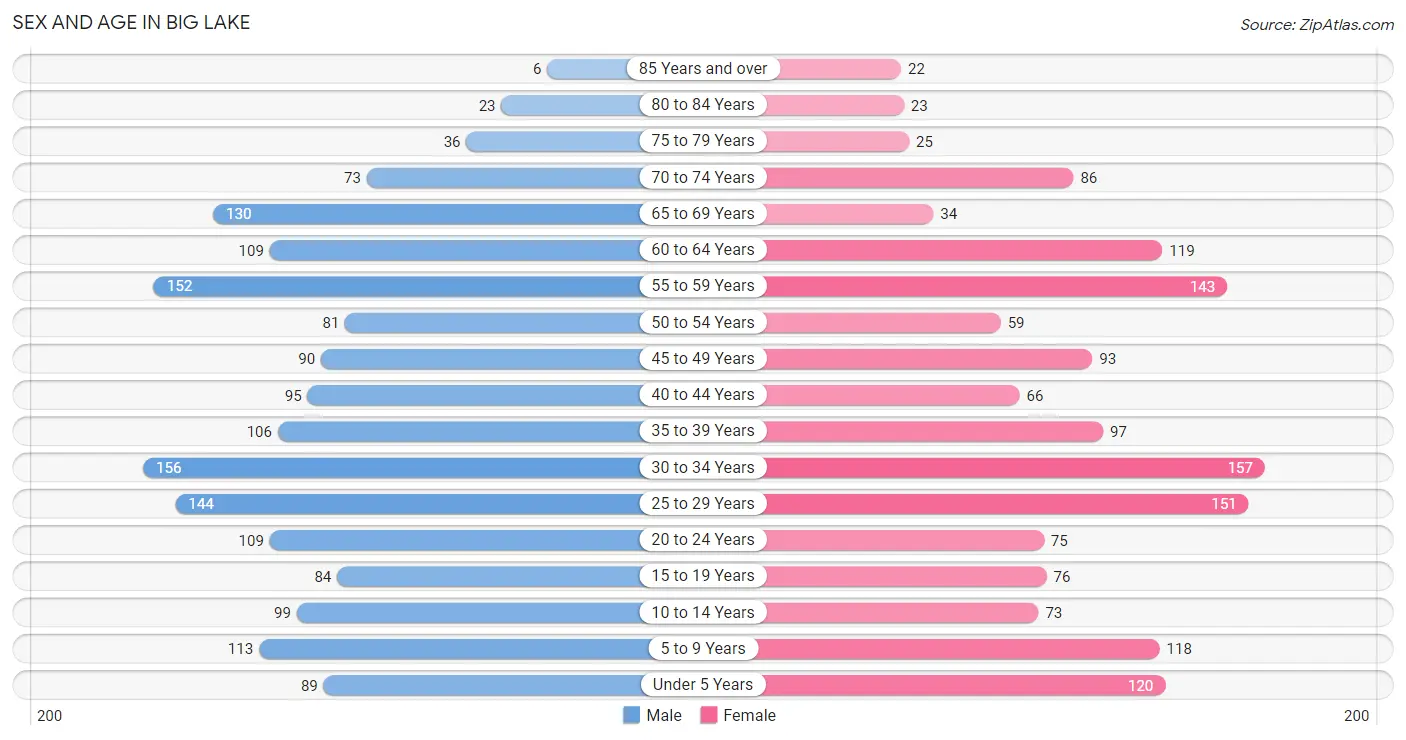
| Age Bracket | Male | Female |
| Under 5 Years | 89 (5.2%) | 120 (7.8%) |
| 5 to 9 Years | 113 (6.7%) | 118 (7.7%) |
| 10 to 14 Years | 99 (5.8%) | 73 (4.8%) |
| 15 to 19 Years | 84 (5.0%) | 76 (4.9%) |
| 20 to 24 Years | 109 (6.4%) | 75 (4.9%) |
| 25 to 29 Years | 144 (8.5%) | 151 (9.8%) |
| 30 to 34 Years | 156 (9.2%) | 157 (10.2%) |
| 35 to 39 Years | 106 (6.2%) | 97 (6.3%) |
| 40 to 44 Years | 95 (5.6%) | 66 (4.3%) |
| 45 to 49 Years | 90 (5.3%) | 93 (6.0%) |
| 50 to 54 Years | 81 (4.8%) | 59 (3.8%) |
| 55 to 59 Years | 152 (9.0%) | 143 (9.3%) |
| 60 to 64 Years | 109 (6.4%) | 119 (7.7%) |
| 65 to 69 Years | 130 (7.7%) | 34 (2.2%) |
| 70 to 74 Years | 73 (4.3%) | 86 (5.6%) |
| 75 to 79 Years | 36 (2.1%) | 25 (1.6%) |
| 80 to 84 Years | 23 (1.4%) | 23 (1.5%) |
| 85 Years and over | 6 (0.4%) | 22 (1.4%) |
| Total | 1,695 (100.0%) | 1,537 (100.0%) |
Families and Households in Big Lake
Median Family Size in Big Lake
The median family size in Big Lake is 2.88 persons per family, with married-couple families (673 | 77.0%) accounting for the largest median family size of 2.99 persons per family. On the other hand, single male/father families (91 | 10.4%) represent the smallest median family size with 2.41 persons per family.

| Family Type | # Families | Family Size |
| Married-Couple | 673 (77.0%) | 2.99 |
| Single Male/Father | 91 (10.4%) | 2.41 |
| Single Female/Mother | 110 (12.6%) | 2.65 |
| Total Families | 874 (100.0%) | 2.88 |
Median Household Size in Big Lake
The median household size in Big Lake is 2.41 persons per household, with single female/mother households (110 | 8.2%) accounting for the largest median household size of 3.25 persons per household. non-family households (469 | 34.9%) represent the smallest median household size with 1.23 persons per household.

| Household Type | # Households | Household Size |
| Married-Couple | 673 (50.1%) | 3.03 |
| Single Male/Father | 91 (6.8%) | 2.85 |
| Single Female/Mother | 110 (8.2%) | 3.25 |
| Non-family | 469 (34.9%) | 1.23 |
| Total Households | 1,343 (100.0%) | 2.41 |
Household Size by Marriage Status in Big Lake
Out of a total of 1,343 households in Big Lake, 874 (65.1%) are family households, while 469 (34.9%) are nonfamily households. The most numerous type of family households are 2-person households, comprising 432, and the most common type of nonfamily households are 1-person households, comprising 343.
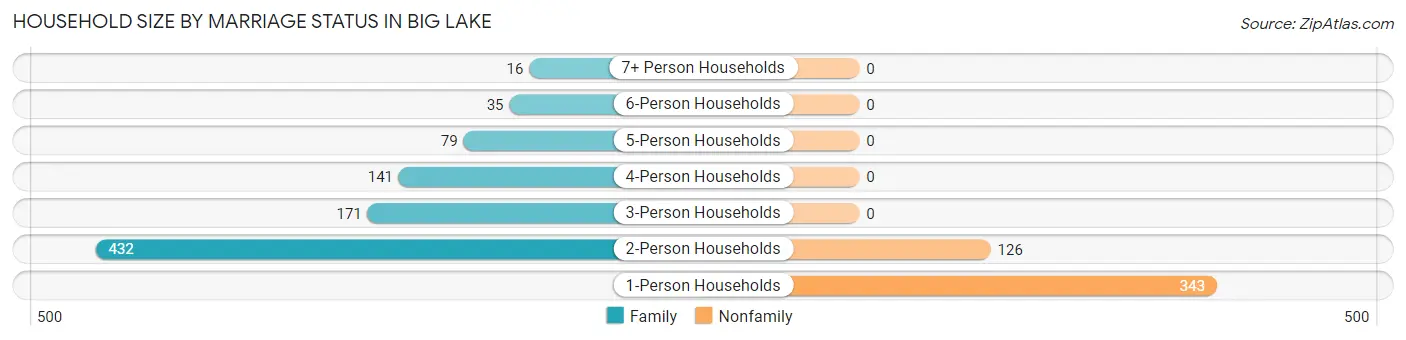
| Household Size | Family Households | Nonfamily Households |
| 1-Person Households | - | 343 (25.5%) |
| 2-Person Households | 432 (32.2%) | 126 (9.4%) |
| 3-Person Households | 171 (12.7%) | 0 (0.0%) |
| 4-Person Households | 141 (10.5%) | 0 (0.0%) |
| 5-Person Households | 79 (5.9%) | 0 (0.0%) |
| 6-Person Households | 35 (2.6%) | 0 (0.0%) |
| 7+ Person Households | 16 (1.2%) | 0 (0.0%) |
| Total | 874 (65.1%) | 469 (34.9%) |
Female Fertility in Big Lake
Fertility by Age in Big Lake
Average fertility rate in Big Lake is 97.0 births per 1,000 women. Women in the age bracket of 20 to 34 years have the highest fertility rate with 149.0 births per 1,000 women. Women in the age bracket of 20 to 34 years acount for 81.4% of all women with births.
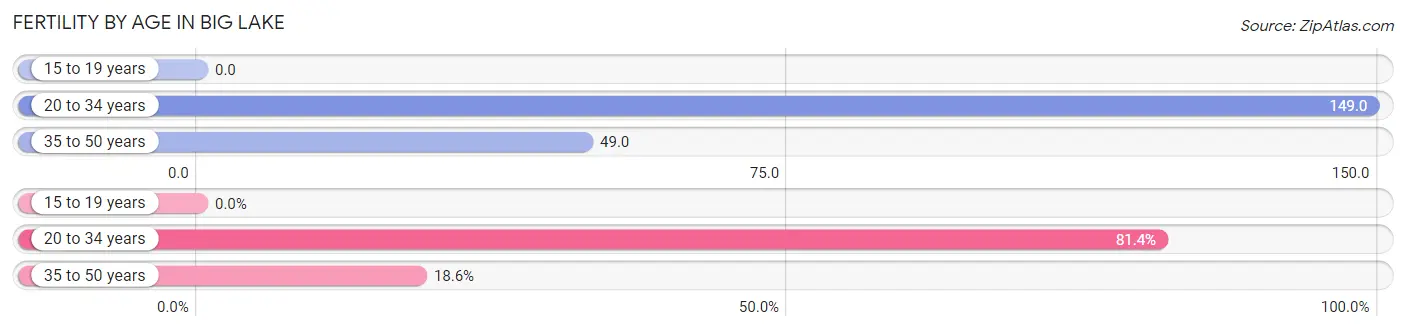
| Age Bracket | Women with Births | Births / 1,000 Women |
| 15 to 19 years | 0 (0.0%) | 0.0 |
| 20 to 34 years | 57 (81.4%) | 149.0 |
| 35 to 50 years | 13 (18.6%) | 49.0 |
| Total | 70 (100.0%) | 97.0 |
Fertility by Age by Marriage Status in Big Lake
87.1% of women with births (70) in Big Lake are married. The highest percentage of unmarried women with births falls into 20 to 34 years age bracket with 15.8% of them unmarried at the time of birth, while the lowest percentage of unmarried women with births belong to 35 to 50 years age bracket with 0.0% of them unmarried.
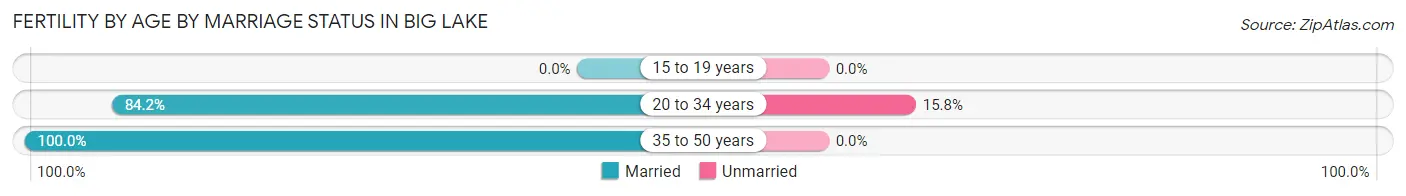
| Age Bracket | Married | Unmarried |
| 15 to 19 years | 0 (0.0%) | 0 (0.0%) |
| 20 to 34 years | 48 (84.2%) | 9 (15.8%) |
| 35 to 50 years | 13 (100.0%) | 0 (0.0%) |
| Total | 61 (87.1%) | 9 (12.9%) |
Fertility by Education in Big Lake
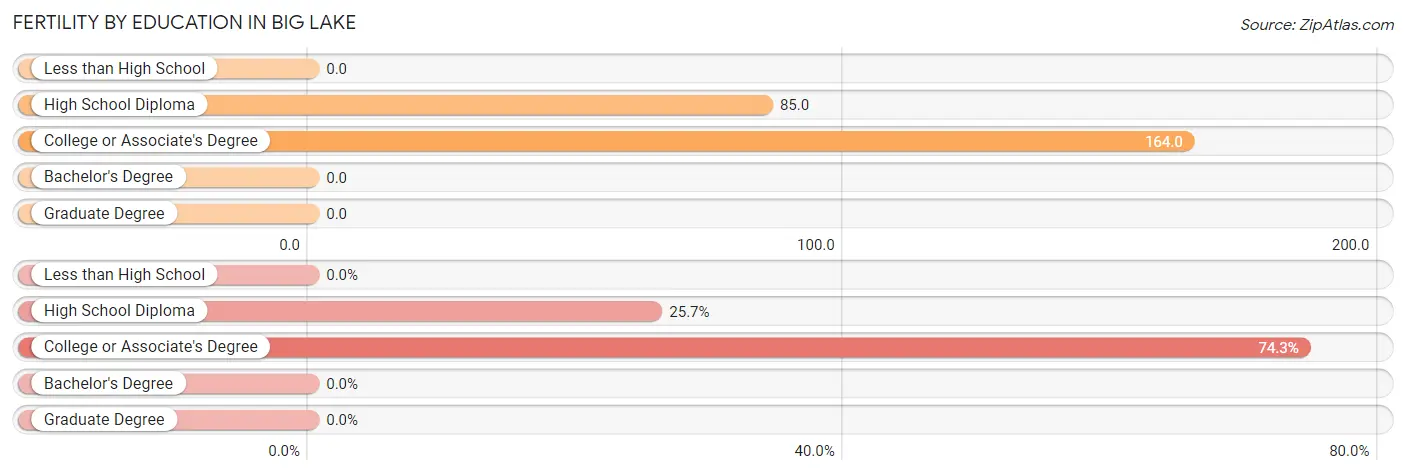
| Educational Attainment | Women with Births | Births / 1,000 Women |
| Less than High School | 0 (0.0%) | 0.0 |
| High School Diploma | 18 (25.7%) | 85.0 |
| College or Associate's Degree | 52 (74.3%) | 164.0 |
| Bachelor's Degree | 0 (0.0%) | 0.0 |
| Graduate Degree | 0 (0.0%) | 0.0 |
| Total | 70 (100.0%) | 97.0 |
Fertility by Education by Marriage Status in Big Lake
12.9% of women with births in Big Lake are unmarried. Women with the educational attainment of high school diploma are most likely to be married with 88.9% of them married at childbirth, while women with the educational attainment of college or associate's degree are least likely to be married with 13.5% of them unmarried at childbirth.
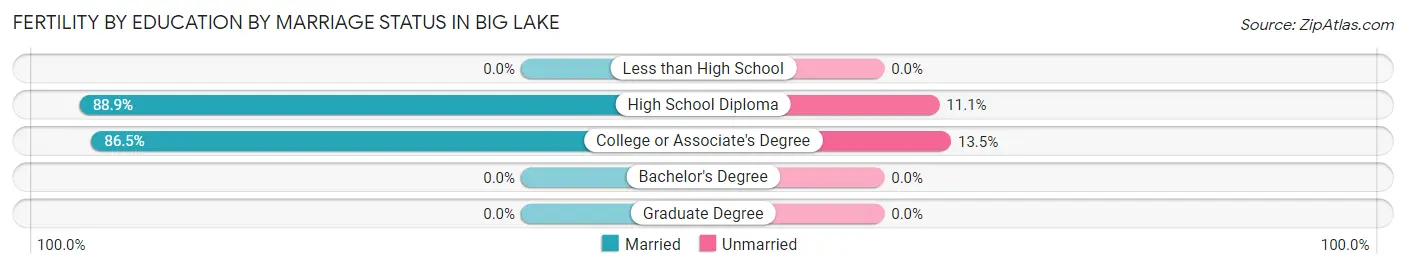
| Educational Attainment | Married | Unmarried |
| Less than High School | 0 (0.0%) | 0 (0.0%) |
| High School Diploma | 16 (88.9%) | 2 (11.1%) |
| College or Associate's Degree | 45 (86.5%) | 7 (13.5%) |
| Bachelor's Degree | 0 (0.0%) | 0 (0.0%) |
| Graduate Degree | 0 (0.0%) | 0 (0.0%) |
| Total | 61 (87.1%) | 9 (12.9%) |
Employment Characteristics in Big Lake
Employment by Class of Employer in Big Lake
Among the 1,438 employed individuals in Big Lake, private company employees (863 | 60.0%), not-for-profit organizations (217 | 15.1%), and state government employees (114 | 7.9%) make up the most common classes of employment.
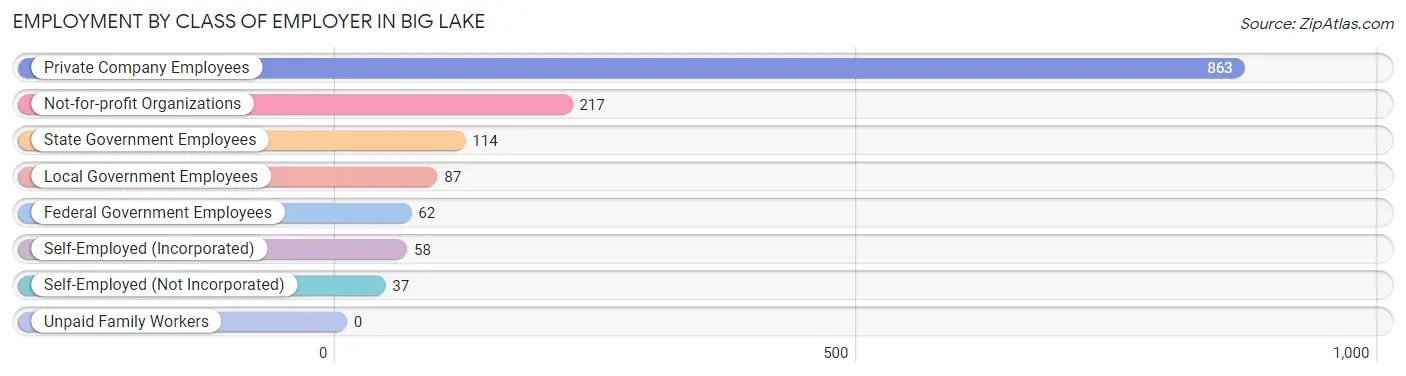
| Employer Class | # Employees | % Employees |
| Private Company Employees | 863 | 60.0% |
| Self-Employed (Incorporated) | 58 | 4.0% |
| Self-Employed (Not Incorporated) | 37 | 2.6% |
| Not-for-profit Organizations | 217 | 15.1% |
| Local Government Employees | 87 | 6.0% |
| State Government Employees | 114 | 7.9% |
| Federal Government Employees | 62 | 4.3% |
| Unpaid Family Workers | 0 | 0.0% |
| Total | 1,438 | 100.0% |
Employment Status by Age in Big Lake
According to the labor force statistics for Big Lake, out of the total population over 16 years of age (2,589), 61.3% or 1,587 individuals are in the labor force, with 6.3% or 100 of them unemployed. The age group with the highest labor force participation rate is 30 to 34 years, with 91.4% or 286 individuals in the labor force. Within the labor force, the 55 to 59 years age range has the highest percentage of unemployed individuals, with 15.8% or 31 of them being unemployed.
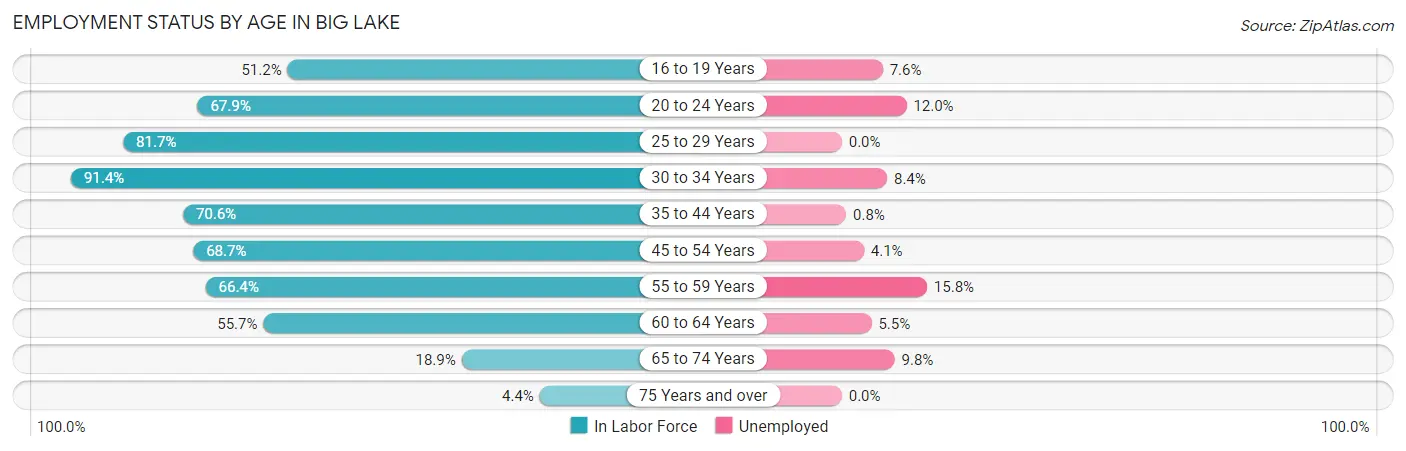
| Age Bracket | In Labor Force | Unemployed |
| 16 to 19 Years | 66 (51.2%) | 5 (7.6%) |
| 20 to 24 Years | 125 (67.9%) | 15 (12.0%) |
| 25 to 29 Years | 241 (81.7%) | 0 (0.0%) |
| 30 to 34 Years | 286 (91.4%) | 24 (8.4%) |
| 35 to 44 Years | 257 (70.6%) | 2 (0.8%) |
| 45 to 54 Years | 222 (68.7%) | 9 (4.1%) |
| 55 to 59 Years | 196 (66.4%) | 31 (15.8%) |
| 60 to 64 Years | 127 (55.7%) | 7 (5.5%) |
| 65 to 74 Years | 61 (18.9%) | 6 (9.8%) |
| 75 Years and over | 6 (4.4%) | 0 (0.0%) |
| Total | 1,587 (61.3%) | 100 (6.3%) |
Employment Status by Educational Attainment in Big Lake
According to labor force statistics for Big Lake, 73.1% of individuals (1,329) out of the total population between 25 and 64 years of age (1,818) are in the labor force, with 5.5% or 73 of them being unemployed. The group with the highest labor force participation rate are those with the educational attainment of bachelor's degree or higher, with 84.2% or 271 individuals in the labor force. Within the labor force, individuals with less than high school education have the highest percentage of unemployment, with 17.5% or 7 of them being unemployed.
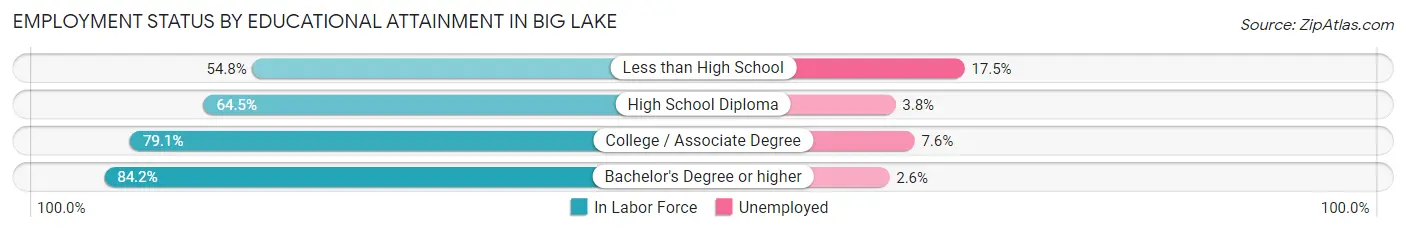
| Educational Attainment | In Labor Force | Unemployed |
| Less than High School | 40 (54.8%) | 13 (17.5%) |
| High School Diploma | 477 (64.5%) | 28 (3.8%) |
| College / Associate Degree | 541 (79.1%) | 52 (7.6%) |
| Bachelor's Degree or higher | 271 (84.2%) | 8 (2.6%) |
| Total | 1,329 (73.1%) | 100 (5.5%) |
Employment Occupations by Sex in Big Lake
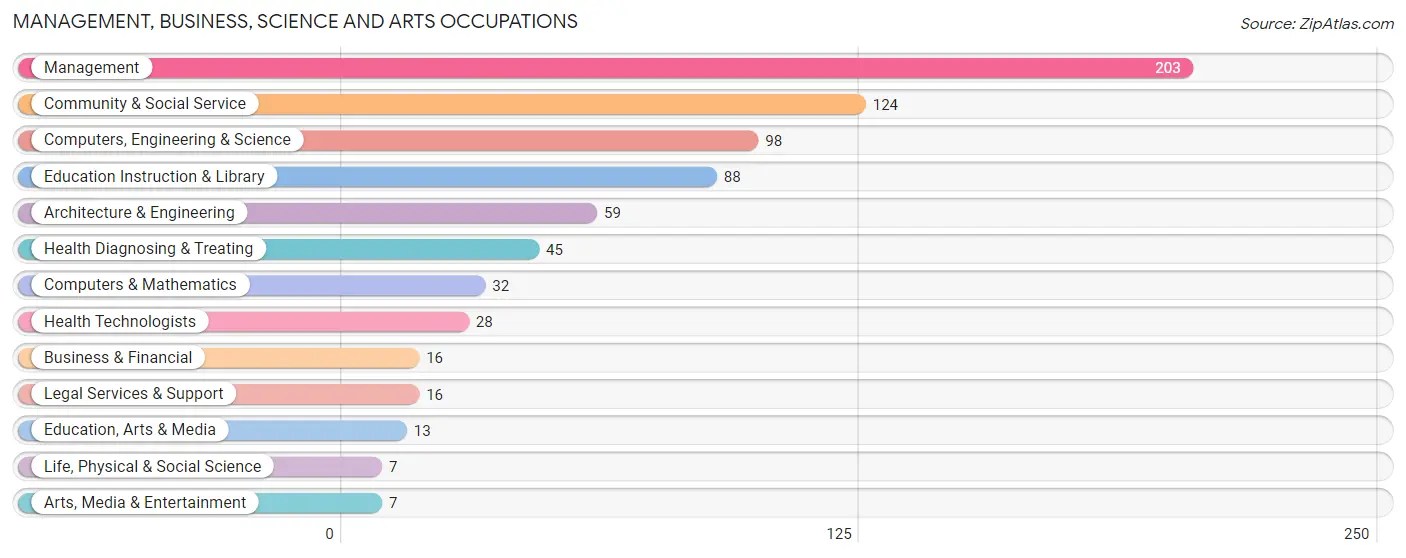
Management, Business, Science and Arts Occupations
The most common Management, Business, Science and Arts occupations in Big Lake are Management (203 | 13.7%), Community & Social Service (124 | 8.4%), Computers, Engineering & Science (98 | 6.6%), Education Instruction & Library (88 | 5.9%), and Architecture & Engineering (59 | 4.0%).
Management, Business, Science and Arts Occupations by Sex
Within the Management, Business, Science and Arts occupations in Big Lake, the most male-oriented occupations are Computers & Mathematics (100.0%), Life, Physical & Social Science (100.0%), and Legal Services & Support (87.5%), while the most female-oriented occupations are Arts, Media & Entertainment (100.0%), Health Diagnosing & Treating (71.1%), and Business & Financial (62.5%).
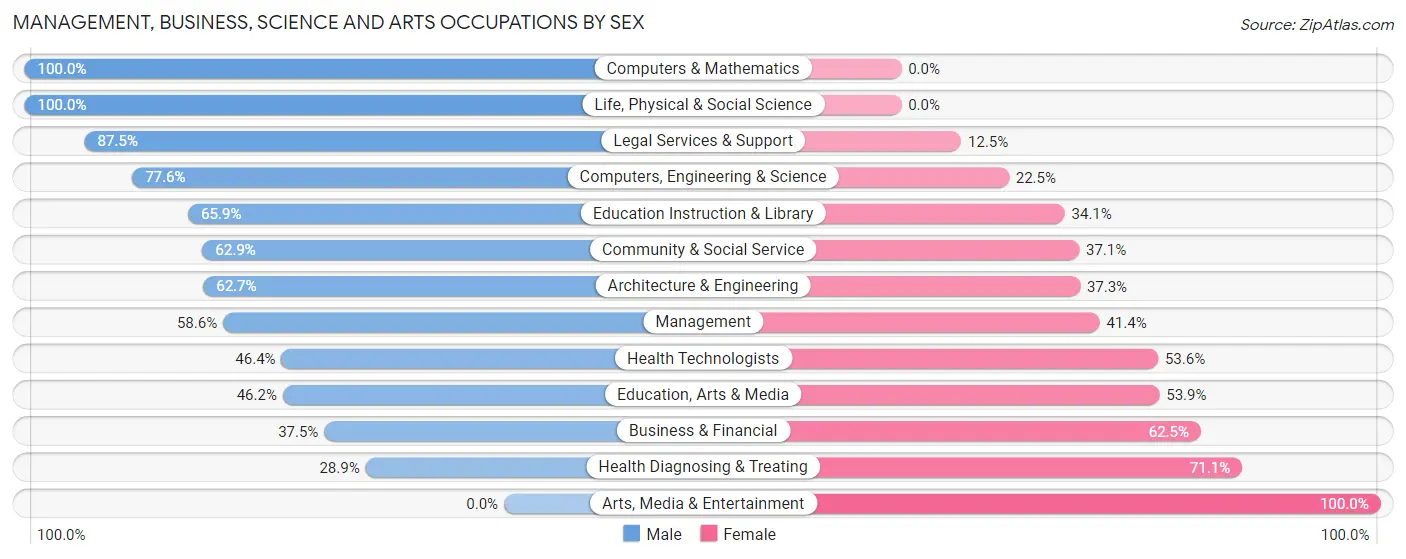
| Occupation | Male | Female |
| Management | 119 (58.6%) | 84 (41.4%) |
| Business & Financial | 6 (37.5%) | 10 (62.5%) |
| Computers, Engineering & Science | 76 (77.5%) | 22 (22.5%) |
| Computers & Mathematics | 32 (100.0%) | 0 (0.0%) |
| Architecture & Engineering | 37 (62.7%) | 22 (37.3%) |
| Life, Physical & Social Science | 7 (100.0%) | 0 (0.0%) |
| Community & Social Service | 78 (62.9%) | 46 (37.1%) |
| Education, Arts & Media | 6 (46.2%) | 7 (53.8%) |
| Legal Services & Support | 14 (87.5%) | 2 (12.5%) |
| Education Instruction & Library | 58 (65.9%) | 30 (34.1%) |
| Arts, Media & Entertainment | 0 (0.0%) | 7 (100.0%) |
| Health Diagnosing & Treating | 13 (28.9%) | 32 (71.1%) |
| Health Technologists | 13 (46.4%) | 15 (53.6%) |
| Total (Category) | 292 (60.1%) | 194 (39.9%) |
| Total (Overall) | 831 (56.1%) | 649 (43.9%) |
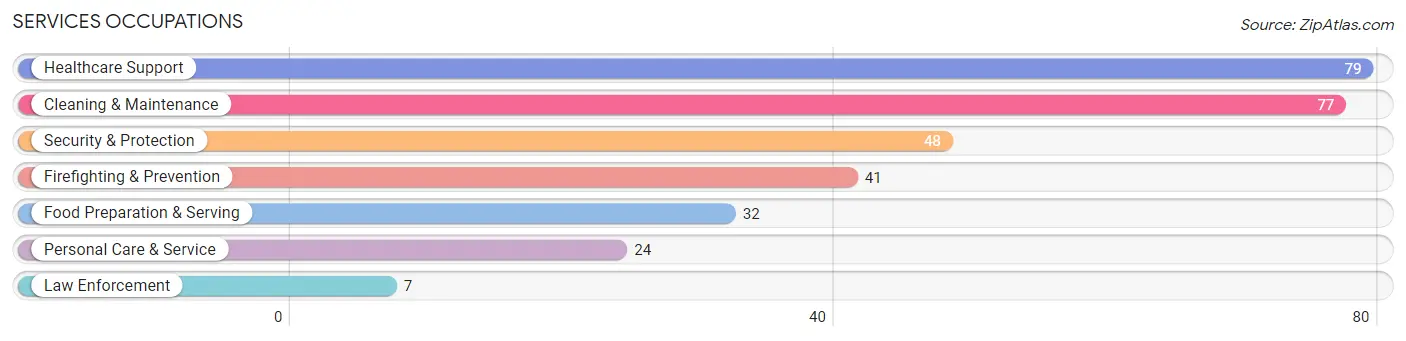
Services Occupations
The most common Services occupations in Big Lake are Healthcare Support (79 | 5.3%), Cleaning & Maintenance (77 | 5.2%), Security & Protection (48 | 3.2%), Firefighting & Prevention (41 | 2.8%), and Food Preparation & Serving (32 | 2.2%).
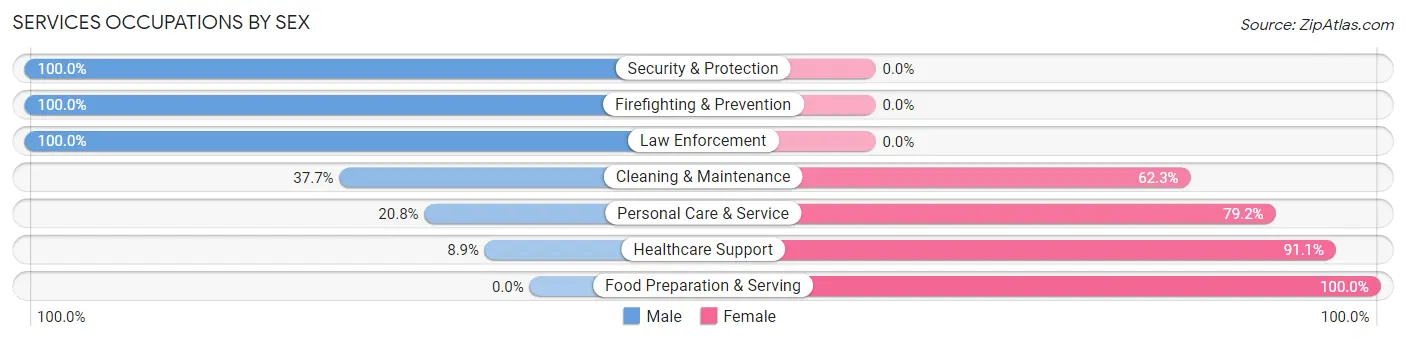
Services Occupations by Sex
Within the Services occupations in Big Lake, the most male-oriented occupations are Security & Protection (100.0%), Firefighting & Prevention (100.0%), and Law Enforcement (100.0%), while the most female-oriented occupations are Food Preparation & Serving (100.0%), Healthcare Support (91.1%), and Personal Care & Service (79.2%).
| Occupation | Male | Female |
| Healthcare Support | 7 (8.9%) | 72 (91.1%) |
| Security & Protection | 48 (100.0%) | 0 (0.0%) |
| Firefighting & Prevention | 41 (100.0%) | 0 (0.0%) |
| Law Enforcement | 7 (100.0%) | 0 (0.0%) |
| Food Preparation & Serving | 0 (0.0%) | 32 (100.0%) |
| Cleaning & Maintenance | 29 (37.7%) | 48 (62.3%) |
| Personal Care & Service | 5 (20.8%) | 19 (79.2%) |
| Total (Category) | 89 (34.2%) | 171 (65.8%) |
| Total (Overall) | 831 (56.1%) | 649 (43.9%) |
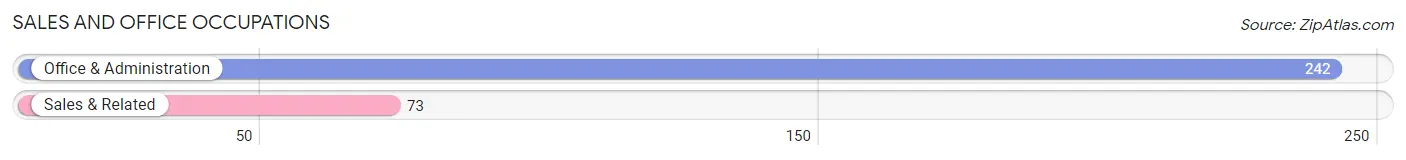
Sales and Office Occupations
The most common Sales and Office occupations in Big Lake are Office & Administration (242 | 16.4%), and Sales & Related (73 | 4.9%).
Sales and Office Occupations by Sex
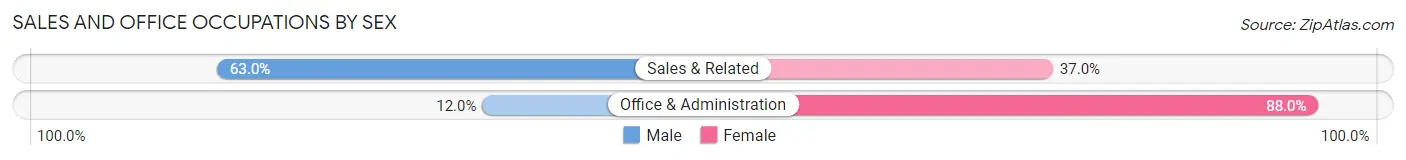
| Occupation | Male | Female |
| Sales & Related | 46 (63.0%) | 27 (37.0%) |
| Office & Administration | 29 (12.0%) | 213 (88.0%) |
| Total (Category) | 75 (23.8%) | 240 (76.2%) |
| Total (Overall) | 831 (56.1%) | 649 (43.9%) |
Natural Resources, Construction and Maintenance Occupations
The most common Natural Resources, Construction and Maintenance occupations in Big Lake are Construction & Extraction (167 | 11.3%), and Installation, Maintenance & Repair (90 | 6.1%).
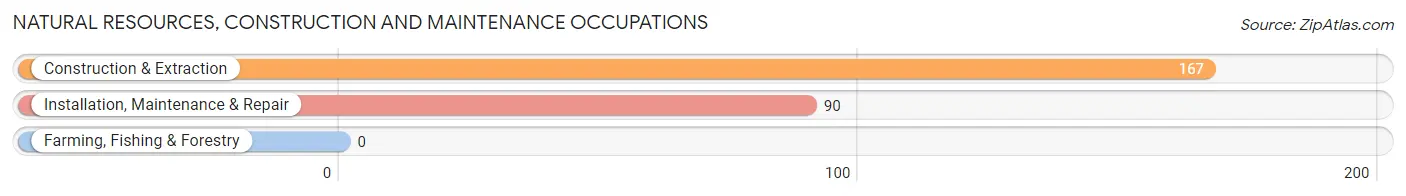
Natural Resources, Construction and Maintenance Occupations by Sex
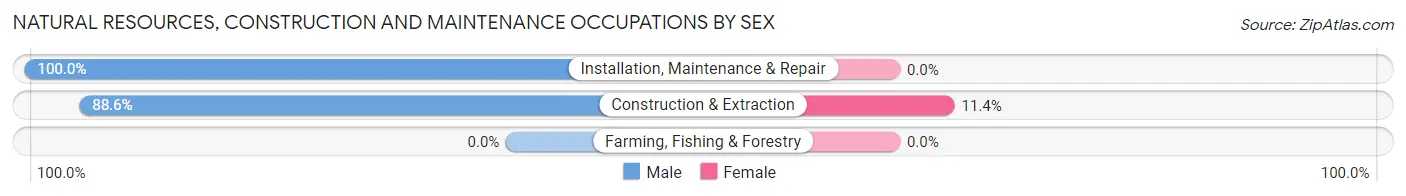
| Occupation | Male | Female |
| Farming, Fishing & Forestry | 0 (0.0%) | 0 (0.0%) |
| Construction & Extraction | 148 (88.6%) | 19 (11.4%) |
| Installation, Maintenance & Repair | 90 (100.0%) | 0 (0.0%) |
| Total (Category) | 238 (92.6%) | 19 (7.4%) |
| Total (Overall) | 831 (56.1%) | 649 (43.9%) |
Production, Transportation and Moving Occupations
The most common Production, Transportation and Moving occupations in Big Lake are Transportation (96 | 6.5%), Production (39 | 2.6%), and Material Moving (27 | 1.8%).
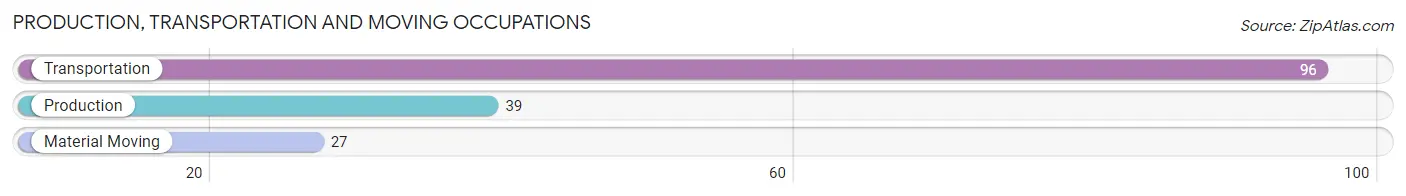
Production, Transportation and Moving Occupations by Sex
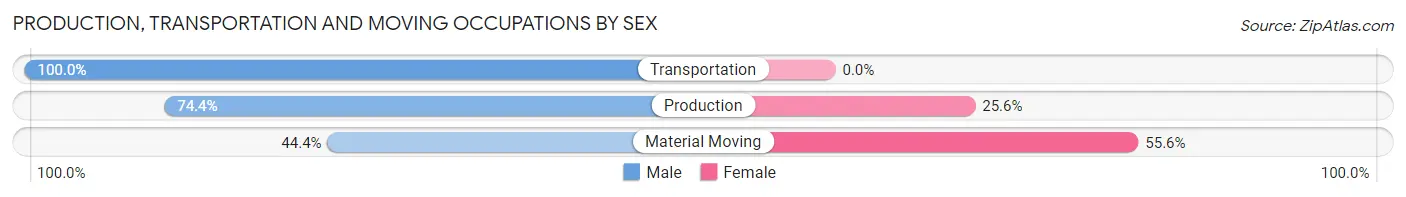
| Occupation | Male | Female |
| Production | 29 (74.4%) | 10 (25.6%) |
| Transportation | 96 (100.0%) | 0 (0.0%) |
| Material Moving | 12 (44.4%) | 15 (55.6%) |
| Total (Category) | 137 (84.6%) | 25 (15.4%) |
| Total (Overall) | 831 (56.1%) | 649 (43.9%) |
Employment Industries by Sex in Big Lake
Employment Industries in Big Lake
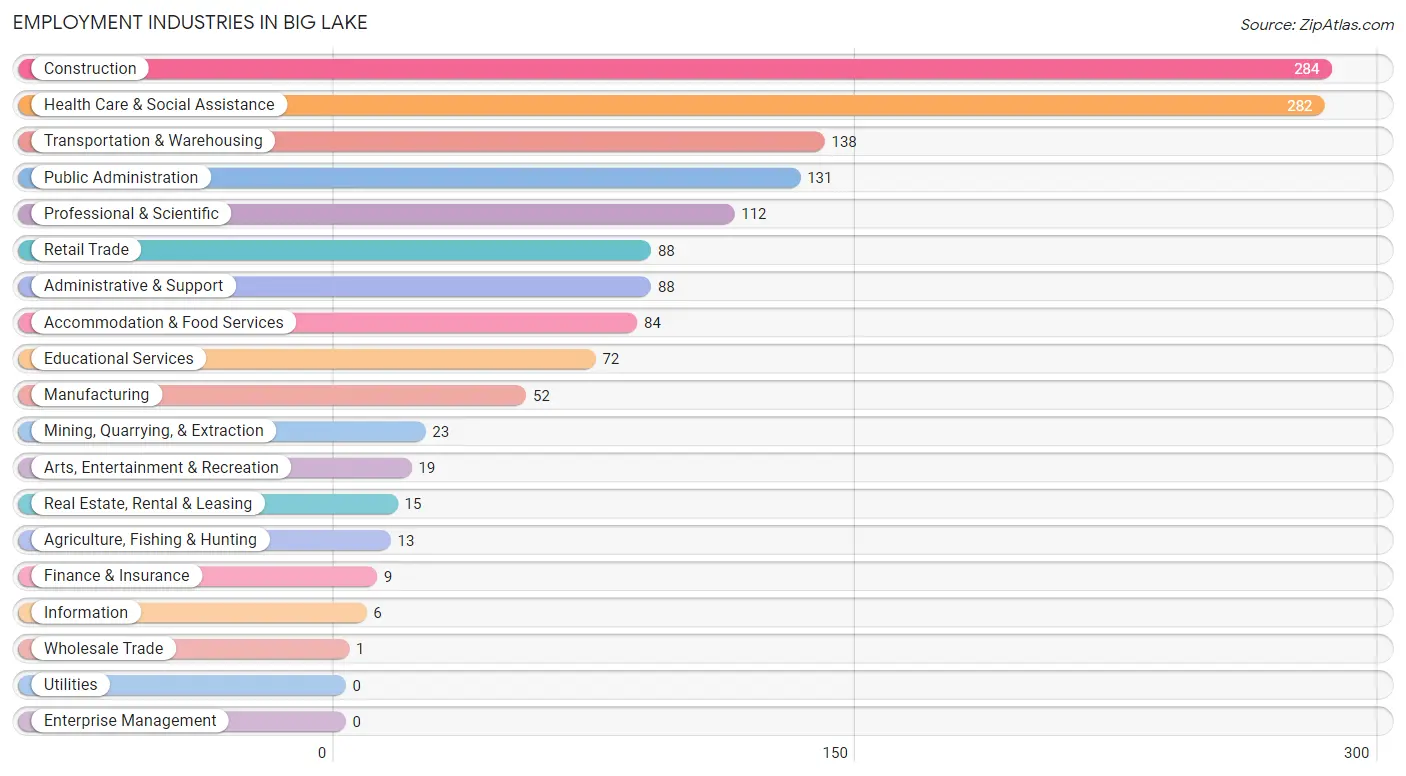
The major employment industries in Big Lake include Construction (284 | 19.2%), Health Care & Social Assistance (282 | 19.1%), Transportation & Warehousing (138 | 9.3%), Public Administration (131 | 8.8%), and Professional & Scientific (112 | 7.6%).
Employment Industries by Sex in Big Lake
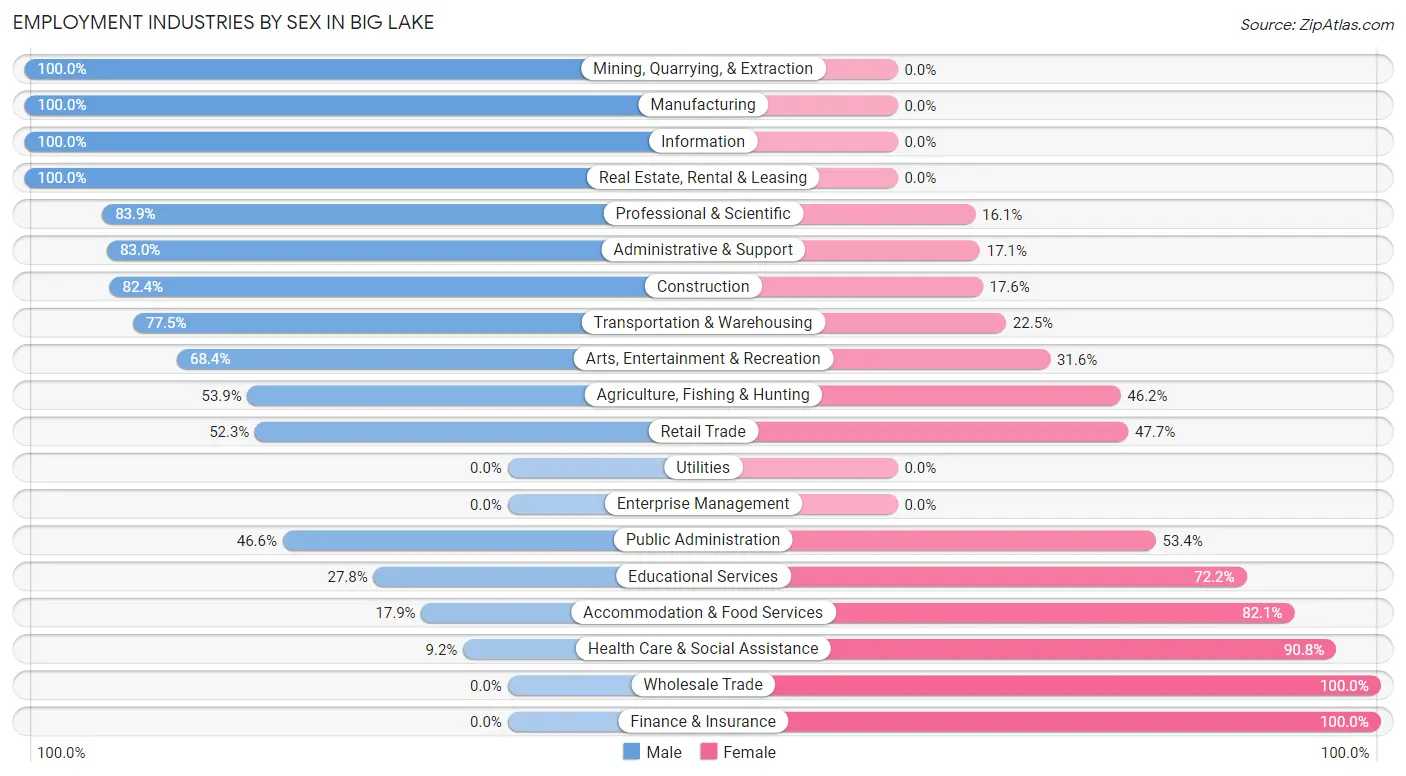
The Big Lake industries that see more men than women are Mining, Quarrying, & Extraction (100.0%), Manufacturing (100.0%), and Information (100.0%), whereas the industries that tend to have a higher number of women are Wholesale Trade (100.0%), Finance & Insurance (100.0%), and Health Care & Social Assistance (90.8%).
| Industry | Male | Female |
| Agriculture, Fishing & Hunting | 7 (53.8%) | 6 (46.2%) |
| Mining, Quarrying, & Extraction | 23 (100.0%) | 0 (0.0%) |
| Construction | 234 (82.4%) | 50 (17.6%) |
| Manufacturing | 52 (100.0%) | 0 (0.0%) |
| Wholesale Trade | 0 (0.0%) | 1 (100.0%) |
| Retail Trade | 46 (52.3%) | 42 (47.7%) |
| Transportation & Warehousing | 107 (77.5%) | 31 (22.5%) |
| Utilities | 0 (0.0%) | 0 (0.0%) |
| Information | 6 (100.0%) | 0 (0.0%) |
| Finance & Insurance | 0 (0.0%) | 9 (100.0%) |
| Real Estate, Rental & Leasing | 15 (100.0%) | 0 (0.0%) |
| Professional & Scientific | 94 (83.9%) | 18 (16.1%) |
| Enterprise Management | 0 (0.0%) | 0 (0.0%) |
| Administrative & Support | 73 (83.0%) | 15 (17.1%) |
| Educational Services | 20 (27.8%) | 52 (72.2%) |
| Health Care & Social Assistance | 26 (9.2%) | 256 (90.8%) |
| Arts, Entertainment & Recreation | 13 (68.4%) | 6 (31.6%) |
| Accommodation & Food Services | 15 (17.9%) | 69 (82.1%) |
| Public Administration | 61 (46.6%) | 70 (53.4%) |
| Total | 831 (56.1%) | 649 (43.9%) |
Education in Big Lake
School Enrollment in Big Lake
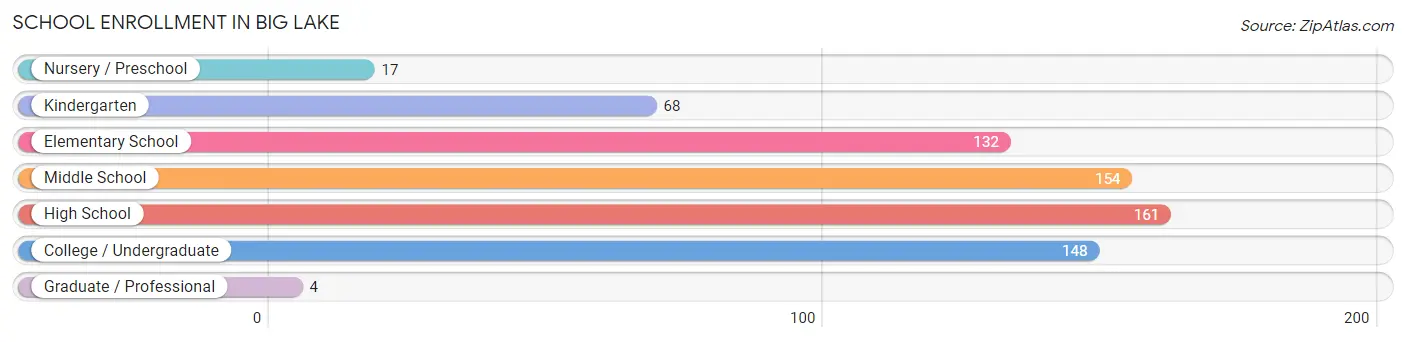
The most common levels of schooling among the 684 students in Big Lake are high school (161 | 23.5%), middle school (154 | 22.5%), and college / undergraduate (148 | 21.6%).
| School Level | # Students | % Students |
| Nursery / Preschool | 17 | 2.5% |
| Kindergarten | 68 | 9.9% |
| Elementary School | 132 | 19.3% |
| Middle School | 154 | 22.5% |
| High School | 161 | 23.5% |
| College / Undergraduate | 148 | 21.6% |
| Graduate / Professional | 4 | 0.6% |
| Total | 684 | 100.0% |
School Enrollment by Age by Funding Source in Big Lake
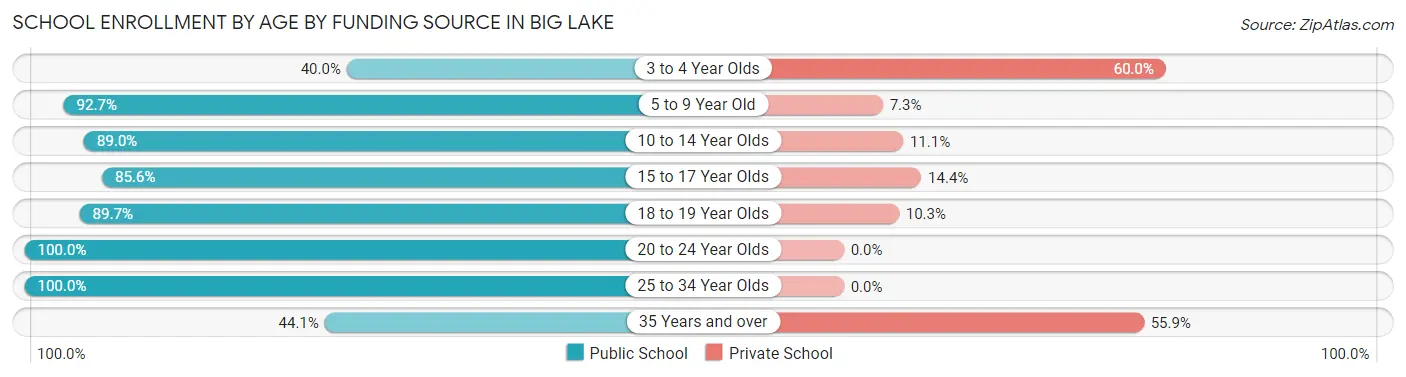
Out of a total of 684 students who are enrolled in schools in Big Lake, 78 (11.4%) attend a private institution, while the remaining 606 (88.6%) are enrolled in public schools. The age group of 3 to 4 year olds has the highest likelihood of being enrolled in private schools, with 6 (60.0% in the age bracket) enrolled. Conversely, the age group of 20 to 24 year olds has the lowest likelihood of being enrolled in a private school, with 30 (100.0% in the age bracket) attending a public institution.
| Age Bracket | Public School | Private School |
| 3 to 4 Year Olds | 4 (40.0%) | 6 (60.0%) |
| 5 to 9 Year Old | 204 (92.7%) | 16 (7.3%) |
| 10 to 14 Year Olds | 153 (88.9%) | 19 (11.1%) |
| 15 to 17 Year Olds | 83 (85.6%) | 14 (14.4%) |
| 18 to 19 Year Olds | 35 (89.7%) | 4 (10.3%) |
| 20 to 24 Year Olds | 30 (100.0%) | 0 (0.0%) |
| 25 to 34 Year Olds | 82 (100.0%) | 0 (0.0%) |
| 35 Years and over | 15 (44.1%) | 19 (55.9%) |
| Total | 606 (88.6%) | 78 (11.4%) |
Educational Attainment by Field of Study in Big Lake
Liberal arts & history (161 | 35.4%), business (67 | 14.7%), education (46 | 10.1%), arts & humanities (41 | 9.0%), and science & technology (29 | 6.4%) are the most common fields of study among 455 individuals in Big Lake who have obtained a bachelor's degree or higher.
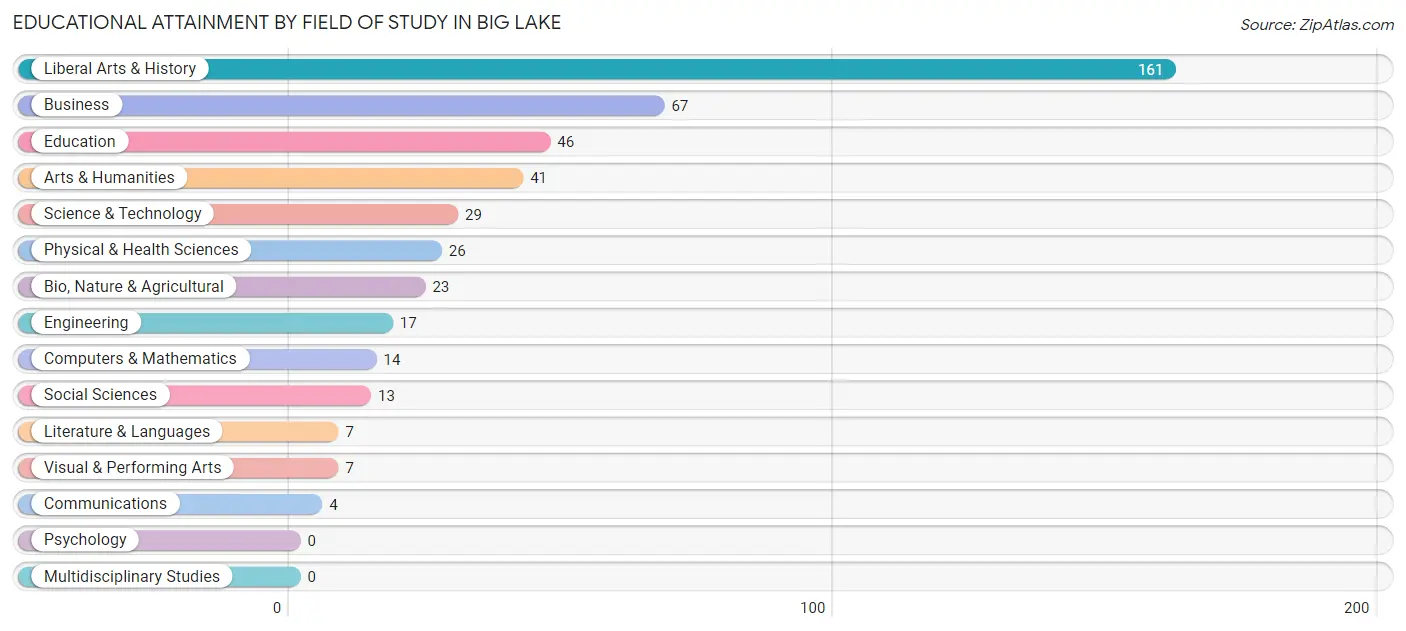
| Field of Study | # Graduates | % Graduates |
| Computers & Mathematics | 14 | 3.1% |
| Bio, Nature & Agricultural | 23 | 5.1% |
| Physical & Health Sciences | 26 | 5.7% |
| Psychology | 0 | 0.0% |
| Social Sciences | 13 | 2.9% |
| Engineering | 17 | 3.7% |
| Multidisciplinary Studies | 0 | 0.0% |
| Science & Technology | 29 | 6.4% |
| Business | 67 | 14.7% |
| Education | 46 | 10.1% |
| Literature & Languages | 7 | 1.5% |
| Liberal Arts & History | 161 | 35.4% |
| Visual & Performing Arts | 7 | 1.5% |
| Communications | 4 | 0.9% |
| Arts & Humanities | 41 | 9.0% |
| Total | 455 | 100.0% |
Transportation & Commute in Big Lake
Vehicle Availability by Sex in Big Lake
The most prevalent vehicle ownership categories in Big Lake are males with 2 vehicles (481, accounting for 58.9%) and females with 2 vehicles (358, making up 77.5%).
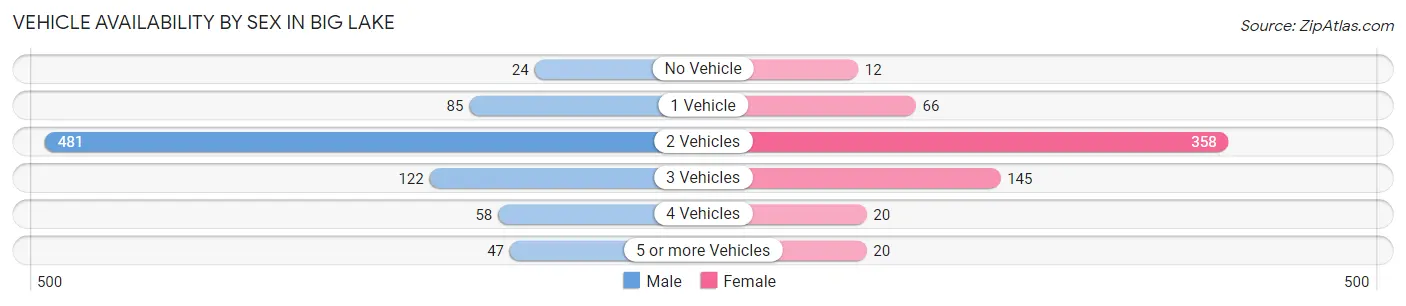
| Vehicles Available | Male | Female |
| No Vehicle | 24 (2.9%) | 12 (1.9%) |
| 1 Vehicle | 85 (10.4%) | 66 (10.6%) |
| 2 Vehicles | 481 (58.9%) | 358 (57.7%) |
| 3 Vehicles | 122 (14.9%) | 145 (23.4%) |
| 4 Vehicles | 58 (7.1%) | 20 (3.2%) |
| 5 or more Vehicles | 47 (5.8%) | 20 (3.2%) |
| Total | 817 (100.0%) | 621 (100.0%) |
Commute Time in Big Lake
The most frequently occuring commute durations in Big Lake are 30 to 34 minutes (219 commuters, 19.8%), 60 to 89 minutes (193 commuters, 17.4%), and 90 or more minutes (124 commuters, 11.2%).
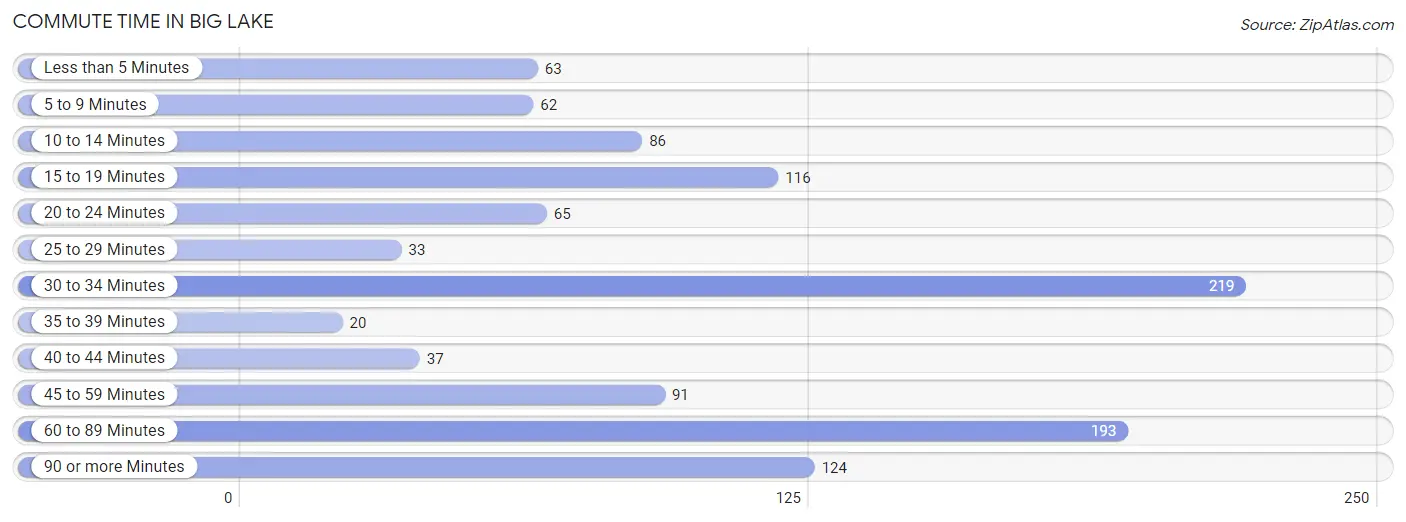
| Commute Time | # Commuters | % Commuters |
| Less than 5 Minutes | 63 | 5.7% |
| 5 to 9 Minutes | 62 | 5.6% |
| 10 to 14 Minutes | 86 | 7.7% |
| 15 to 19 Minutes | 116 | 10.5% |
| 20 to 24 Minutes | 65 | 5.9% |
| 25 to 29 Minutes | 33 | 3.0% |
| 30 to 34 Minutes | 219 | 19.8% |
| 35 to 39 Minutes | 20 | 1.8% |
| 40 to 44 Minutes | 37 | 3.3% |
| 45 to 59 Minutes | 91 | 8.2% |
| 60 to 89 Minutes | 193 | 17.4% |
| 90 or more Minutes | 124 | 11.2% |
Commute Time by Sex in Big Lake
The most common commute times in Big Lake are 30 to 34 minutes (156 commuters, 24.4%) for males and 15 to 19 minutes (88 commuters, 18.8%) for females.
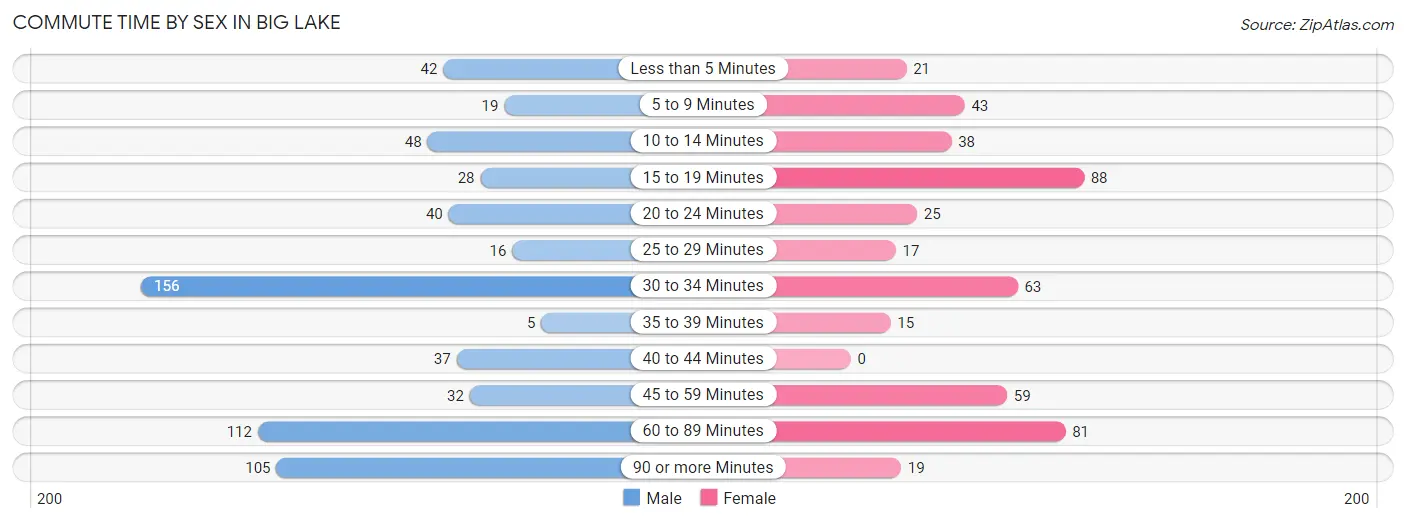
| Commute Time | Male | Female |
| Less than 5 Minutes | 42 (6.6%) | 21 (4.5%) |
| 5 to 9 Minutes | 19 (3.0%) | 43 (9.2%) |
| 10 to 14 Minutes | 48 (7.5%) | 38 (8.1%) |
| 15 to 19 Minutes | 28 (4.4%) | 88 (18.8%) |
| 20 to 24 Minutes | 40 (6.2%) | 25 (5.3%) |
| 25 to 29 Minutes | 16 (2.5%) | 17 (3.6%) |
| 30 to 34 Minutes | 156 (24.4%) | 63 (13.4%) |
| 35 to 39 Minutes | 5 (0.8%) | 15 (3.2%) |
| 40 to 44 Minutes | 37 (5.8%) | 0 (0.0%) |
| 45 to 59 Minutes | 32 (5.0%) | 59 (12.6%) |
| 60 to 89 Minutes | 112 (17.5%) | 81 (17.3%) |
| 90 or more Minutes | 105 (16.4%) | 19 (4.1%) |
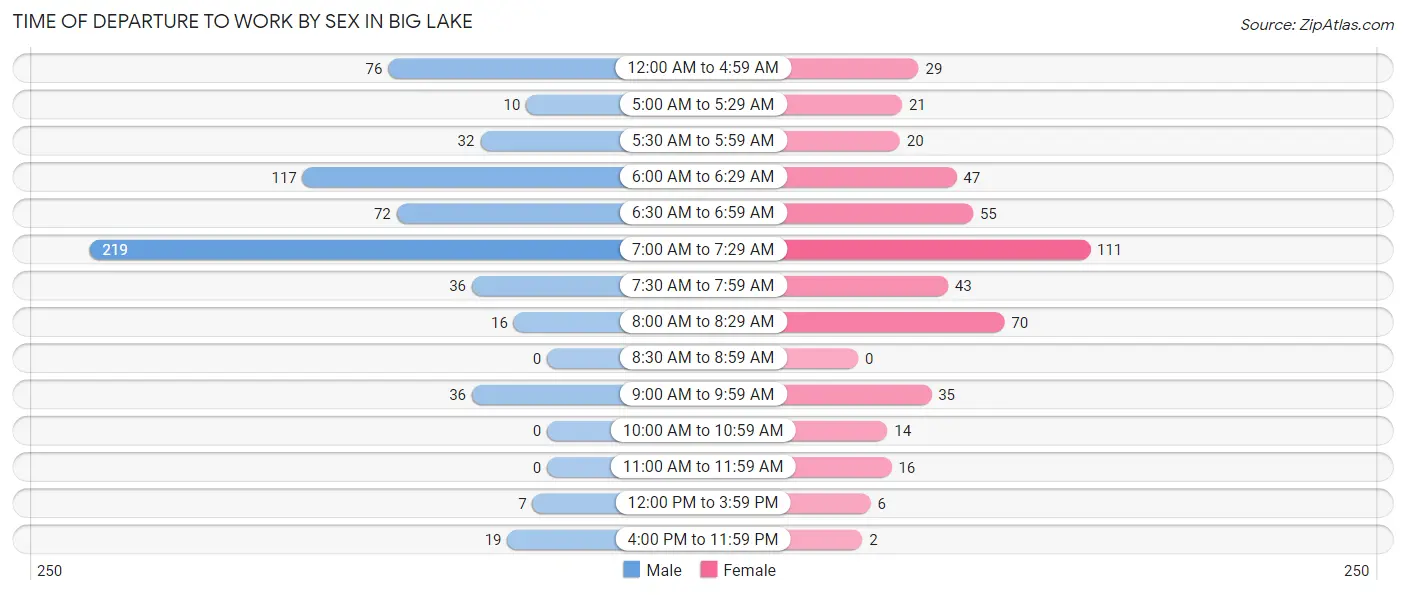
Time of Departure to Work by Sex in Big Lake
The most frequent times of departure to work in Big Lake are 7:00 AM to 7:29 AM (219, 34.2%) for males and 7:00 AM to 7:29 AM (111, 23.7%) for females.
| Time of Departure | Male | Female |
| 12:00 AM to 4:59 AM | 76 (11.9%) | 29 (6.2%) |
| 5:00 AM to 5:29 AM | 10 (1.6%) | 21 (4.5%) |
| 5:30 AM to 5:59 AM | 32 (5.0%) | 20 (4.3%) |
| 6:00 AM to 6:29 AM | 117 (18.3%) | 47 (10.0%) |
| 6:30 AM to 6:59 AM | 72 (11.3%) | 55 (11.7%) |
| 7:00 AM to 7:29 AM | 219 (34.2%) | 111 (23.7%) |
| 7:30 AM to 7:59 AM | 36 (5.6%) | 43 (9.2%) |
| 8:00 AM to 8:29 AM | 16 (2.5%) | 70 (14.9%) |
| 8:30 AM to 8:59 AM | 0 (0.0%) | 0 (0.0%) |
| 9:00 AM to 9:59 AM | 36 (5.6%) | 35 (7.5%) |
| 10:00 AM to 10:59 AM | 0 (0.0%) | 14 (3.0%) |
| 11:00 AM to 11:59 AM | 0 (0.0%) | 16 (3.4%) |
| 12:00 PM to 3:59 PM | 7 (1.1%) | 6 (1.3%) |
| 4:00 PM to 11:59 PM | 19 (3.0%) | 2 (0.4%) |
| Total | 640 (100.0%) | 469 (100.0%) |
Housing Occupancy in Big Lake
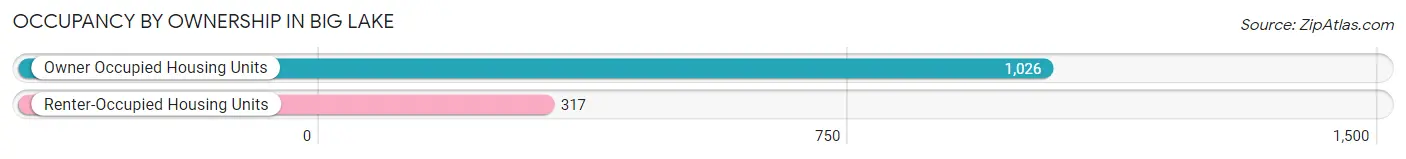
Occupancy by Ownership in Big Lake
Of the total 1,343 dwellings in Big Lake, owner-occupied units account for 1,026 (76.4%), while renter-occupied units make up 317 (23.6%).
| Occupancy | # Housing Units | % Housing Units |
| Owner Occupied Housing Units | 1,026 | 76.4% |
| Renter-Occupied Housing Units | 317 | 23.6% |
| Total Occupied Housing Units | 1,343 | 100.0% |
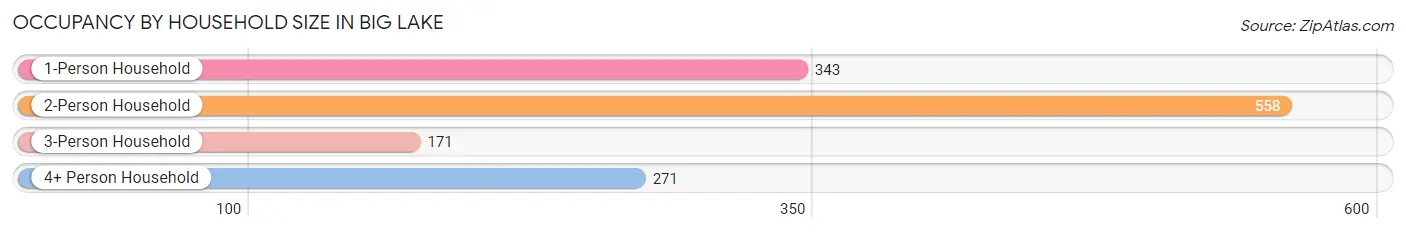
Occupancy by Household Size in Big Lake
| Household Size | # Housing Units | % Housing Units |
| 1-Person Household | 343 | 25.5% |
| 2-Person Household | 558 | 41.5% |
| 3-Person Household | 171 | 12.7% |
| 4+ Person Household | 271 | 20.2% |
| Total Housing Units | 1,343 | 100.0% |
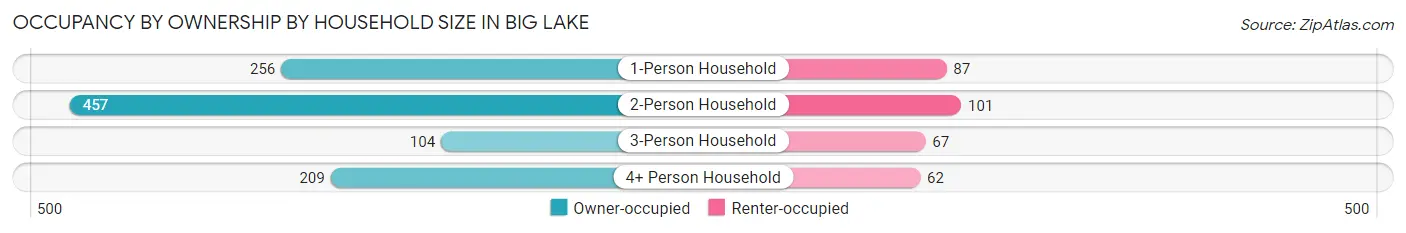
Occupancy by Ownership by Household Size in Big Lake
| Household Size | Owner-occupied | Renter-occupied |
| 1-Person Household | 256 (74.6%) | 87 (25.4%) |
| 2-Person Household | 457 (81.9%) | 101 (18.1%) |
| 3-Person Household | 104 (60.8%) | 67 (39.2%) |
| 4+ Person Household | 209 (77.1%) | 62 (22.9%) |
| Total Housing Units | 1,026 (76.4%) | 317 (23.6%) |
Occupancy by Educational Attainment in Big Lake
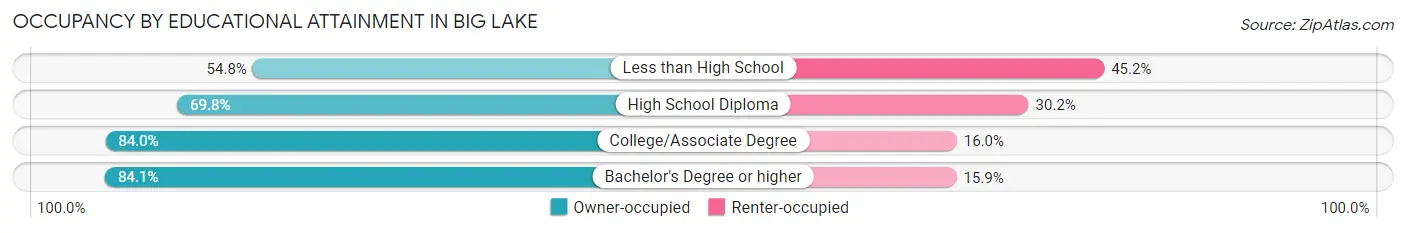
| Household Size | Owner-occupied | Renter-occupied |
| Less than High School | 40 (54.8%) | 33 (45.2%) |
| High School Diploma | 397 (69.8%) | 172 (30.2%) |
| College/Associate Degree | 378 (84.0%) | 72 (16.0%) |
| Bachelor's Degree or higher | 211 (84.1%) | 40 (15.9%) |
Occupancy by Age of Householder in Big Lake
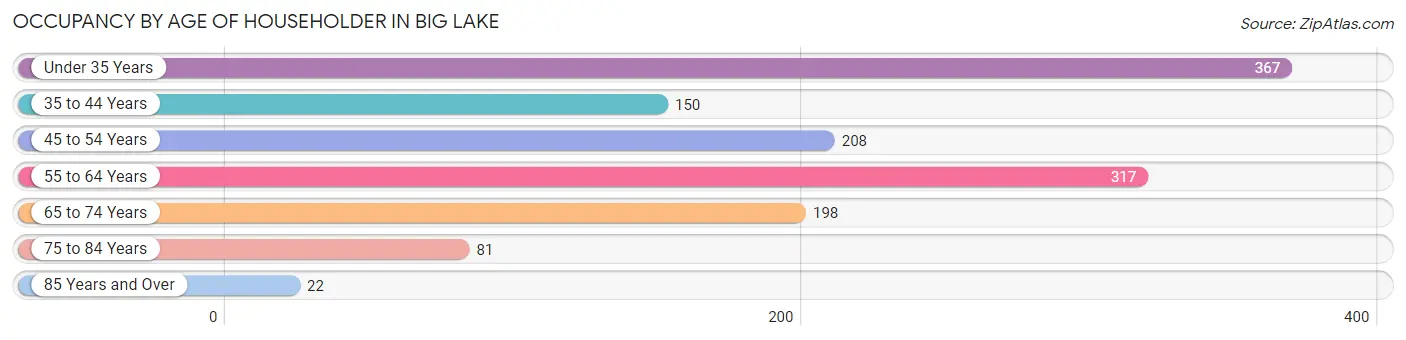
| Age Bracket | # Households | % Households |
| Under 35 Years | 367 | 27.3% |
| 35 to 44 Years | 150 | 11.2% |
| 45 to 54 Years | 208 | 15.5% |
| 55 to 64 Years | 317 | 23.6% |
| 65 to 74 Years | 198 | 14.7% |
| 75 to 84 Years | 81 | 6.0% |
| 85 Years and Over | 22 | 1.6% |
| Total | 1,343 | 100.0% |
Housing Finances in Big Lake
Median Income by Occupancy in Big Lake
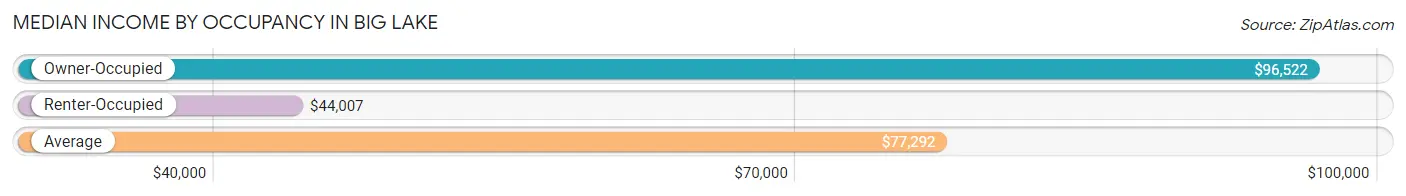
| Occupancy Type | # Households | Median Income |
| Owner-Occupied | 1,026 (76.4%) | $96,522 |
| Renter-Occupied | 317 (23.6%) | $44,007 |
| Average | 1,343 (100.0%) | $77,292 |
Occupancy by Householder Income Bracket in Big Lake
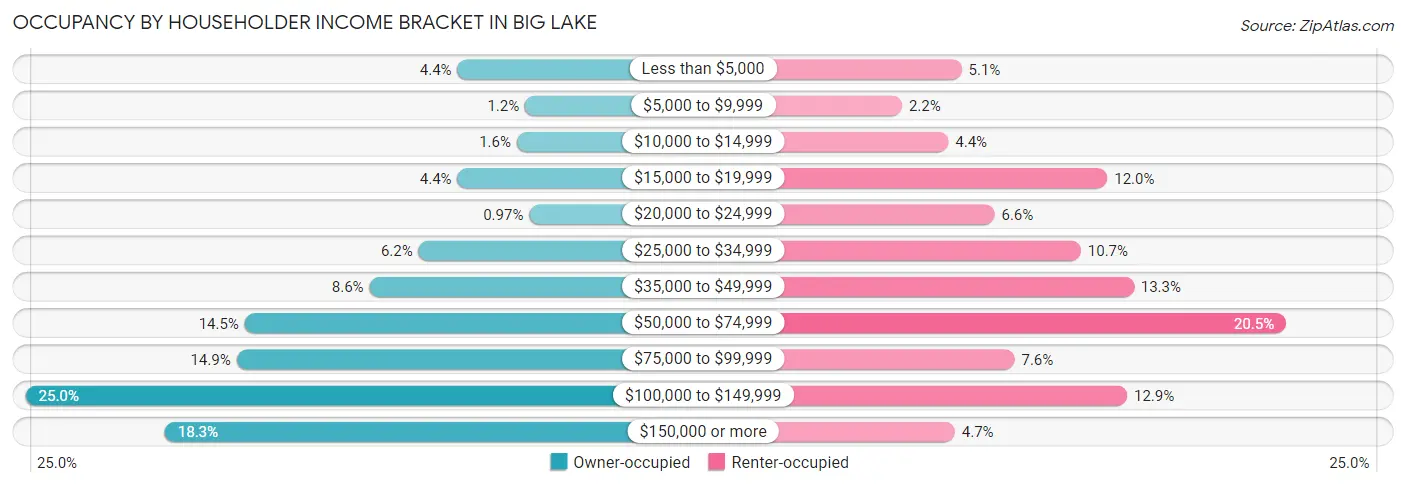
| Income Bracket | Owner-occupied | Renter-occupied |
| Less than $5,000 | 45 (4.4%) | 16 (5.1%) |
| $5,000 to $9,999 | 12 (1.2%) | 7 (2.2%) |
| $10,000 to $14,999 | 16 (1.6%) | 14 (4.4%) |
| $15,000 to $19,999 | 45 (4.4%) | 38 (12.0%) |
| $20,000 to $24,999 | 10 (1.0%) | 21 (6.6%) |
| $25,000 to $34,999 | 64 (6.2%) | 34 (10.7%) |
| $35,000 to $49,999 | 88 (8.6%) | 42 (13.3%) |
| $50,000 to $74,999 | 149 (14.5%) | 65 (20.5%) |
| $75,000 to $99,999 | 153 (14.9%) | 24 (7.6%) |
| $100,000 to $149,999 | 256 (24.9%) | 41 (12.9%) |
| $150,000 or more | 188 (18.3%) | 15 (4.7%) |
| Total | 1,026 (100.0%) | 317 (100.0%) |
Monthly Housing Cost Tiers in Big Lake
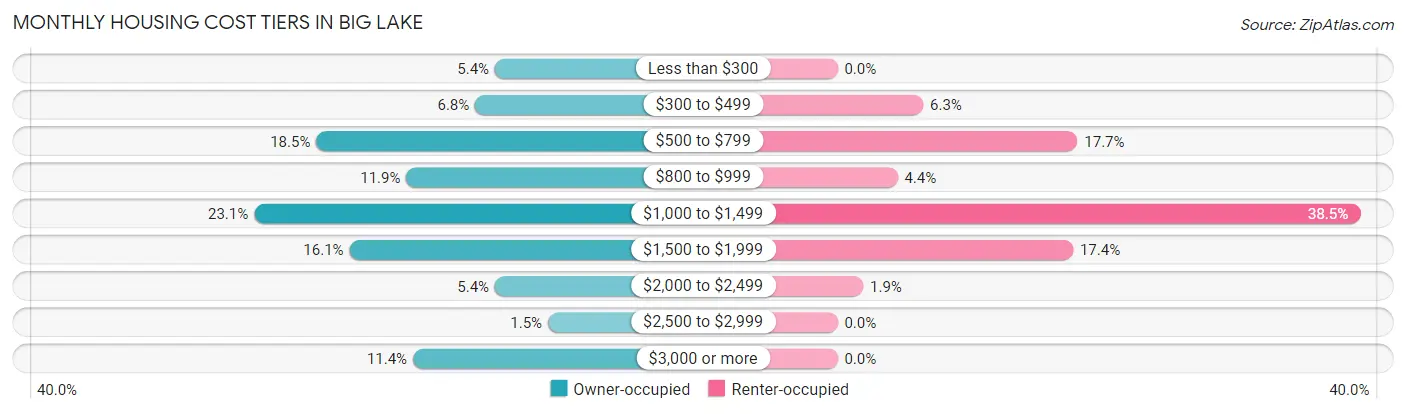
| Monthly Cost | Owner-occupied | Renter-occupied |
| Less than $300 | 55 (5.4%) | 0 (0.0%) |
| $300 to $499 | 70 (6.8%) | 20 (6.3%) |
| $500 to $799 | 190 (18.5%) | 56 (17.7%) |
| $800 to $999 | 122 (11.9%) | 14 (4.4%) |
| $1,000 to $1,499 | 237 (23.1%) | 122 (38.5%) |
| $1,500 to $1,999 | 165 (16.1%) | 55 (17.3%) |
| $2,000 to $2,499 | 55 (5.4%) | 6 (1.9%) |
| $2,500 to $2,999 | 15 (1.5%) | 0 (0.0%) |
| $3,000 or more | 117 (11.4%) | 0 (0.0%) |
| Total | 1,026 (100.0%) | 317 (100.0%) |
Physical Housing Characteristics in Big Lake
Housing Structures in Big Lake
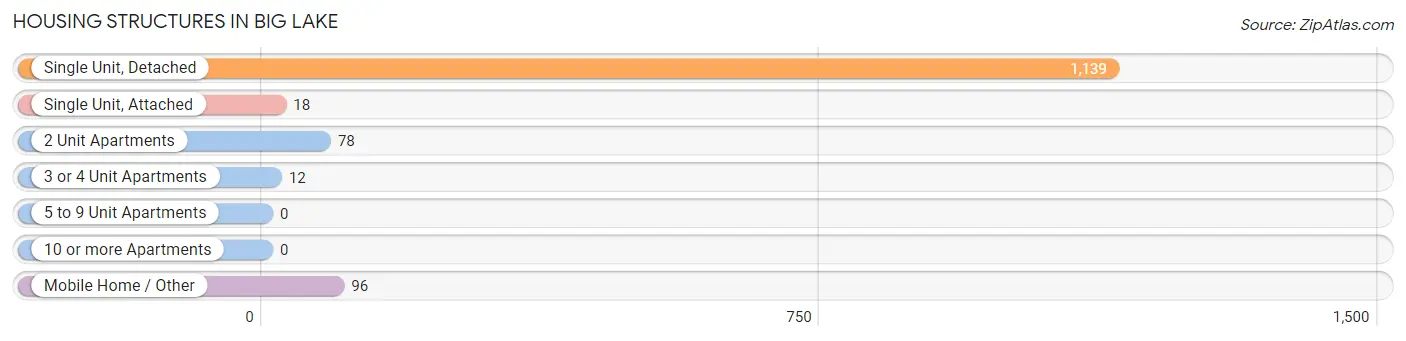
| Structure Type | # Housing Units | % Housing Units |
| Single Unit, Detached | 1,139 | 84.8% |
| Single Unit, Attached | 18 | 1.3% |
| 2 Unit Apartments | 78 | 5.8% |
| 3 or 4 Unit Apartments | 12 | 0.9% |
| 5 to 9 Unit Apartments | 0 | 0.0% |
| 10 or more Apartments | 0 | 0.0% |
| Mobile Home / Other | 96 | 7.1% |
| Total | 1,343 | 100.0% |
Housing Structures by Occupancy in Big Lake
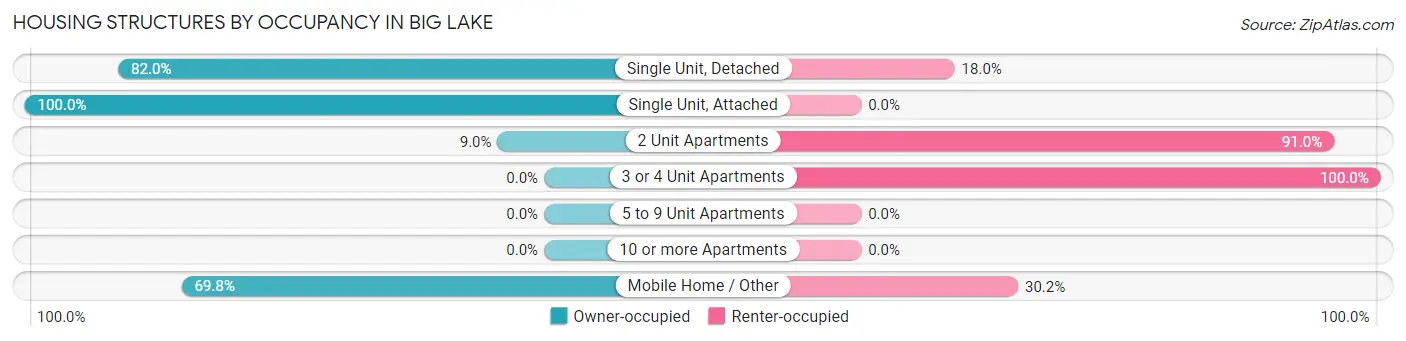
| Structure Type | Owner-occupied | Renter-occupied |
| Single Unit, Detached | 934 (82.0%) | 205 (18.0%) |
| Single Unit, Attached | 18 (100.0%) | 0 (0.0%) |
| 2 Unit Apartments | 7 (9.0%) | 71 (91.0%) |
| 3 or 4 Unit Apartments | 0 (0.0%) | 12 (100.0%) |
| 5 to 9 Unit Apartments | 0 (0.0%) | 0 (0.0%) |
| 10 or more Apartments | 0 (0.0%) | 0 (0.0%) |
| Mobile Home / Other | 67 (69.8%) | 29 (30.2%) |
| Total | 1,026 (76.4%) | 317 (23.6%) |
Housing Structures by Number of Rooms in Big Lake
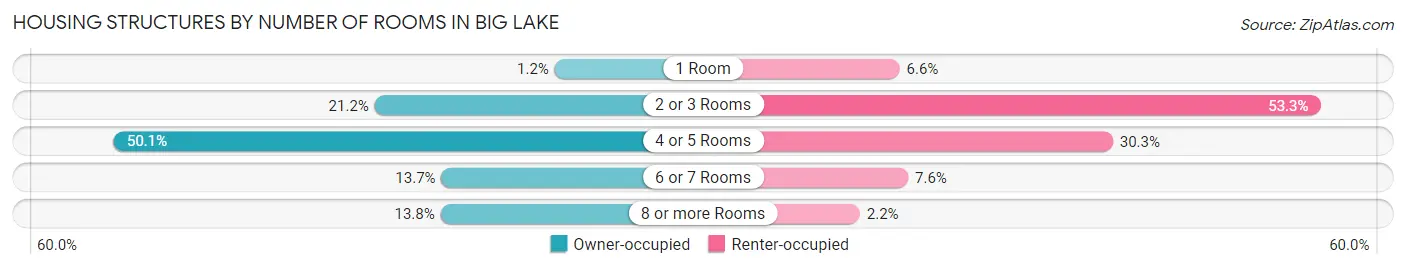
| Number of Rooms | Owner-occupied | Renter-occupied |
| 1 Room | 12 (1.2%) | 21 (6.6%) |
| 2 or 3 Rooms | 217 (21.1%) | 169 (53.3%) |
| 4 or 5 Rooms | 514 (50.1%) | 96 (30.3%) |
| 6 or 7 Rooms | 141 (13.7%) | 24 (7.6%) |
| 8 or more Rooms | 142 (13.8%) | 7 (2.2%) |
| Total | 1,026 (100.0%) | 317 (100.0%) |
Housing Structure by Heating Type in Big Lake
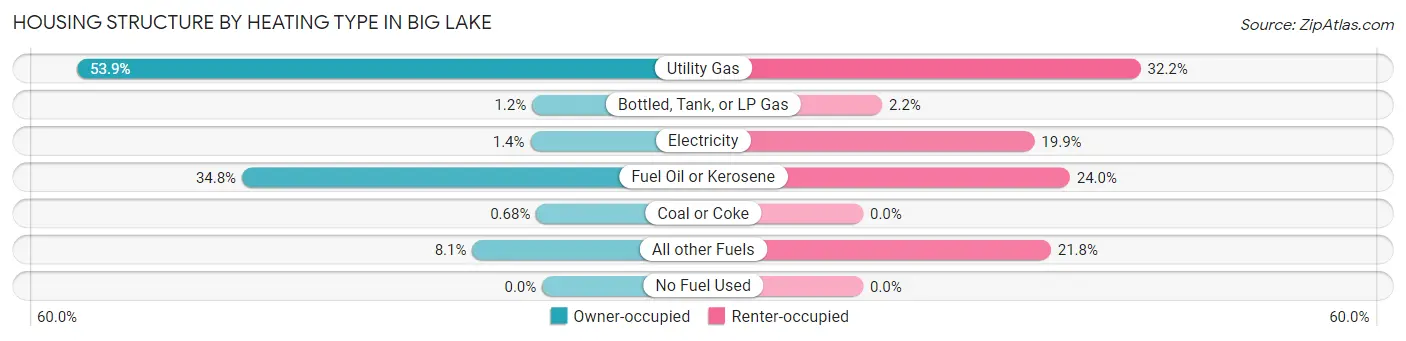
| Heating Type | Owner-occupied | Renter-occupied |
| Utility Gas | 553 (53.9%) | 102 (32.2%) |
| Bottled, Tank, or LP Gas | 12 (1.2%) | 7 (2.2%) |
| Electricity | 14 (1.4%) | 63 (19.9%) |
| Fuel Oil or Kerosene | 357 (34.8%) | 76 (24.0%) |
| Coal or Coke | 7 (0.7%) | 0 (0.0%) |
| All other Fuels | 83 (8.1%) | 69 (21.8%) |
| No Fuel Used | 0 (0.0%) | 0 (0.0%) |
| Total | 1,026 (100.0%) | 317 (100.0%) |
Household Vehicle Usage in Big Lake
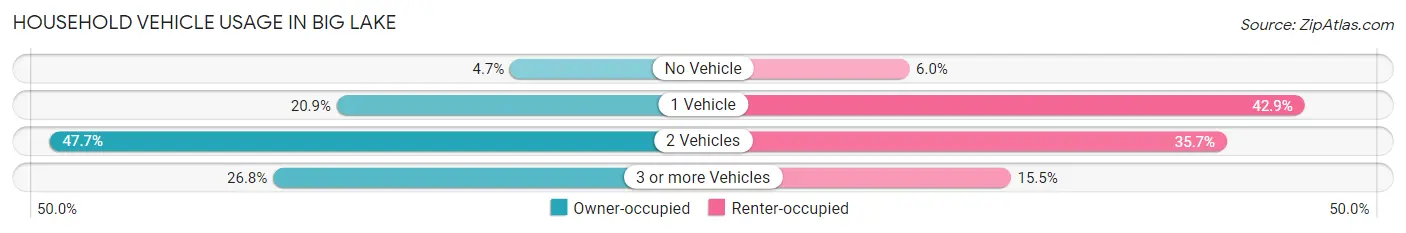
| Vehicles per Household | Owner-occupied | Renter-occupied |
| No Vehicle | 48 (4.7%) | 19 (6.0%) |
| 1 Vehicle | 214 (20.9%) | 136 (42.9%) |
| 2 Vehicles | 489 (47.7%) | 113 (35.6%) |
| 3 or more Vehicles | 275 (26.8%) | 49 (15.5%) |
| Total | 1,026 (100.0%) | 317 (100.0%) |
Real Estate & Mortgages in Big Lake
Real Estate and Mortgage Overview in Big Lake
| Characteristic | Without Mortgage | With Mortgage |
| Housing Units | 438 | 588 |
| Median Property Value | $249,200 | $280,300 |
| Median Household Income | $77,679 | $100 |
| Monthly Housing Costs | $739 | $117 |
| Real Estate Taxes | $2,842 | $104 |
Property Value by Mortgage Status in Big Lake
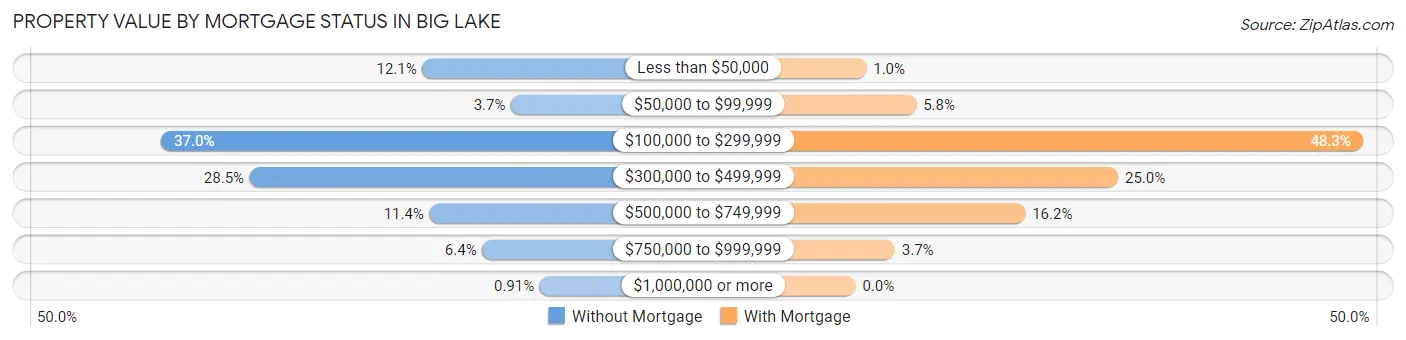
| Property Value | Without Mortgage | With Mortgage |
| Less than $50,000 | 53 (12.1%) | 6 (1.0%) |
| $50,000 to $99,999 | 16 (3.6%) | 34 (5.8%) |
| $100,000 to $299,999 | 162 (37.0%) | 284 (48.3%) |
| $300,000 to $499,999 | 125 (28.5%) | 147 (25.0%) |
| $500,000 to $749,999 | 50 (11.4%) | 95 (16.2%) |
| $750,000 to $999,999 | 28 (6.4%) | 22 (3.7%) |
| $1,000,000 or more | 4 (0.9%) | 0 (0.0%) |
| Total | 438 (100.0%) | 588 (100.0%) |
Household Income by Mortgage Status in Big Lake
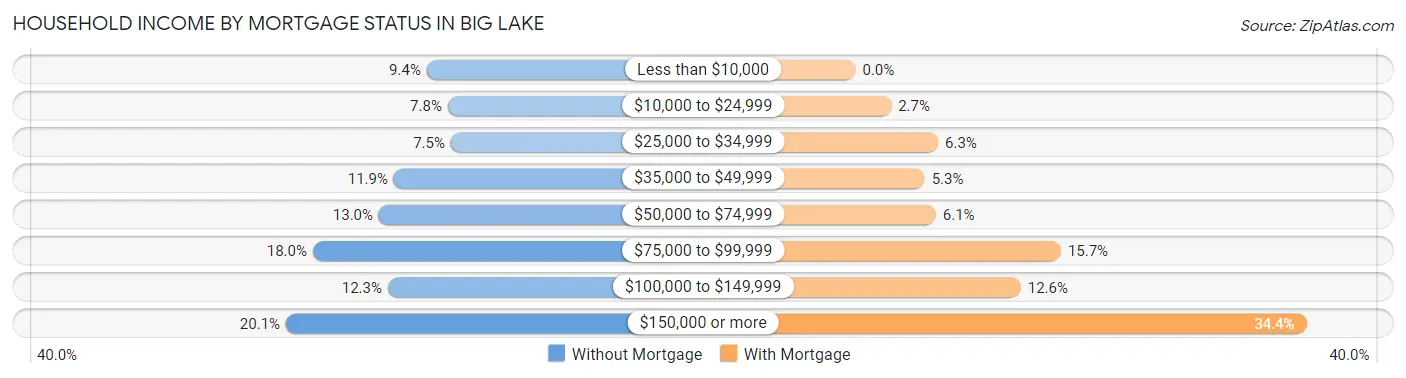
| Household Income | Without Mortgage | With Mortgage |
| Less than $10,000 | 41 (9.4%) | 0 (0.0%) |
| $10,000 to $24,999 | 34 (7.8%) | 16 (2.7%) |
| $25,000 to $34,999 | 33 (7.5%) | 37 (6.3%) |
| $35,000 to $49,999 | 52 (11.9%) | 31 (5.3%) |
| $50,000 to $74,999 | 57 (13.0%) | 36 (6.1%) |
| $75,000 to $99,999 | 79 (18.0%) | 92 (15.7%) |
| $100,000 to $149,999 | 54 (12.3%) | 74 (12.6%) |
| $150,000 or more | 88 (20.1%) | 202 (34.4%) |
| Total | 438 (100.0%) | 588 (100.0%) |
Property Value to Household Income Ratio in Big Lake
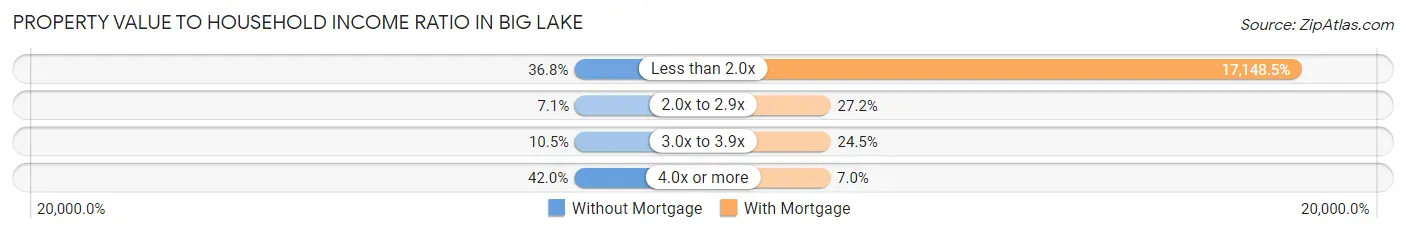
| Value-to-Income Ratio | Without Mortgage | With Mortgage |
| Less than 2.0x | 161 (36.8%) | 100,833 (17,148.5%) |
| 2.0x to 2.9x | 31 (7.1%) | 160 (27.2%) |
| 3.0x to 3.9x | 46 (10.5%) | 144 (24.5%) |
| 4.0x or more | 184 (42.0%) | 41 (7.0%) |
| Total | 438 (100.0%) | 588 (100.0%) |
Real Estate Taxes by Mortgage Status in Big Lake
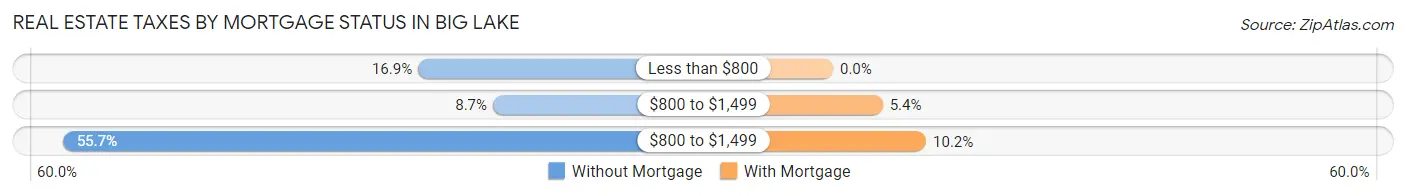
| Property Taxes | Without Mortgage | With Mortgage |
| Less than $800 | 74 (16.9%) | 0 (0.0%) |
| $800 to $1,499 | 38 (8.7%) | 32 (5.4%) |
| $800 to $1,499 | 244 (55.7%) | 60 (10.2%) |
| Total | 438 (100.0%) | 588 (100.0%) |
Health & Disability in Big Lake
Health Insurance Coverage by Age in Big Lake
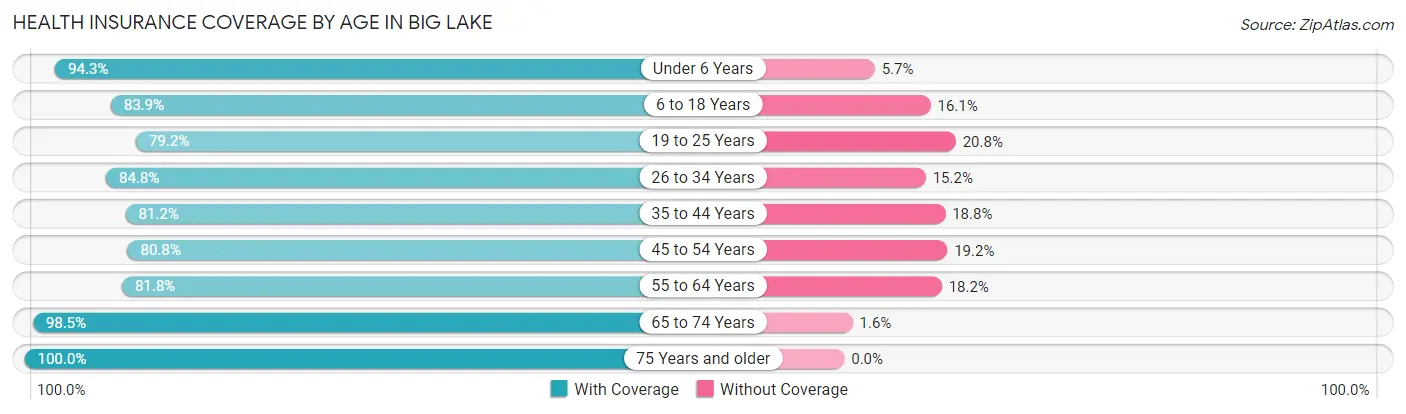
| Age Bracket | With Coverage | Without Coverage |
| Under 6 Years | 249 (94.3%) | 15 (5.7%) |
| 6 to 18 Years | 402 (83.9%) | 77 (16.1%) |
| 19 to 25 Years | 202 (79.2%) | 53 (20.8%) |
| 26 to 34 Years | 480 (84.8%) | 86 (15.2%) |
| 35 to 44 Years | 289 (81.2%) | 67 (18.8%) |
| 45 to 54 Years | 261 (80.8%) | 62 (19.2%) |
| 55 to 64 Years | 428 (81.8%) | 95 (18.2%) |
| 65 to 74 Years | 318 (98.5%) | 5 (1.5%) |
| 75 Years and older | 134 (100.0%) | 0 (0.0%) |
| Total | 2,763 (85.7%) | 460 (14.3%) |
Health Insurance Coverage by Citizenship Status in Big Lake
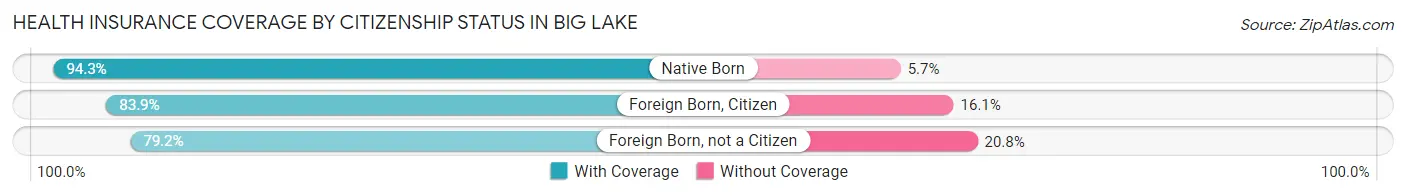
| Citizenship Status | With Coverage | Without Coverage |
| Native Born | 249 (94.3%) | 15 (5.7%) |
| Foreign Born, Citizen | 402 (83.9%) | 77 (16.1%) |
| Foreign Born, not a Citizen | 202 (79.2%) | 53 (20.8%) |
Health Insurance Coverage by Household Income in Big Lake
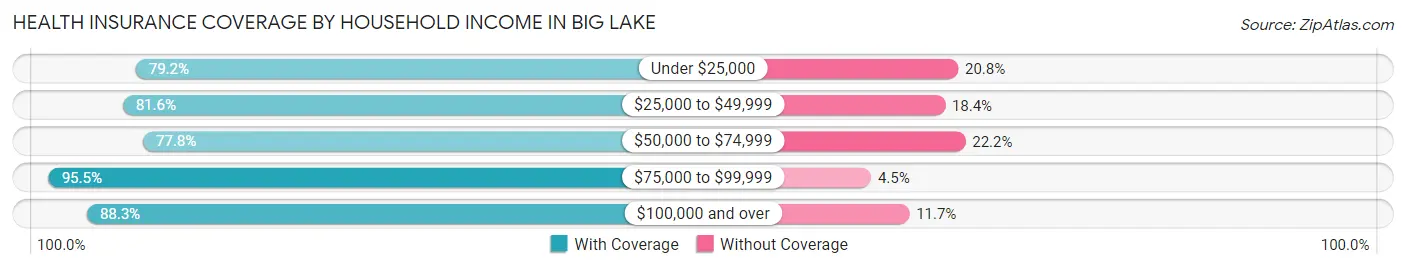
| Household Income | With Coverage | Without Coverage |
| Under $25,000 | 319 (79.2%) | 84 (20.8%) |
| $25,000 to $49,999 | 324 (81.6%) | 73 (18.4%) |
| $50,000 to $74,999 | 368 (77.8%) | 105 (22.2%) |
| $75,000 to $99,999 | 400 (95.5%) | 19 (4.5%) |
| $100,000 and over | 1,352 (88.3%) | 179 (11.7%) |
Public vs Private Health Insurance Coverage by Age in Big Lake
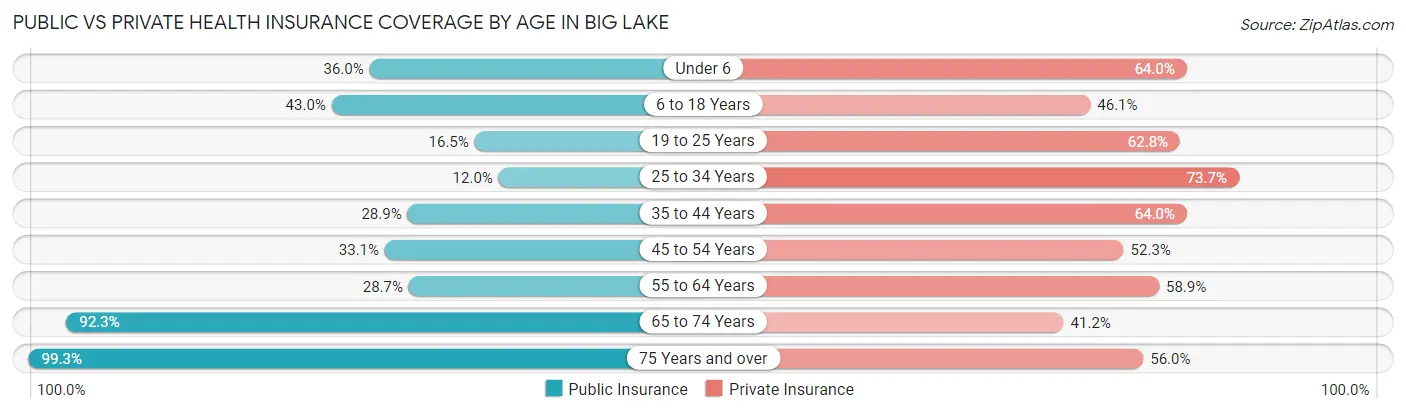
| Age Bracket | Public Insurance | Private Insurance |
| Under 6 | 95 (36.0%) | 169 (64.0%) |
| 6 to 18 Years | 206 (43.0%) | 221 (46.1%) |
| 19 to 25 Years | 42 (16.5%) | 160 (62.7%) |
| 25 to 34 Years | 68 (12.0%) | 417 (73.7%) |
| 35 to 44 Years | 103 (28.9%) | 228 (64.0%) |
| 45 to 54 Years | 107 (33.1%) | 169 (52.3%) |
| 55 to 64 Years | 150 (28.7%) | 308 (58.9%) |
| 65 to 74 Years | 298 (92.3%) | 133 (41.2%) |
| 75 Years and over | 133 (99.3%) | 75 (56.0%) |
| Total | 1,202 (37.3%) | 1,880 (58.3%) |
Disability Status by Sex by Age in Big Lake
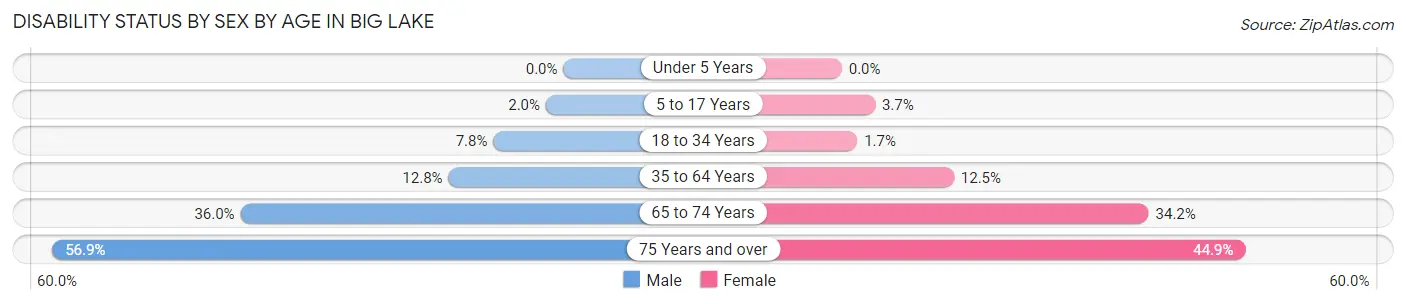
| Age Bracket | Male | Female |
| Under 5 Years | 0 (0.0%) | 0 (0.0%) |
| 5 to 17 Years | 5 (1.9%) | 9 (3.7%) |
| 18 to 34 Years | 35 (7.8%) | 7 (1.7%) |
| 35 to 64 Years | 80 (12.8%) | 72 (12.5%) |
| 65 to 74 Years | 73 (36.0%) | 41 (34.2%) |
| 75 Years and over | 37 (56.9%) | 31 (44.9%) |
Disability Class by Sex by Age in Big Lake
Disability Class: Hearing Difficulty
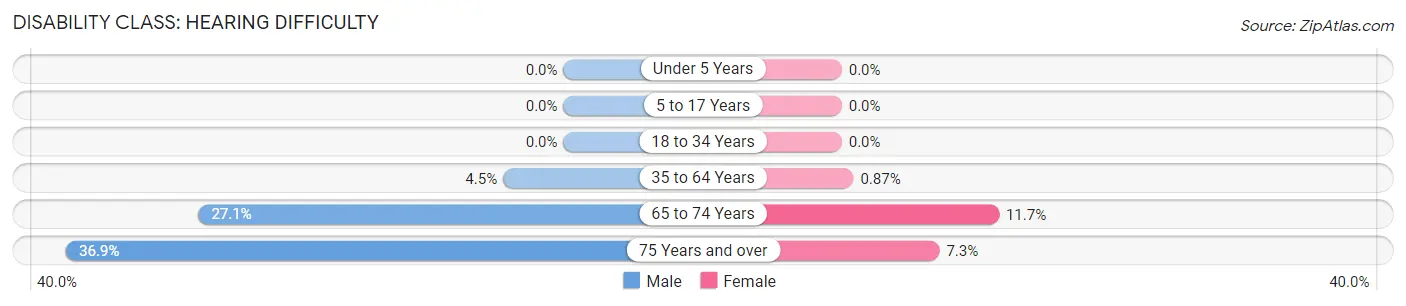
| Age Bracket | Male | Female |
| Under 5 Years | 0 (0.0%) | 0 (0.0%) |
| 5 to 17 Years | 0 (0.0%) | 0 (0.0%) |
| 18 to 34 Years | 0 (0.0%) | 0 (0.0%) |
| 35 to 64 Years | 28 (4.5%) | 5 (0.9%) |
| 65 to 74 Years | 55 (27.1%) | 14 (11.7%) |
| 75 Years and over | 24 (36.9%) | 5 (7.2%) |
Disability Class: Vision Difficulty
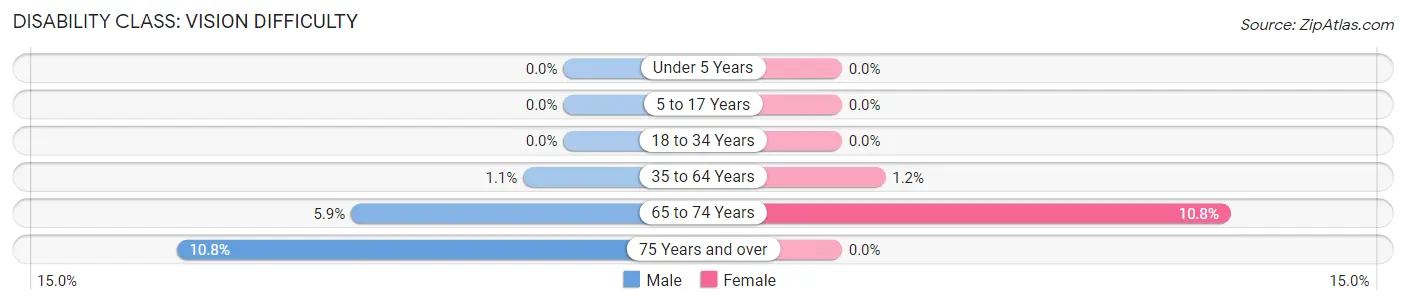
| Age Bracket | Male | Female |
| Under 5 Years | 0 (0.0%) | 0 (0.0%) |
| 5 to 17 Years | 0 (0.0%) | 0 (0.0%) |
| 18 to 34 Years | 0 (0.0%) | 0 (0.0%) |
| 35 to 64 Years | 7 (1.1%) | 7 (1.2%) |
| 65 to 74 Years | 12 (5.9%) | 13 (10.8%) |
| 75 Years and over | 7 (10.8%) | 0 (0.0%) |
Disability Class: Cognitive Difficulty
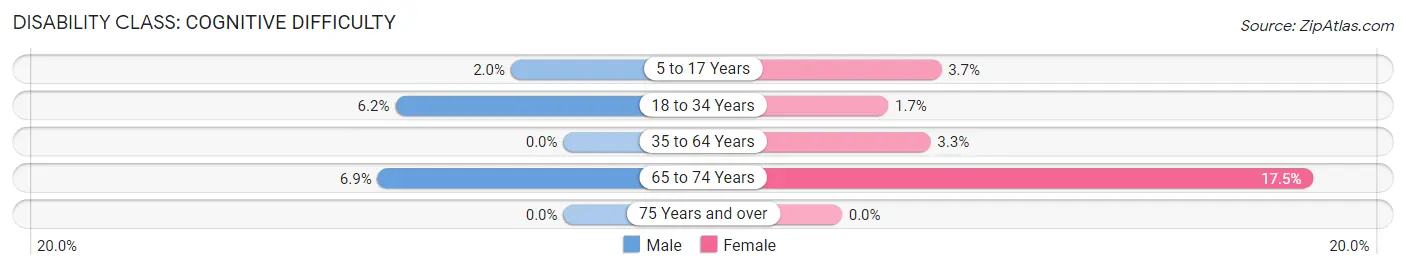
| Age Bracket | Male | Female |
| 5 to 17 Years | 5 (1.9%) | 9 (3.7%) |
| 18 to 34 Years | 28 (6.2%) | 7 (1.7%) |
| 35 to 64 Years | 0 (0.0%) | 19 (3.3%) |
| 65 to 74 Years | 14 (6.9%) | 21 (17.5%) |
| 75 Years and over | 0 (0.0%) | 0 (0.0%) |
Disability Class: Ambulatory Difficulty
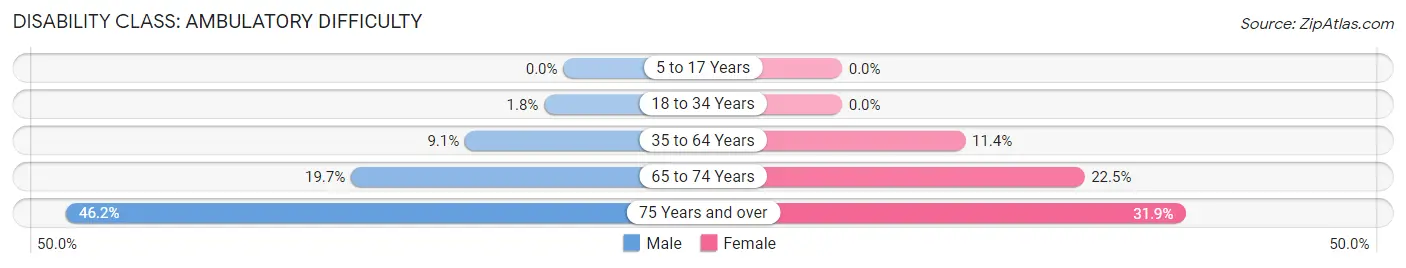
| Age Bracket | Male | Female |
| 5 to 17 Years | 0 (0.0%) | 0 (0.0%) |
| 18 to 34 Years | 8 (1.8%) | 0 (0.0%) |
| 35 to 64 Years | 57 (9.1%) | 66 (11.4%) |
| 65 to 74 Years | 40 (19.7%) | 27 (22.5%) |
| 75 Years and over | 30 (46.2%) | 22 (31.9%) |
Disability Class: Self-Care Difficulty
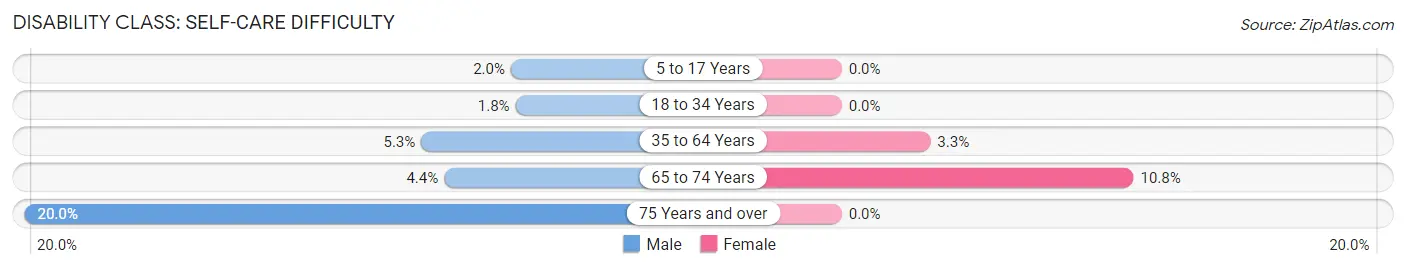
| Age Bracket | Male | Female |
| 5 to 17 Years | 5 (1.9%) | 0 (0.0%) |
| 18 to 34 Years | 8 (1.8%) | 0 (0.0%) |
| 35 to 64 Years | 33 (5.3%) | 19 (3.3%) |
| 65 to 74 Years | 9 (4.4%) | 13 (10.8%) |
| 75 Years and over | 13 (20.0%) | 0 (0.0%) |
Technology Access in Big Lake
Computing Device Access in Big Lake
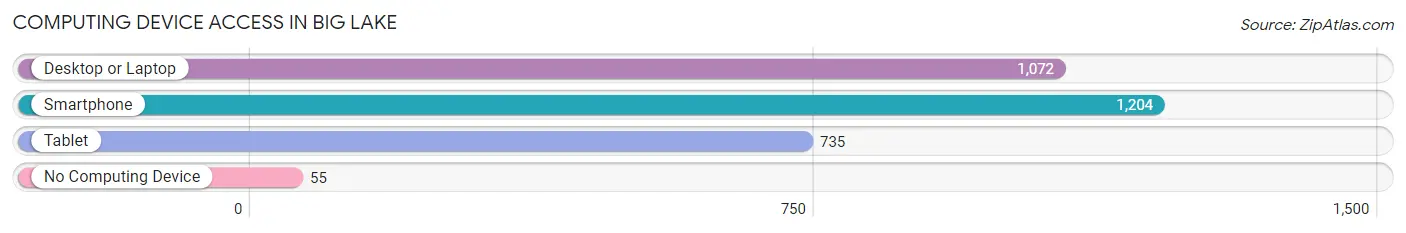
| Device Type | # Households | % Households |
| Desktop or Laptop | 1,072 | 79.8% |
| Smartphone | 1,204 | 89.6% |
| Tablet | 735 | 54.7% |
| No Computing Device | 55 | 4.1% |
| Total | 1,343 | 100.0% |
Internet Access in Big Lake
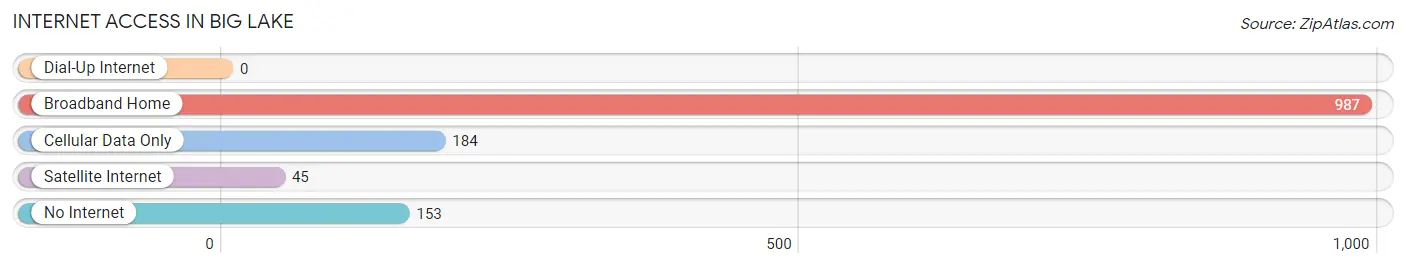
| Internet Type | # Households | % Households |
| Dial-Up Internet | 0 | 0.0% |
| Broadband Home | 987 | 73.5% |
| Cellular Data Only | 184 | 13.7% |
| Satellite Internet | 45 | 3.4% |
| No Internet | 153 | 11.4% |
| Total | 1,343 | 100.0% |
Big Lake Summary
Big Lake is a census-designated place (CDP) in Matanuska-Susitna Borough, Alaska, United States. It is located on the south shore of Big Lake, a large lake in the Matanuska Valley. As of the 2010 census, the population of Big Lake was 1,243.
History
Big Lake was first settled by the Dena'ina Athabascan people, who used the lake for fishing and hunting. The first non-Native settlers arrived in the area in the early 1900s, and the first post office was established in 1915. The area was originally known as "Big Lake Station" and was a stop on the Alaska Railroad.
In the 1950s, the area began to be developed for recreational use. The Big Lake State Recreation Area was established in 1956, and the Big Lake State Airport was built in 1959. The area has since become a popular destination for fishing, camping, and other outdoor activities.
Geography
Big Lake is located at (61.539, -149.837). It is situated on the south shore of Big Lake, a large lake in the Matanuska Valley. The lake is approximately 10 miles long and 5 miles wide. The CDP has a total area of 11.3 square miles, of which 10.9 square miles is land and 0.4 square miles (3.45%) is water.
Economy
The economy of Big Lake is largely based on tourism and recreation. The area is a popular destination for fishing, camping, and other outdoor activities. The Big Lake State Recreation Area is a popular destination for camping, boating, and other outdoor activities. The area also has several resorts and lodges that cater to tourists.
The area is also home to several businesses, including restaurants, convenience stores, and gas stations. The Big Lake State Airport is located in the area and provides air service to the surrounding communities.
Demographics
As of the 2010 census, there were 1,243 people, 486 households, and 339 families residing in the CDP. The population density was 114.2 people per square mile. There were 545 housing units at an average density of 50.1 per square mile. The racial makeup of the CDP was 87.2% White, 0.7% Black or African American, 5.2% Native American, 0.7% Asian, 0.1% Pacific Islander, 0.9% from other races, and 5.2% from two or more races. Hispanic or Latino of any race were 3.2% of the population.
There were 486 households, out of which 33.2% had children under the age of 18 living with them, 51.2% were married couples living together, 10.7% had a female householder with no husband present, and 32.2% were non-families. 25.3% of all households were made up of individuals, and 6.3% had someone living alone who was 65 years of age or older. The average household size was 2.54 and the average family size was 3.06.
In the CDP, the population was spread out, with 26.2% under the age of 18, 8.2% from 18 to 24, 28.2% from 25 to 44, 28.2% from 45 to 64, and 9.2% who were 65 years of age or older. The median age was 37 years. For every 100 females, there were 106.2 males. For every 100 females age 18 and over, there were 106.2 males.
The median income for a household in the CDP was $50,000, and the median income for a family was $54,375. Males had a median income of $41,250 versus $30,000 for females. The per capita income for the CDP was $21,945. About 8.2% of families and 10.7% of the population were below the poverty line, including 11.2% of those under age 18 and none of those age 65 or over.
Common Questions
What is Per Capita Income in Big Lake?
Per Capita income in Big Lake is $40,697.
What is the Median Family Income in Big Lake?
Median Family Income in Big Lake is $99,743.
What is the Median Household income in Big Lake?
Median Household Income in Big Lake is $77,292.
What is Income or Wage Gap in Big Lake?
Income or Wage Gap in Big Lake is 41.7%.
Women in Big Lake earn 58.3 cents for every dollar earned by a man.
What is Inequality or Gini Index in Big Lake?
Inequality or Gini Index in Big Lake is 0.45.
What is the Total Population of Big Lake?
Total Population of Big Lake is 3,232.
What is the Total Male Population of Big Lake?
Total Male Population of Big Lake is 1,695.
What is the Total Female Population of Big Lake?
Total Female Population of Big Lake is 1,537.
What is the Ratio of Males per 100 Females in Big Lake?
There are 110.28 Males per 100 Females in Big Lake.
What is the Ratio of Females per 100 Males in Big Lake?
There are 90.68 Females per 100 Males in Big Lake.
What is the Median Population Age in Big Lake?
Median Population Age in Big Lake is 35.8 Years.
What is the Average Family Size in Big Lake
Average Family Size in Big Lake is 2.9 People.
What is the Average Household Size in Big Lake
Average Household Size in Big Lake is 2.4 People.
How Large is the Labor Force in Big Lake?
There are 1,587 People in the Labor Forcein in Big Lake.
What is the Percentage of People in the Labor Force in Big Lake?
61.3% of People are in the Labor Force in Big Lake.
What is the Unemployment Rate in Big Lake?
Unemployment Rate in Big Lake is 6.3%.