Arapaho vs Iraqi Disability Age 65 to 74
COMPARE
Arapaho
Iraqi
Disability Age 65 to 74
Disability Age 65 to 74 Comparison
Arapaho
Iraqis
28.1%
DISABILITY AGE 65 TO 74
0.0/ 100
METRIC RATING
319th/ 347
METRIC RANK
24.2%
DISABILITY AGE 65 TO 74
8.1/ 100
METRIC RATING
226th/ 347
METRIC RANK
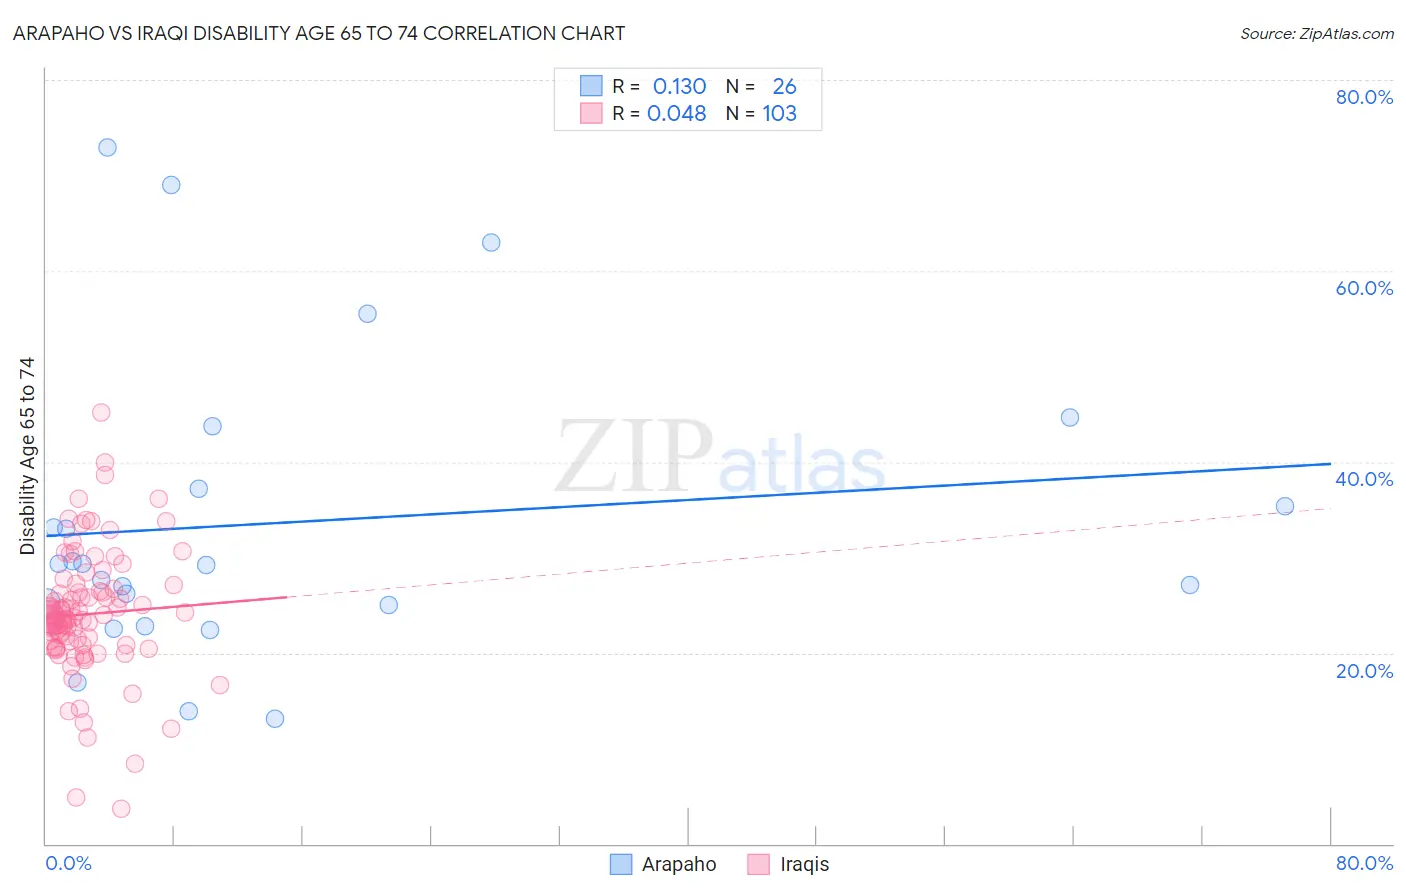
Arapaho vs Iraqi Disability Age 65 to 74 Correlation Chart
The statistical analysis conducted on geographies consisting of 29,768,926 people shows a poor positive correlation between the proportion of Arapaho and percentage of population with a disability between the ages 65 and 75 in the United States with a correlation coefficient (R) of 0.130 and weighted average of 28.1%. Similarly, the statistical analysis conducted on geographies consisting of 170,539,860 people shows no correlation between the proportion of Iraqis and percentage of population with a disability between the ages 65 and 75 in the United States with a correlation coefficient (R) of 0.048 and weighted average of 24.2%, a difference of 16.3%.
Disability Age 65 to 74 Correlation Summary
| Measurement | Arapaho | Iraqi |
| Minimum | 13.0% | 3.6% |
| Maximum | 72.9% | 45.1% |
| Range | 59.9% | 41.5% |
| Mean | 33.6% | 24.0% |
| Median | 29.2% | 23.6% |
| Interquartile 25% (IQ1) | 25.0% | 20.8% |
| Interquartile 75% (IQ3) | 37.2% | 26.5% |
| Interquartile Range (IQR) | 12.2% | 5.6% |
| Standard Deviation (Sample) | 15.8% | 6.5% |
| Standard Deviation (Population) | 15.5% | 6.5% |
Similar Demographics by Disability Age 65 to 74
Demographics Similar to Arapaho by Disability Age 65 to 74
In terms of disability age 65 to 74, the demographic groups most similar to Arapaho are Nepalese (28.0%, a difference of 0.23%), Cherokee (28.2%, a difference of 0.39%), Immigrants from Armenia (28.0%, a difference of 0.45%), Crow (27.9%, a difference of 0.54%), and Cajun (27.9%, a difference of 0.58%).
| Demographics | Rating | Rank | Disability Age 65 to 74 |
| Osage | 0.0 /100 | #312 | Tragic 27.5% |
| Paiute | 0.0 /100 | #313 | Tragic 27.8% |
| Chippewa | 0.0 /100 | #314 | Tragic 27.8% |
| Cajuns | 0.0 /100 | #315 | Tragic 27.9% |
| Crow | 0.0 /100 | #316 | Tragic 27.9% |
| Immigrants | Armenia | 0.0 /100 | #317 | Tragic 28.0% |
| Nepalese | 0.0 /100 | #318 | Tragic 28.0% |
| Arapaho | 0.0 /100 | #319 | Tragic 28.1% |
| Cherokee | 0.0 /100 | #320 | Tragic 28.2% |
| Comanche | 0.0 /100 | #321 | Tragic 28.3% |
| Aleuts | 0.0 /100 | #322 | Tragic 28.4% |
| Puerto Ricans | 0.0 /100 | #323 | Tragic 29.1% |
| Seminole | 0.0 /100 | #324 | Tragic 29.4% |
| Dutch West Indians | 0.0 /100 | #325 | Tragic 29.6% |
| Yakama | 0.0 /100 | #326 | Tragic 29.6% |
Demographics Similar to Iraqis by Disability Age 65 to 74
In terms of disability age 65 to 74, the demographic groups most similar to Iraqis are Bermudan (24.2%, a difference of 0.010%), Nigerian (24.2%, a difference of 0.070%), Immigrants from Panama (24.1%, a difference of 0.090%), Immigrants from Middle Africa (24.1%, a difference of 0.14%), and Native Hawaiian (24.1%, a difference of 0.21%).
| Demographics | Rating | Rank | Disability Age 65 to 74 |
| Immigrants | Burma/Myanmar | 11.6 /100 | #219 | Poor 24.0% |
| Ghanaians | 10.4 /100 | #220 | Poor 24.1% |
| Immigrants | Nicaragua | 9.8 /100 | #221 | Tragic 24.1% |
| Native Hawaiians | 9.3 /100 | #222 | Tragic 24.1% |
| Immigrants | Middle Africa | 8.9 /100 | #223 | Tragic 24.1% |
| Immigrants | Panama | 8.6 /100 | #224 | Tragic 24.1% |
| Bermudans | 8.2 /100 | #225 | Tragic 24.2% |
| Iraqis | 8.1 /100 | #226 | Tragic 24.2% |
| Nigerians | 7.8 /100 | #227 | Tragic 24.2% |
| Whites/Caucasians | 6.6 /100 | #228 | Tragic 24.2% |
| Celtics | 6.4 /100 | #229 | Tragic 24.2% |
| Barbadians | 6.0 /100 | #230 | Tragic 24.3% |
| Immigrants | Thailand | 5.2 /100 | #231 | Tragic 24.3% |
| Immigrants | Zaire | 5.0 /100 | #232 | Tragic 24.3% |
| Bahamians | 4.5 /100 | #233 | Tragic 24.4% |