Basque vs Belgian Disability Age 35 to 64
COMPARE
Basque
Belgian
Disability Age 35 to 64
Disability Age 35 to 64 Comparison
Basques
Belgians
11.6%
DISABILITY AGE 35 TO 64
19.5/ 100
METRIC RATING
199th/ 347
METRIC RANK
11.7%
DISABILITY AGE 35 TO 64
13.1/ 100
METRIC RATING
210th/ 347
METRIC RANK
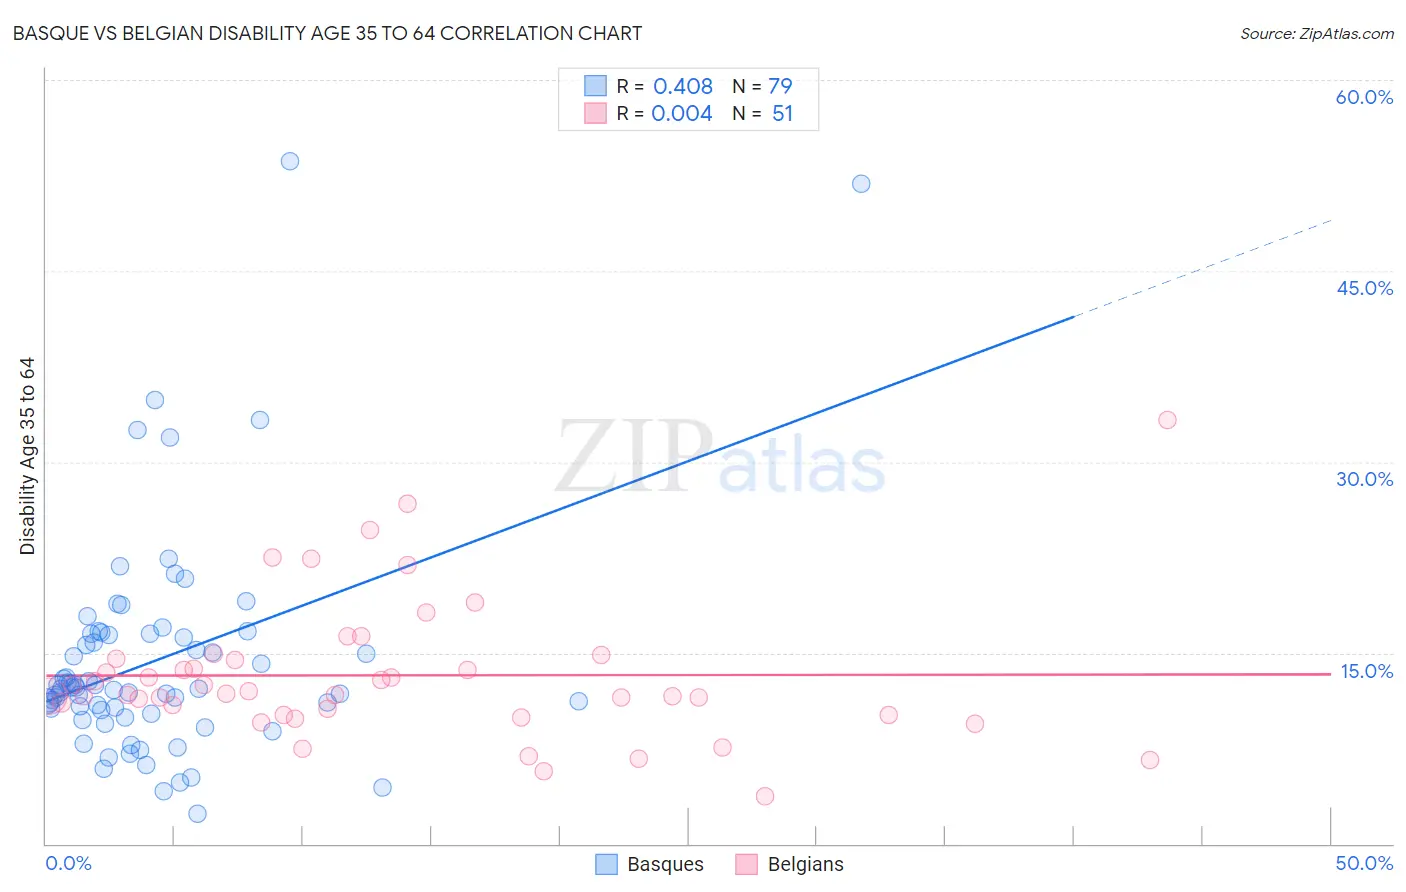
Basque vs Belgian Disability Age 35 to 64 Correlation Chart
The statistical analysis conducted on geographies consisting of 165,739,455 people shows a moderate positive correlation between the proportion of Basques and percentage of population with a disability between the ages 34 and 64 in the United States with a correlation coefficient (R) of 0.408 and weighted average of 11.6%. Similarly, the statistical analysis conducted on geographies consisting of 355,809,909 people shows no correlation between the proportion of Belgians and percentage of population with a disability between the ages 34 and 64 in the United States with a correlation coefficient (R) of 0.004 and weighted average of 11.7%, a difference of 0.93%.
Disability Age 35 to 64 Correlation Summary
| Measurement | Basque | Belgian |
| Minimum | 2.4% | 3.7% |
| Maximum | 53.6% | 33.3% |
| Range | 51.2% | 29.6% |
| Mean | 14.4% | 13.2% |
| Median | 12.2% | 11.7% |
| Interquartile 25% (IQ1) | 10.5% | 10.2% |
| Interquartile 75% (IQ3) | 16.5% | 14.6% |
| Interquartile Range (IQR) | 5.9% | 4.4% |
| Standard Deviation (Sample) | 8.8% | 5.5% |
| Standard Deviation (Population) | 8.7% | 5.4% |
Demographics Similar to Basques and Belgians by Disability Age 35 to 64
In terms of disability age 35 to 64, the demographic groups most similar to Basques are Swiss (11.6%, a difference of 0.10%), Immigrants from Panama (11.6%, a difference of 0.11%), Immigrants from Iraq (11.6%, a difference of 0.19%), Immigrants from Kenya (11.6%, a difference of 0.23%), and Immigrants from Guatemala (11.6%, a difference of 0.25%). Similarly, the demographic groups most similar to Belgians are Canadian (11.7%, a difference of 0.010%), European (11.7%, a difference of 0.070%), Immigrants from Jamaica (11.7%, a difference of 0.23%), Guatemalan (11.7%, a difference of 0.26%), and Yugoslavian (11.7%, a difference of 0.26%).
| Demographics | Rating | Rank | Disability Age 35 to 64 |
| Immigrants | Latin America | 27.5 /100 | #194 | Fair 11.5% |
| Carpatho Rusyns | 25.3 /100 | #195 | Fair 11.5% |
| Iraqis | 24.2 /100 | #196 | Fair 11.5% |
| Immigrants | Iraq | 21.0 /100 | #197 | Fair 11.6% |
| Immigrants | Panama | 20.4 /100 | #198 | Fair 11.6% |
| Basques | 19.5 /100 | #199 | Poor 11.6% |
| Swiss | 18.7 /100 | #200 | Poor 11.6% |
| Immigrants | Kenya | 17.7 /100 | #201 | Poor 11.6% |
| Immigrants | Guatemala | 17.5 /100 | #202 | Poor 11.6% |
| British | 17.0 /100 | #203 | Poor 11.6% |
| Nigerians | 16.3 /100 | #204 | Poor 11.6% |
| Slavs | 15.5 /100 | #205 | Poor 11.7% |
| Native Hawaiians | 14.8 /100 | #206 | Poor 11.7% |
| Ghanaians | 14.8 /100 | #207 | Poor 11.7% |
| Guatemalans | 14.6 /100 | #208 | Poor 11.7% |
| Europeans | 13.5 /100 | #209 | Poor 11.7% |
| Belgians | 13.1 /100 | #210 | Poor 11.7% |
| Canadians | 13.0 /100 | #211 | Poor 11.7% |
| Immigrants | Jamaica | 11.8 /100 | #212 | Poor 11.7% |
| Yugoslavians | 11.6 /100 | #213 | Poor 11.7% |
| Immigrants | Sudan | 11.4 /100 | #214 | Poor 11.7% |