British West Indian vs Immigrants from Sierra Leone Ambulatory Disability
COMPARE
British West Indian
Immigrants from Sierra Leone
Ambulatory Disability
Ambulatory Disability Comparison
British West Indians
Immigrants from Sierra Leone
7.0%
AMBULATORY DISABILITY
0.0/ 100
METRIC RATING
301st/ 347
METRIC RANK
5.8%
AMBULATORY DISABILITY
98.6/ 100
METRIC RATING
92nd/ 347
METRIC RANK
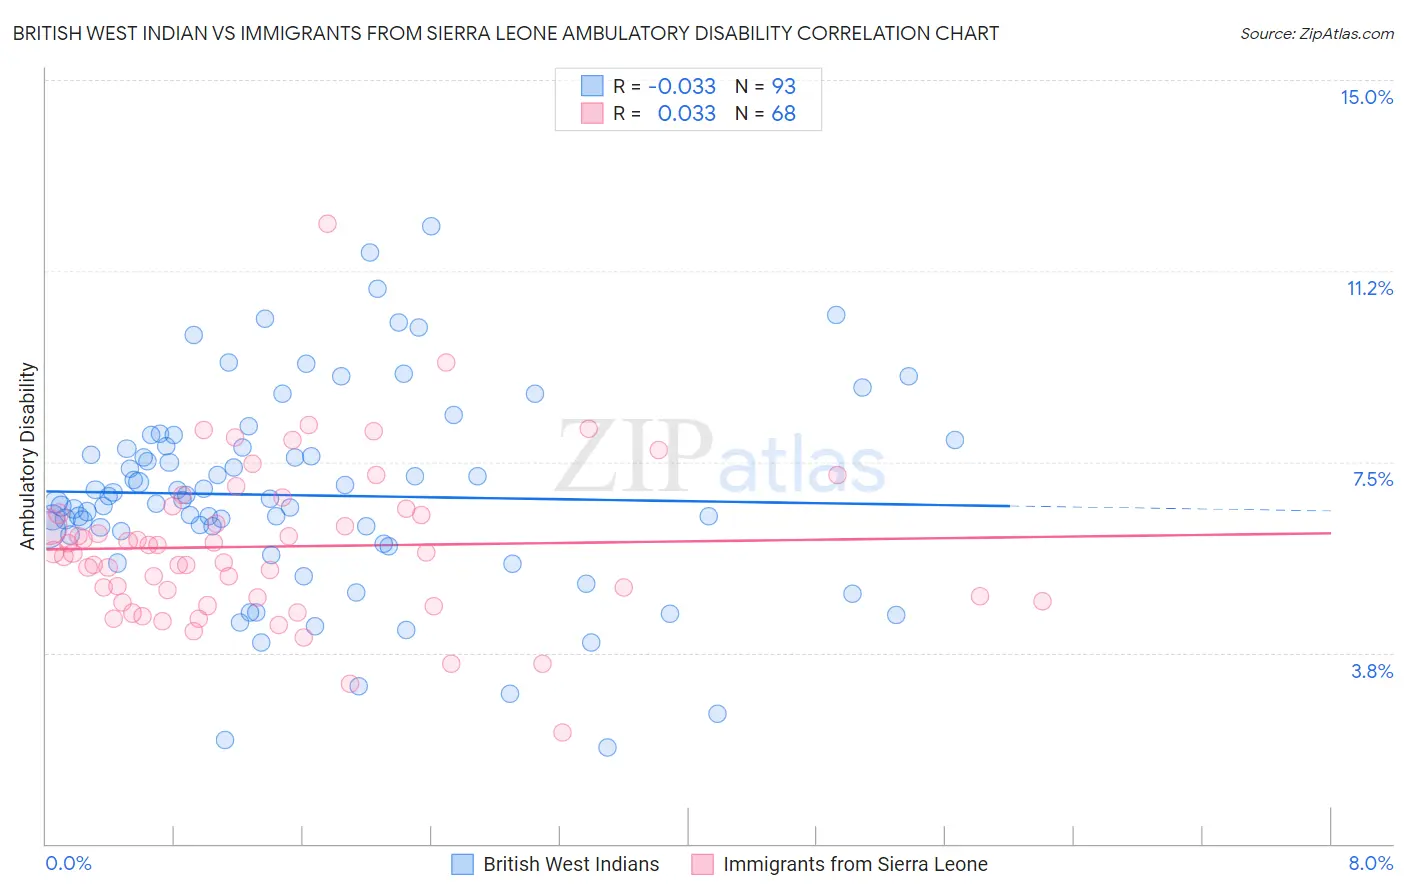
British West Indian vs Immigrants from Sierra Leone Ambulatory Disability Correlation Chart
The statistical analysis conducted on geographies consisting of 152,684,150 people shows no correlation between the proportion of British West Indians and percentage of population with ambulatory disability in the United States with a correlation coefficient (R) of -0.033 and weighted average of 7.0%. Similarly, the statistical analysis conducted on geographies consisting of 101,631,986 people shows no correlation between the proportion of Immigrants from Sierra Leone and percentage of population with ambulatory disability in the United States with a correlation coefficient (R) of 0.033 and weighted average of 5.8%, a difference of 20.7%.
Ambulatory Disability Correlation Summary
| Measurement | British West Indian | Immigrants from Sierra Leone |
| Minimum | 1.9% | 2.2% |
| Maximum | 12.1% | 12.2% |
| Range | 10.2% | 10.0% |
| Mean | 6.8% | 5.8% |
| Median | 6.8% | 5.7% |
| Interquartile 25% (IQ1) | 6.0% | 4.8% |
| Interquartile 75% (IQ3) | 7.8% | 6.5% |
| Interquartile Range (IQR) | 1.8% | 1.7% |
| Standard Deviation (Sample) | 2.0% | 1.6% |
| Standard Deviation (Population) | 2.0% | 1.5% |
Similar Demographics by Ambulatory Disability
Demographics Similar to British West Indians by Ambulatory Disability
In terms of ambulatory disability, the demographic groups most similar to British West Indians are Immigrants from Armenia (7.0%, a difference of 0.060%), African (7.0%, a difference of 0.11%), Marshallese (6.9%, a difference of 0.23%), Puget Sound Salish (6.9%, a difference of 0.24%), and Immigrants from Grenada (6.9%, a difference of 0.37%).
| Demographics | Rating | Rank | Ambulatory Disability |
| Cape Verdeans | 0.0 /100 | #294 | Tragic 6.9% |
| Crow | 0.0 /100 | #295 | Tragic 6.9% |
| Alaskan Athabascans | 0.0 /100 | #296 | Tragic 6.9% |
| French American Indians | 0.0 /100 | #297 | Tragic 6.9% |
| Immigrants | Grenada | 0.0 /100 | #298 | Tragic 6.9% |
| Puget Sound Salish | 0.0 /100 | #299 | Tragic 6.9% |
| Marshallese | 0.0 /100 | #300 | Tragic 6.9% |
| British West Indians | 0.0 /100 | #301 | Tragic 7.0% |
| Immigrants | Armenia | 0.0 /100 | #302 | Tragic 7.0% |
| Africans | 0.0 /100 | #303 | Tragic 7.0% |
| Immigrants | Cabo Verde | 0.0 /100 | #304 | Tragic 7.0% |
| Immigrants | Micronesia | 0.0 /100 | #305 | Tragic 7.0% |
| Iroquois | 0.0 /100 | #306 | Tragic 7.1% |
| Spanish Americans | 0.0 /100 | #307 | Tragic 7.1% |
| Chippewa | 0.0 /100 | #308 | Tragic 7.1% |
Demographics Similar to Immigrants from Sierra Leone by Ambulatory Disability
In terms of ambulatory disability, the demographic groups most similar to Immigrants from Sierra Leone are Immigrants from Denmark (5.8%, a difference of 0.010%), Bhutanese (5.8%, a difference of 0.17%), Australian (5.8%, a difference of 0.17%), Immigrants from Sudan (5.8%, a difference of 0.17%), and Kenyan (5.8%, a difference of 0.20%).
| Demographics | Rating | Rank | Ambulatory Disability |
| South Americans | 99.0 /100 | #85 | Exceptional 5.7% |
| Latvians | 99.0 /100 | #86 | Exceptional 5.7% |
| Immigrants | Chile | 98.9 /100 | #87 | Exceptional 5.8% |
| Soviet Union | 98.9 /100 | #88 | Exceptional 5.8% |
| Bhutanese | 98.8 /100 | #89 | Exceptional 5.8% |
| Australians | 98.8 /100 | #90 | Exceptional 5.8% |
| Immigrants | Sudan | 98.8 /100 | #91 | Exceptional 5.8% |
| Immigrants | Sierra Leone | 98.6 /100 | #92 | Exceptional 5.8% |
| Immigrants | Denmark | 98.6 /100 | #93 | Exceptional 5.8% |
| Kenyans | 98.4 /100 | #94 | Exceptional 5.8% |
| Immigrants | El Salvador | 98.4 /100 | #95 | Exceptional 5.8% |
| Salvadorans | 98.4 /100 | #96 | Exceptional 5.8% |
| Immigrants | Somalia | 98.3 /100 | #97 | Exceptional 5.8% |
| Immigrants | Lebanon | 98.3 /100 | #98 | Exceptional 5.8% |
| Immigrants | Northern Europe | 98.2 /100 | #99 | Exceptional 5.8% |