Bulgarian vs Delaware Male Disability
COMPARE
Bulgarian
Delaware
Male Disability
Male Disability Comparison
Bulgarians
Delaware
10.6%
MALE DISABILITY
98.1/ 100
METRIC RATING
84th/ 347
METRIC RANK
13.5%
MALE DISABILITY
0.0/ 100
METRIC RATING
311th/ 347
METRIC RANK
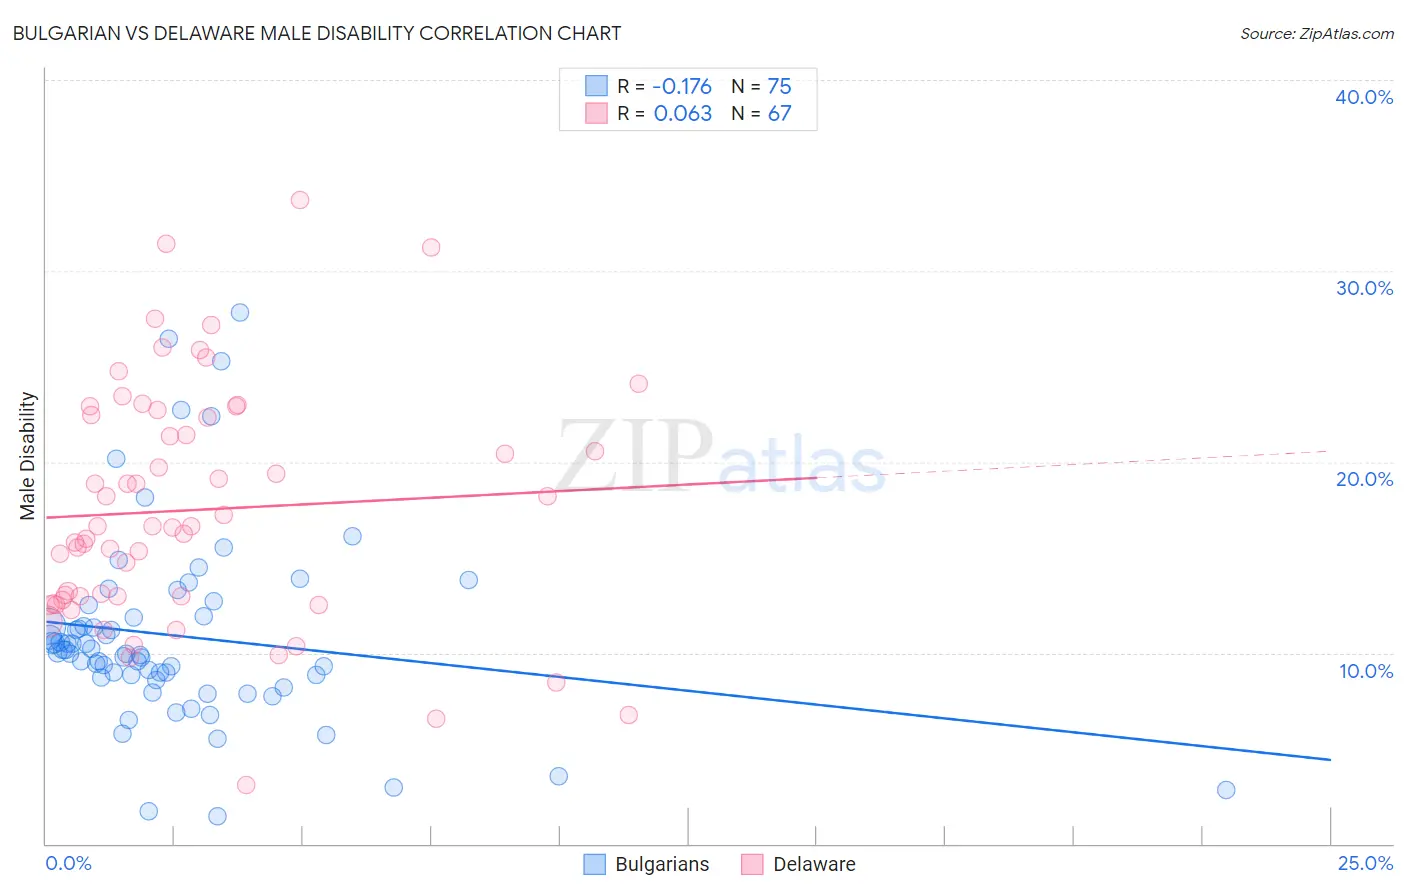
Bulgarian vs Delaware Male Disability Correlation Chart
The statistical analysis conducted on geographies consisting of 205,628,995 people shows a poor negative correlation between the proportion of Bulgarians and percentage of males with a disability in the United States with a correlation coefficient (R) of -0.176 and weighted average of 10.6%. Similarly, the statistical analysis conducted on geographies consisting of 96,239,516 people shows a slight positive correlation between the proportion of Delaware and percentage of males with a disability in the United States with a correlation coefficient (R) of 0.063 and weighted average of 13.5%, a difference of 27.0%.
Male Disability Correlation Summary
| Measurement | Bulgarian | Delaware |
| Minimum | 1.5% | 3.1% |
| Maximum | 27.8% | 33.7% |
| Range | 26.4% | 30.6% |
| Mean | 10.9% | 17.5% |
| Median | 10.0% | 16.6% |
| Interquartile 25% (IQ1) | 8.7% | 12.7% |
| Interquartile 75% (IQ3) | 11.9% | 22.4% |
| Interquartile Range (IQR) | 3.2% | 9.7% |
| Standard Deviation (Sample) | 5.0% | 6.3% |
| Standard Deviation (Population) | 5.0% | 6.2% |
Similar Demographics by Male Disability
Demographics Similar to Bulgarians by Male Disability
In terms of male disability, the demographic groups most similar to Bulgarians are Immigrants from Poland (10.6%, a difference of 0.010%), Immigrants from Guyana (10.6%, a difference of 0.080%), Immigrants from Chile (10.6%, a difference of 0.14%), Sri Lankan (10.6%, a difference of 0.18%), and Immigrants from Ireland (10.6%, a difference of 0.18%).
| Demographics | Rating | Rank | Male Disability |
| Laotians | 98.6 /100 | #77 | Exceptional 10.6% |
| Immigrants | Russia | 98.6 /100 | #78 | Exceptional 10.6% |
| Zimbabweans | 98.4 /100 | #79 | Exceptional 10.6% |
| Immigrants | Jordan | 98.4 /100 | #80 | Exceptional 10.6% |
| Immigrants | Chile | 98.3 /100 | #81 | Exceptional 10.6% |
| Immigrants | Guyana | 98.2 /100 | #82 | Exceptional 10.6% |
| Immigrants | Poland | 98.1 /100 | #83 | Exceptional 10.6% |
| Bulgarians | 98.1 /100 | #84 | Exceptional 10.6% |
| Sri Lankans | 97.9 /100 | #85 | Exceptional 10.6% |
| Immigrants | Ireland | 97.9 /100 | #86 | Exceptional 10.6% |
| Immigrants | Vietnam | 97.9 /100 | #87 | Exceptional 10.6% |
| Immigrants | Western Asia | 97.8 /100 | #88 | Exceptional 10.6% |
| Immigrants | Nicaragua | 97.8 /100 | #89 | Exceptional 10.6% |
| Immigrants | Morocco | 97.7 /100 | #90 | Exceptional 10.6% |
| Immigrants | France | 97.6 /100 | #91 | Exceptional 10.6% |
Demographics Similar to Delaware by Male Disability
In terms of male disability, the demographic groups most similar to Delaware are Immigrants from the Azores (13.4%, a difference of 0.19%), Blackfeet (13.4%, a difference of 0.33%), Yakama (13.5%, a difference of 0.55%), Puget Sound Salish (13.5%, a difference of 0.57%), and Aleut (13.5%, a difference of 0.63%).
| Demographics | Rating | Rank | Male Disability |
| Blacks/African Americans | 0.0 /100 | #304 | Tragic 13.2% |
| French Canadians | 0.0 /100 | #305 | Tragic 13.3% |
| Spanish Americans | 0.0 /100 | #306 | Tragic 13.3% |
| Arapaho | 0.0 /100 | #307 | Tragic 13.3% |
| French American Indians | 0.0 /100 | #308 | Tragic 13.4% |
| Blackfeet | 0.0 /100 | #309 | Tragic 13.4% |
| Immigrants | Azores | 0.0 /100 | #310 | Tragic 13.4% |
| Delaware | 0.0 /100 | #311 | Tragic 13.5% |
| Yakama | 0.0 /100 | #312 | Tragic 13.5% |
| Puget Sound Salish | 0.0 /100 | #313 | Tragic 13.5% |
| Aleuts | 0.0 /100 | #314 | Tragic 13.5% |
| Iroquois | 0.0 /100 | #315 | Tragic 13.6% |
| Alaska Natives | 0.0 /100 | #316 | Tragic 13.6% |
| Paiute | 0.0 /100 | #317 | Tragic 13.7% |
| Cree | 0.0 /100 | #318 | Tragic 13.7% |