Carpatho Rusyn vs Barbadian Female Disability
COMPARE
Carpatho Rusyn
Barbadian
Female Disability
Female Disability Comparison
Carpatho Rusyns
Barbadians
12.6%
FEMALE DISABILITY
2.0/ 100
METRIC RATING
248th/ 347
METRIC RANK
12.6%
FEMALE DISABILITY
3.6/ 100
METRIC RATING
239th/ 347
METRIC RANK
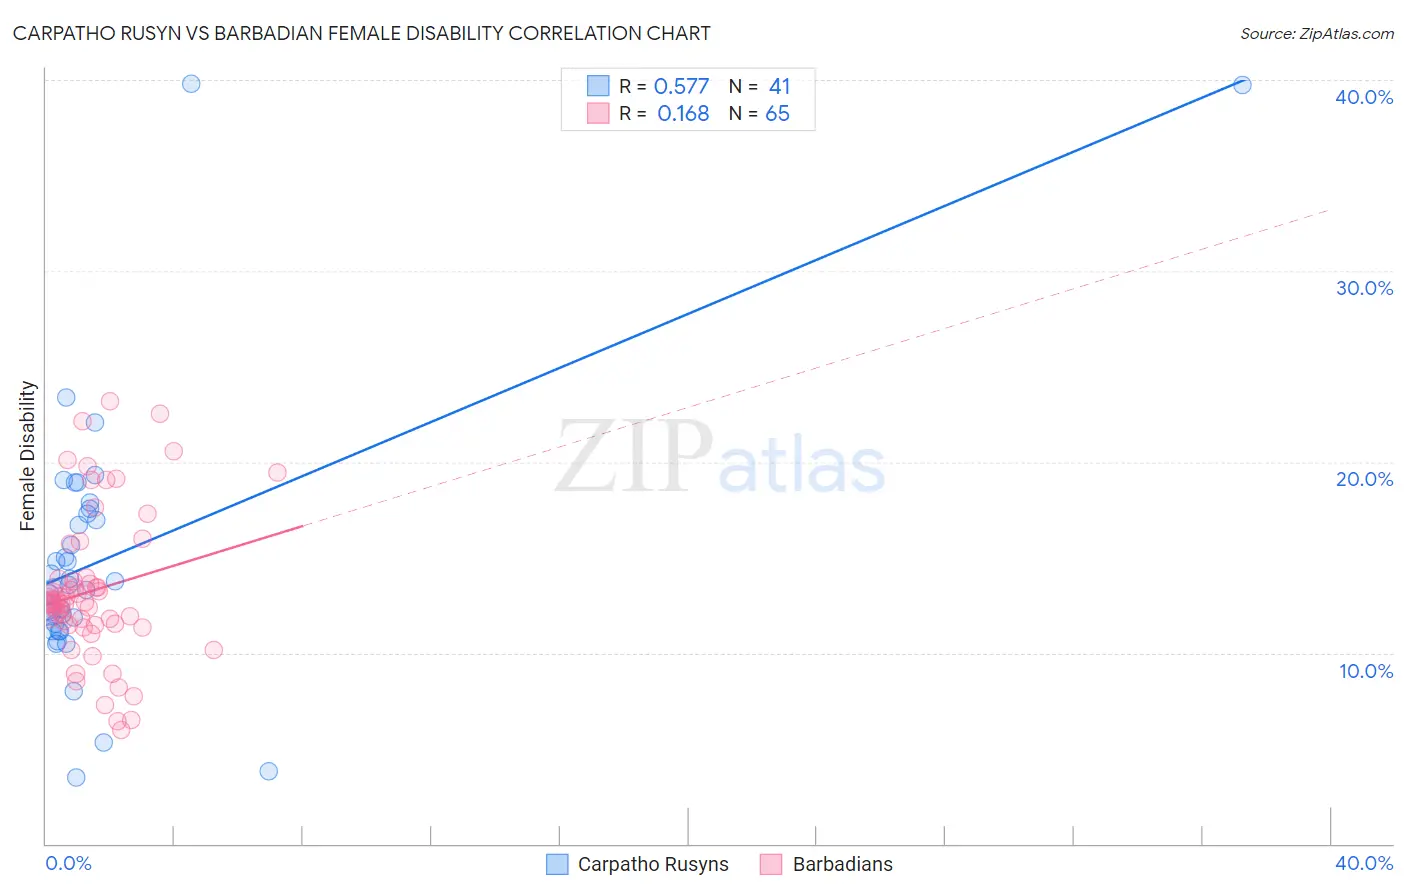
Carpatho Rusyn vs Barbadian Female Disability Correlation Chart
The statistical analysis conducted on geographies consisting of 58,872,330 people shows a substantial positive correlation between the proportion of Carpatho Rusyns and percentage of females with a disability in the United States with a correlation coefficient (R) of 0.577 and weighted average of 12.6%. Similarly, the statistical analysis conducted on geographies consisting of 141,302,135 people shows a poor positive correlation between the proportion of Barbadians and percentage of females with a disability in the United States with a correlation coefficient (R) of 0.168 and weighted average of 12.6%, a difference of 0.54%.
Female Disability Correlation Summary
| Measurement | Carpatho Rusyn | Barbadian |
| Minimum | 3.5% | 5.9% |
| Maximum | 39.8% | 23.2% |
| Range | 36.3% | 17.2% |
| Mean | 14.9% | 13.3% |
| Median | 13.6% | 12.6% |
| Interquartile 25% (IQ1) | 11.3% | 11.5% |
| Interquartile 75% (IQ3) | 17.4% | 13.9% |
| Interquartile Range (IQR) | 6.1% | 2.4% |
| Standard Deviation (Sample) | 7.1% | 3.9% |
| Standard Deviation (Population) | 7.0% | 3.9% |
Demographics Similar to Carpatho Rusyns and Barbadians by Female Disability
In terms of female disability, the demographic groups most similar to Carpatho Rusyns are Menominee (12.6%, a difference of 0.040%), Spanish American Indian (12.6%, a difference of 0.050%), Immigrants from Jamaica (12.6%, a difference of 0.070%), Immigrants from Congo (12.7%, a difference of 0.13%), and Slovene (12.7%, a difference of 0.17%). Similarly, the demographic groups most similar to Barbadians are Yugoslavian (12.6%, a difference of 0.030%), Slavic (12.6%, a difference of 0.060%), German Russian (12.6%, a difference of 0.090%), Immigrants from West Indies (12.6%, a difference of 0.19%), and Japanese (12.6%, a difference of 0.26%).
| Demographics | Rating | Rank | Female Disability |
| Immigrants | Iraq | 5.3 /100 | #233 | Tragic 12.5% |
| Scandinavians | 5.3 /100 | #234 | Tragic 12.5% |
| Malaysians | 5.0 /100 | #235 | Tragic 12.5% |
| Immigrants | West Indies | 4.4 /100 | #236 | Tragic 12.6% |
| Slavs | 3.8 /100 | #237 | Tragic 12.6% |
| Yugoslavians | 3.7 /100 | #238 | Tragic 12.6% |
| Barbadians | 3.6 /100 | #239 | Tragic 12.6% |
| German Russians | 3.2 /100 | #240 | Tragic 12.6% |
| Japanese | 2.7 /100 | #241 | Tragic 12.6% |
| Canadians | 2.6 /100 | #242 | Tragic 12.6% |
| Immigrants | Senegal | 2.5 /100 | #243 | Tragic 12.6% |
| Alsatians | 2.5 /100 | #244 | Tragic 12.6% |
| Immigrants | Jamaica | 2.2 /100 | #245 | Tragic 12.6% |
| Spanish American Indians | 2.1 /100 | #246 | Tragic 12.6% |
| Menominee | 2.1 /100 | #247 | Tragic 12.6% |
| Carpatho Rusyns | 2.0 /100 | #248 | Tragic 12.6% |
| Immigrants | Congo | 1.8 /100 | #249 | Tragic 12.7% |
| Slovenes | 1.7 /100 | #250 | Tragic 12.7% |
| Crow | 1.6 /100 | #251 | Tragic 12.7% |
| Immigrants | Caribbean | 1.4 /100 | #252 | Tragic 12.7% |
| Jamaicans | 1.4 /100 | #253 | Tragic 12.7% |