Central American vs Immigrants from Bahamas Disability Age 65 to 74
COMPARE
Central American
Immigrants from Bahamas
Disability Age 65 to 74
Disability Age 65 to 74 Comparison
Central Americans
Immigrants from Bahamas
25.1%
DISABILITY AGE 65 TO 74
0.5/ 100
METRIC RATING
255th/ 347
METRIC RANK
23.7%
DISABILITY AGE 65 TO 74
23.3/ 100
METRIC RATING
202nd/ 347
METRIC RANK
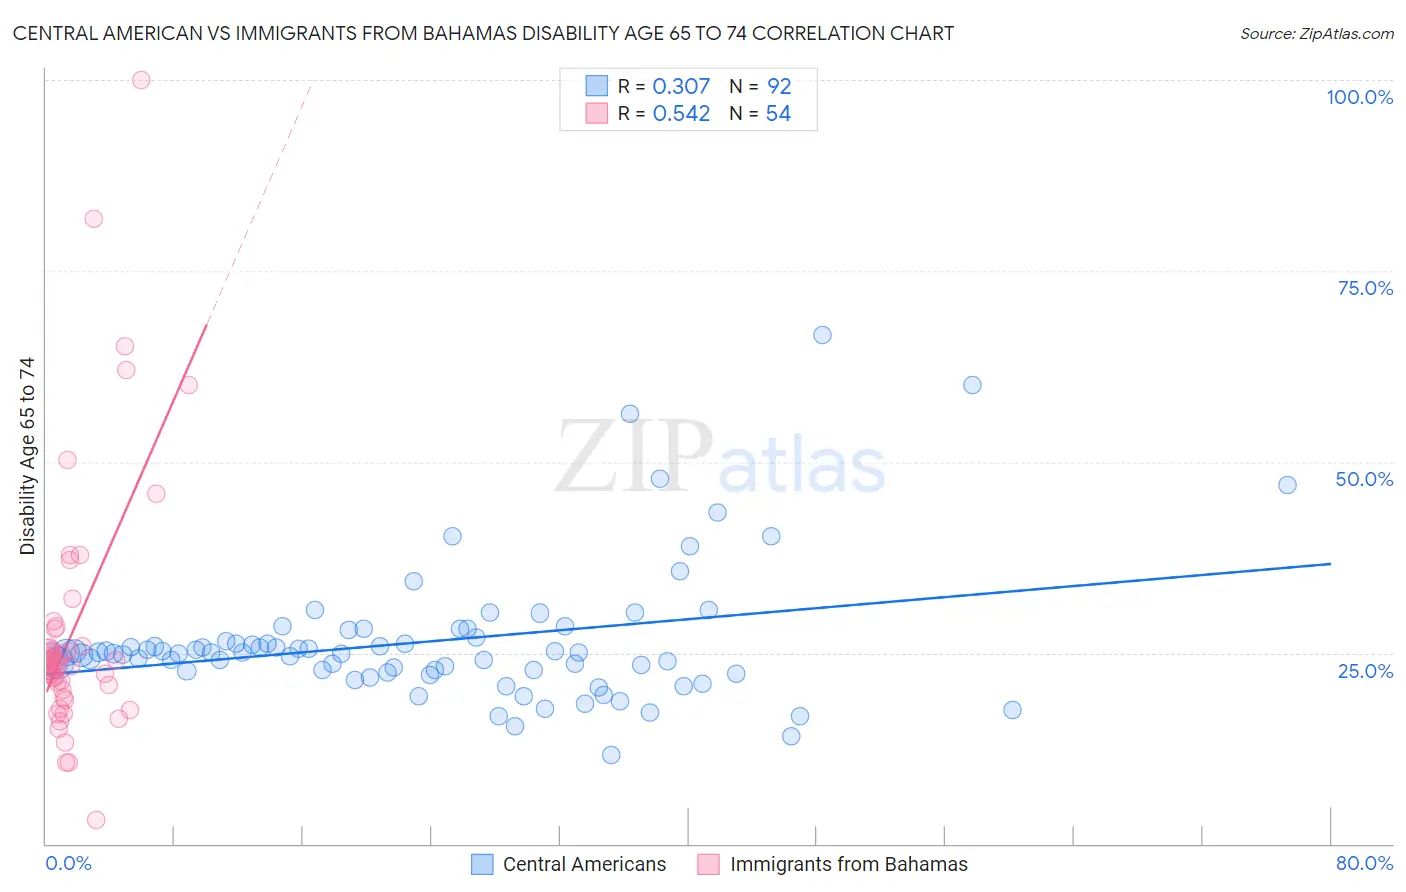
Central American vs Immigrants from Bahamas Disability Age 65 to 74 Correlation Chart
The statistical analysis conducted on geographies consisting of 503,060,028 people shows a mild positive correlation between the proportion of Central Americans and percentage of population with a disability between the ages 65 and 75 in the United States with a correlation coefficient (R) of 0.307 and weighted average of 25.1%. Similarly, the statistical analysis conducted on geographies consisting of 104,578,963 people shows a substantial positive correlation between the proportion of Immigrants from Bahamas and percentage of population with a disability between the ages 65 and 75 in the United States with a correlation coefficient (R) of 0.542 and weighted average of 23.7%, a difference of 5.9%.
Disability Age 65 to 74 Correlation Summary
| Measurement | Central American | Immigrants from Bahamas |
| Minimum | 11.6% | 3.1% |
| Maximum | 66.7% | 100.0% |
| Range | 55.1% | 96.9% |
| Mean | 26.5% | 28.1% |
| Median | 25.0% | 23.6% |
| Interquartile 25% (IQ1) | 22.7% | 20.1% |
| Interquartile 75% (IQ3) | 26.8% | 28.1% |
| Interquartile Range (IQR) | 4.1% | 7.9% |
| Standard Deviation (Sample) | 8.9% | 17.3% |
| Standard Deviation (Population) | 8.9% | 17.2% |
Similar Demographics by Disability Age 65 to 74
Demographics Similar to Central Americans by Disability Age 65 to 74
In terms of disability age 65 to 74, the demographic groups most similar to Central Americans are Somali (25.1%, a difference of 0.16%), Subsaharan African (25.1%, a difference of 0.23%), Immigrants from El Salvador (25.1%, a difference of 0.27%), Immigrants from Somalia (25.2%, a difference of 0.41%), and Nonimmigrants (25.0%, a difference of 0.46%).
| Demographics | Rating | Rank | Disability Age 65 to 74 |
| Senegalese | 0.9 /100 | #248 | Tragic 24.9% |
| Immigrants | Fiji | 0.8 /100 | #249 | Tragic 25.0% |
| Salvadorans | 0.8 /100 | #250 | Tragic 25.0% |
| Immigrants | Nonimmigrants | 0.7 /100 | #251 | Tragic 25.0% |
| Immigrants | El Salvador | 0.6 /100 | #252 | Tragic 25.1% |
| Sub-Saharan Africans | 0.6 /100 | #253 | Tragic 25.1% |
| Somalis | 0.6 /100 | #254 | Tragic 25.1% |
| Central Americans | 0.5 /100 | #255 | Tragic 25.1% |
| Immigrants | Somalia | 0.4 /100 | #256 | Tragic 25.2% |
| Guamanians/Chamorros | 0.3 /100 | #257 | Tragic 25.3% |
| Marshallese | 0.3 /100 | #258 | Tragic 25.3% |
| Immigrants | Cambodia | 0.3 /100 | #259 | Tragic 25.3% |
| Malaysians | 0.2 /100 | #260 | Tragic 25.4% |
| Cape Verdeans | 0.2 /100 | #261 | Tragic 25.4% |
| Samoans | 0.2 /100 | #262 | Tragic 25.4% |
Demographics Similar to Immigrants from Bahamas by Disability Age 65 to 74
In terms of disability age 65 to 74, the demographic groups most similar to Immigrants from Bahamas are Kenyan (23.7%, a difference of 0.010%), Immigrants from Ecuador (23.7%, a difference of 0.040%), French Canadian (23.7%, a difference of 0.050%), Immigrants from Africa (23.7%, a difference of 0.080%), and Welsh (23.7%, a difference of 0.080%).
| Demographics | Rating | Rank | Disability Age 65 to 74 |
| Immigrants | St. Vincent and the Grenadines | 26.1 /100 | #195 | Fair 23.7% |
| Immigrants | Trinidad and Tobago | 26.1 /100 | #196 | Fair 23.7% |
| Immigrants | Immigrants | 25.8 /100 | #197 | Fair 23.7% |
| Immigrants | Africa | 24.4 /100 | #198 | Fair 23.7% |
| Welsh | 24.3 /100 | #199 | Fair 23.7% |
| French Canadians | 24.0 /100 | #200 | Fair 23.7% |
| Immigrants | Ecuador | 23.9 /100 | #201 | Fair 23.7% |
| Immigrants | Bahamas | 23.3 /100 | #202 | Fair 23.7% |
| Kenyans | 23.2 /100 | #203 | Fair 23.7% |
| Immigrants | Grenada | 22.1 /100 | #204 | Fair 23.8% |
| Tongans | 20.8 /100 | #205 | Fair 23.8% |
| Immigrants | Jamaica | 20.7 /100 | #206 | Fair 23.8% |
| Immigrants | Sudan | 20.1 /100 | #207 | Fair 23.8% |
| Immigrants | Barbados | 19.6 /100 | #208 | Poor 23.8% |
| Immigrants | Kenya | 19.6 /100 | #209 | Poor 23.8% |