Cheyenne vs Immigrants from Thailand Ambulatory Disability
COMPARE
Cheyenne
Immigrants from Thailand
Ambulatory Disability
Ambulatory Disability Comparison
Cheyenne
Immigrants from Thailand
6.9%
AMBULATORY DISABILITY
0.0/ 100
METRIC RATING
292nd/ 347
METRIC RANK
6.1%
AMBULATORY DISABILITY
42.2/ 100
METRIC RATING
183rd/ 347
METRIC RANK
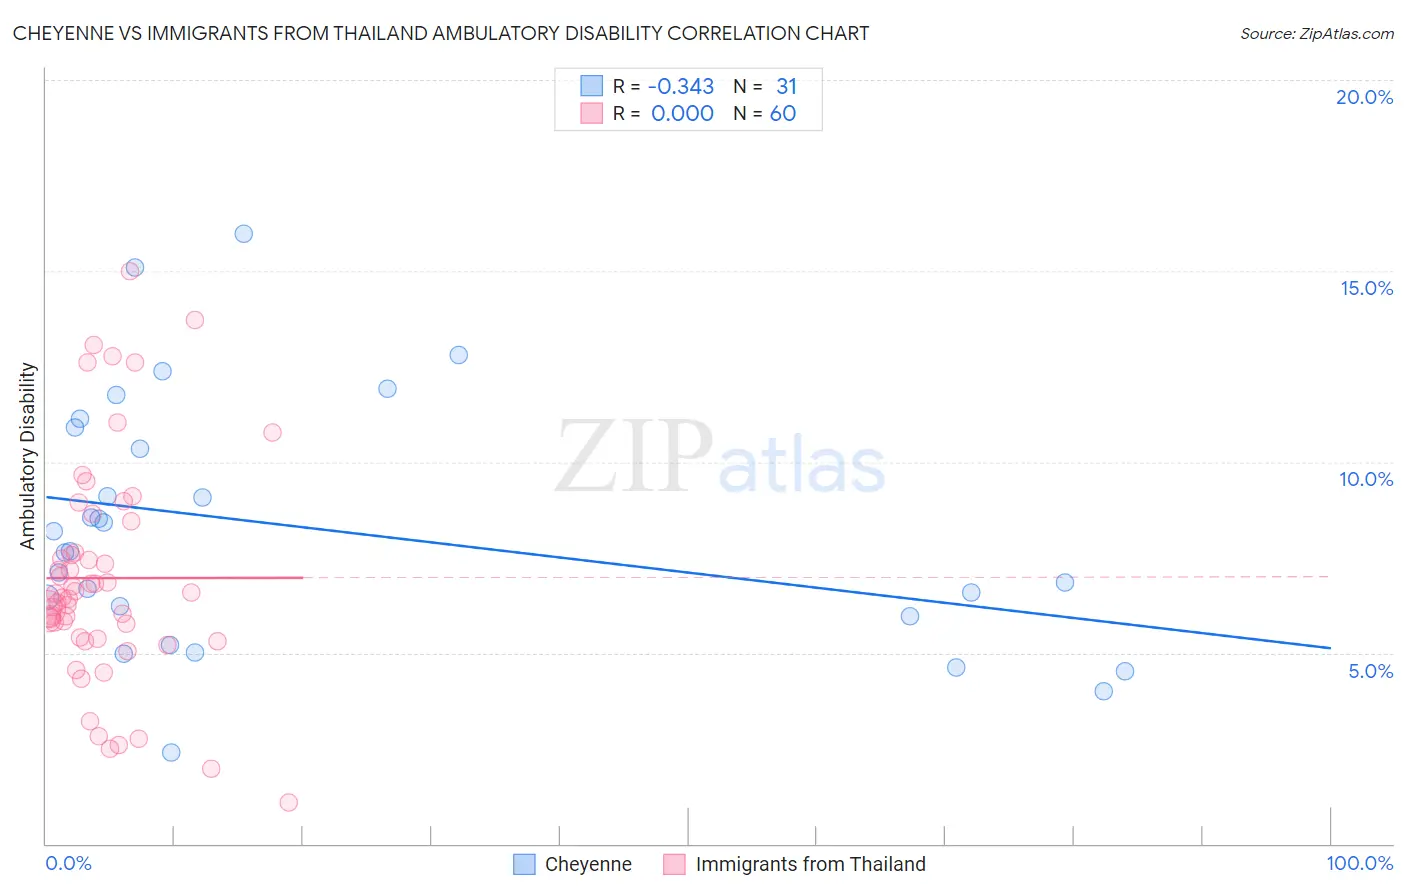
Cheyenne vs Immigrants from Thailand Ambulatory Disability Correlation Chart
The statistical analysis conducted on geographies consisting of 80,709,712 people shows a mild negative correlation between the proportion of Cheyenne and percentage of population with ambulatory disability in the United States with a correlation coefficient (R) of -0.343 and weighted average of 6.9%. Similarly, the statistical analysis conducted on geographies consisting of 316,957,387 people shows no correlation between the proportion of Immigrants from Thailand and percentage of population with ambulatory disability in the United States with a correlation coefficient (R) of 0.000 and weighted average of 6.1%, a difference of 11.9%.
Ambulatory Disability Correlation Summary
| Measurement | Cheyenne | Immigrants from Thailand |
| Minimum | 2.4% | 1.1% |
| Maximum | 16.0% | 15.0% |
| Range | 13.6% | 13.9% |
| Mean | 8.3% | 7.0% |
| Median | 7.7% | 6.5% |
| Interquartile 25% (IQ1) | 6.0% | 5.4% |
| Interquartile 75% (IQ3) | 10.9% | 8.0% |
| Interquartile Range (IQR) | 4.9% | 2.6% |
| Standard Deviation (Sample) | 3.3% | 2.9% |
| Standard Deviation (Population) | 3.2% | 2.9% |
Similar Demographics by Ambulatory Disability
Demographics Similar to Cheyenne by Ambulatory Disability
In terms of ambulatory disability, the demographic groups most similar to Cheyenne are West Indian (6.9%, a difference of 0.060%), Scotch-Irish (6.9%, a difference of 0.16%), Immigrants from Dominica (6.9%, a difference of 0.19%), Immigrants from St. Vincent and the Grenadines (6.9%, a difference of 0.24%), and Nonimmigrants (6.9%, a difference of 0.33%).
| Demographics | Rating | Rank | Ambulatory Disability |
| Fijians | 0.0 /100 | #285 | Tragic 6.8% |
| Yakama | 0.0 /100 | #286 | Tragic 6.8% |
| U.S. Virgin Islanders | 0.0 /100 | #287 | Tragic 6.8% |
| Immigrants | Nonimmigrants | 0.0 /100 | #288 | Tragic 6.9% |
| Immigrants | Dominica | 0.0 /100 | #289 | Tragic 6.9% |
| Scotch-Irish | 0.0 /100 | #290 | Tragic 6.9% |
| West Indians | 0.0 /100 | #291 | Tragic 6.9% |
| Cheyenne | 0.0 /100 | #292 | Tragic 6.9% |
| Immigrants | St. Vincent and the Grenadines | 0.0 /100 | #293 | Tragic 6.9% |
| Cape Verdeans | 0.0 /100 | #294 | Tragic 6.9% |
| Crow | 0.0 /100 | #295 | Tragic 6.9% |
| Alaskan Athabascans | 0.0 /100 | #296 | Tragic 6.9% |
| French American Indians | 0.0 /100 | #297 | Tragic 6.9% |
| Immigrants | Grenada | 0.0 /100 | #298 | Tragic 6.9% |
| Puget Sound Salish | 0.0 /100 | #299 | Tragic 6.9% |
Demographics Similar to Immigrants from Thailand by Ambulatory Disability
In terms of ambulatory disability, the demographic groups most similar to Immigrants from Thailand are Serbian (6.1%, a difference of 0.030%), Swiss (6.1%, a difference of 0.050%), Immigrants from Ghana (6.1%, a difference of 0.050%), Immigrants from Nicaragua (6.1%, a difference of 0.090%), and Austrian (6.1%, a difference of 0.10%).
| Demographics | Rating | Rank | Ambulatory Disability |
| Immigrants | North America | 45.6 /100 | #176 | Average 6.1% |
| Immigrants | England | 45.4 /100 | #177 | Average 6.1% |
| Scandinavians | 44.5 /100 | #178 | Average 6.1% |
| Austrians | 44.1 /100 | #179 | Average 6.1% |
| Immigrants | Nicaragua | 43.9 /100 | #180 | Average 6.1% |
| Swiss | 43.1 /100 | #181 | Average 6.1% |
| Serbians | 42.8 /100 | #182 | Average 6.1% |
| Immigrants | Thailand | 42.2 /100 | #183 | Average 6.1% |
| Immigrants | Ghana | 41.2 /100 | #184 | Average 6.1% |
| Immigrants | Bosnia and Herzegovina | 37.2 /100 | #185 | Fair 6.2% |
| Europeans | 36.2 /100 | #186 | Fair 6.2% |
| Carpatho Rusyns | 35.3 /100 | #187 | Fair 6.2% |
| British | 34.3 /100 | #188 | Fair 6.2% |
| Ukrainians | 34.0 /100 | #189 | Fair 6.2% |
| Immigrants | Western Africa | 33.4 /100 | #190 | Fair 6.2% |