Chilean vs Immigrants from Barbados Hearing Disability
COMPARE
Chilean
Immigrants from Barbados
Hearing Disability
Hearing Disability Comparison
Chileans
Immigrants from Barbados
2.9%
HEARING DISABILITY
85.8/ 100
METRIC RATING
132nd/ 347
METRIC RANK
2.4%
HEARING DISABILITY
100.0/ 100
METRIC RATING
5th/ 347
METRIC RANK
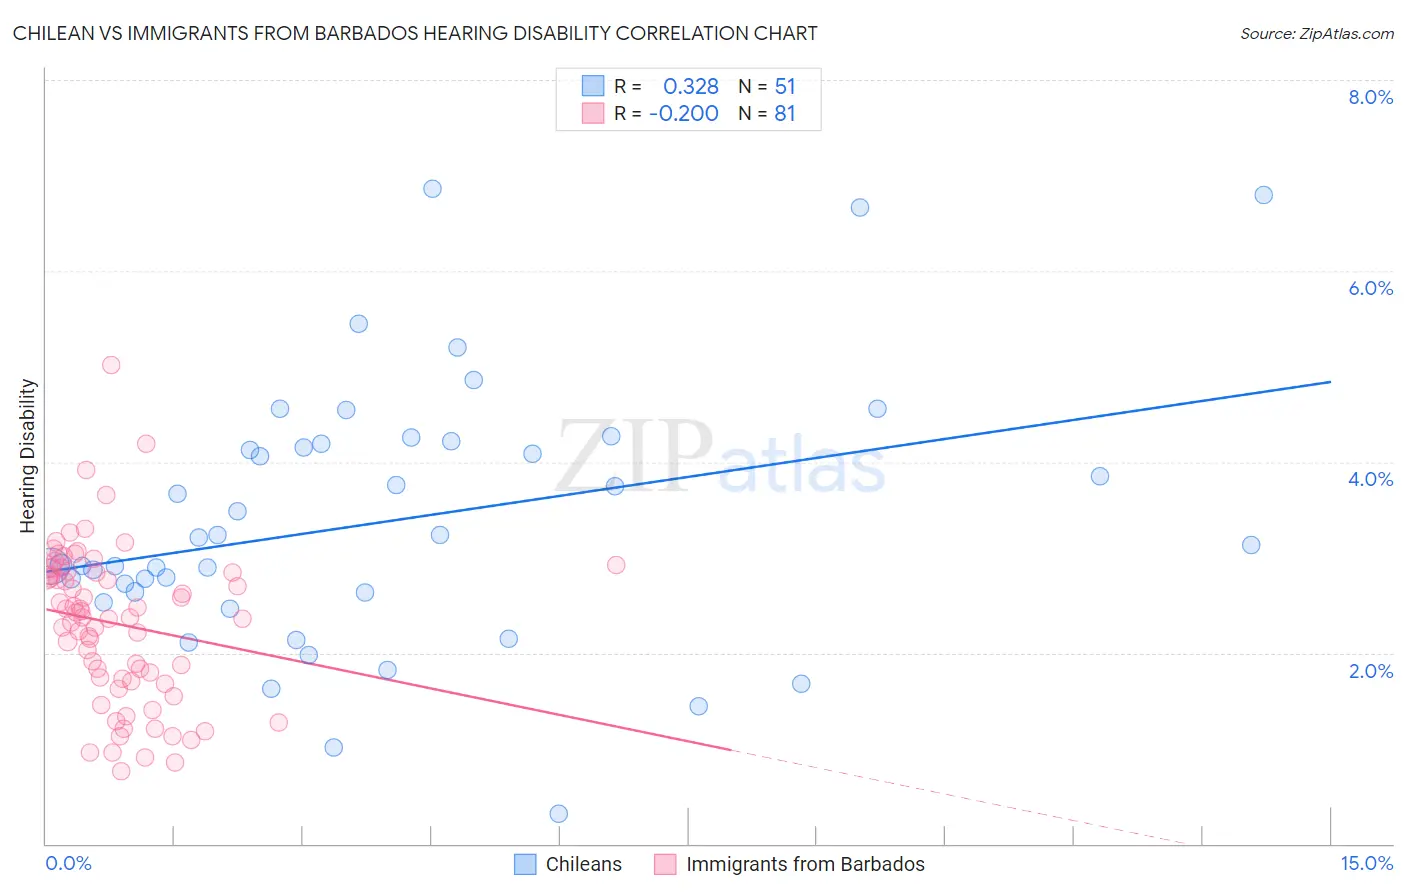
Chilean vs Immigrants from Barbados Hearing Disability Correlation Chart
The statistical analysis conducted on geographies consisting of 256,625,228 people shows a mild positive correlation between the proportion of Chileans and percentage of population with hearing disability in the United States with a correlation coefficient (R) of 0.328 and weighted average of 2.9%. Similarly, the statistical analysis conducted on geographies consisting of 112,766,175 people shows a poor negative correlation between the proportion of Immigrants from Barbados and percentage of population with hearing disability in the United States with a correlation coefficient (R) of -0.200 and weighted average of 2.4%, a difference of 21.4%.
Hearing Disability Correlation Summary
| Measurement | Chilean | Immigrants from Barbados |
| Minimum | 0.32% | 0.76% |
| Maximum | 6.9% | 5.0% |
| Range | 6.5% | 4.3% |
| Mean | 3.4% | 2.3% |
| Median | 3.1% | 2.4% |
| Interquartile 25% (IQ1) | 2.6% | 1.7% |
| Interquartile 75% (IQ3) | 4.2% | 2.9% |
| Interquartile Range (IQR) | 1.6% | 1.1% |
| Standard Deviation (Sample) | 1.4% | 0.82% |
| Standard Deviation (Population) | 1.4% | 0.81% |
Similar Demographics by Hearing Disability
Demographics Similar to Chileans by Hearing Disability
In terms of hearing disability, the demographic groups most similar to Chileans are Immigrants from Syria (2.9%, a difference of 0.0%), Immigrants from Kenya (2.9%, a difference of 0.050%), Ugandan (2.9%, a difference of 0.070%), Immigrants from Vietnam (2.9%, a difference of 0.14%), and Immigrants from Uganda (2.9%, a difference of 0.16%).
| Demographics | Rating | Rank | Hearing Disability |
| Immigrants | Albania | 88.5 /100 | #125 | Excellent 2.9% |
| Immigrants | Sudan | 87.8 /100 | #126 | Excellent 2.9% |
| South American Indians | 86.9 /100 | #127 | Excellent 2.9% |
| Immigrants | Western Asia | 86.9 /100 | #128 | Excellent 2.9% |
| Immigrants | Uganda | 86.6 /100 | #129 | Excellent 2.9% |
| Immigrants | Vietnam | 86.5 /100 | #130 | Excellent 2.9% |
| Immigrants | Kenya | 86.1 /100 | #131 | Excellent 2.9% |
| Chileans | 85.8 /100 | #132 | Excellent 2.9% |
| Immigrants | Syria | 85.8 /100 | #133 | Excellent 2.9% |
| Ugandans | 85.5 /100 | #134 | Excellent 2.9% |
| Soviet Union | 84.8 /100 | #135 | Excellent 2.9% |
| Immigrants | Brazil | 84.6 /100 | #136 | Excellent 2.9% |
| Sri Lankans | 84.1 /100 | #137 | Excellent 2.9% |
| Immigrants | Costa Rica | 84.0 /100 | #138 | Excellent 2.9% |
| Bermudans | 83.8 /100 | #139 | Excellent 2.9% |
Demographics Similar to Immigrants from Barbados by Hearing Disability
In terms of hearing disability, the demographic groups most similar to Immigrants from Barbados are Vietnamese (2.4%, a difference of 1.1%), Immigrants from Guyana (2.3%, a difference of 1.9%), Immigrants from Bangladesh (2.4%, a difference of 2.7%), British West Indian (2.4%, a difference of 2.9%), and Guyanese (2.3%, a difference of 3.3%).
| Demographics | Rating | Rank | Hearing Disability |
| Immigrants | Grenada | 100.0 /100 | #1 | Exceptional 2.2% |
| Immigrants | St. Vincent and the Grenadines | 100.0 /100 | #2 | Exceptional 2.3% |
| Guyanese | 100.0 /100 | #3 | Exceptional 2.3% |
| Immigrants | Guyana | 100.0 /100 | #4 | Exceptional 2.3% |
| Immigrants | Barbados | 100.0 /100 | #5 | Exceptional 2.4% |
| Vietnamese | 100.0 /100 | #6 | Exceptional 2.4% |
| Immigrants | Bangladesh | 100.0 /100 | #7 | Exceptional 2.4% |
| British West Indians | 100.0 /100 | #8 | Exceptional 2.4% |
| Immigrants | Dominican Republic | 100.0 /100 | #9 | Exceptional 2.4% |
| Immigrants | Ecuador | 99.9 /100 | #10 | Exceptional 2.5% |
| Immigrants | Trinidad and Tobago | 99.9 /100 | #11 | Exceptional 2.5% |
| Trinidadians and Tobagonians | 99.9 /100 | #12 | Exceptional 2.5% |
| Sierra Leoneans | 99.9 /100 | #13 | Exceptional 2.5% |
| Ecuadorians | 99.9 /100 | #14 | Exceptional 2.5% |
| Barbadians | 99.9 /100 | #15 | Exceptional 2.5% |