Choctaw vs Venezuelan Disability Age 18 to 34
COMPARE
Choctaw
Venezuelan
Disability Age 18 to 34
Disability Age 18 to 34 Comparison
Choctaw
Venezuelans
9.0%
DISABILITY AGE 18 TO 34
0.0/ 100
METRIC RATING
340th/ 347
METRIC RANK
5.8%
DISABILITY AGE 18 TO 34
99.9/ 100
METRIC RATING
34th/ 347
METRIC RANK
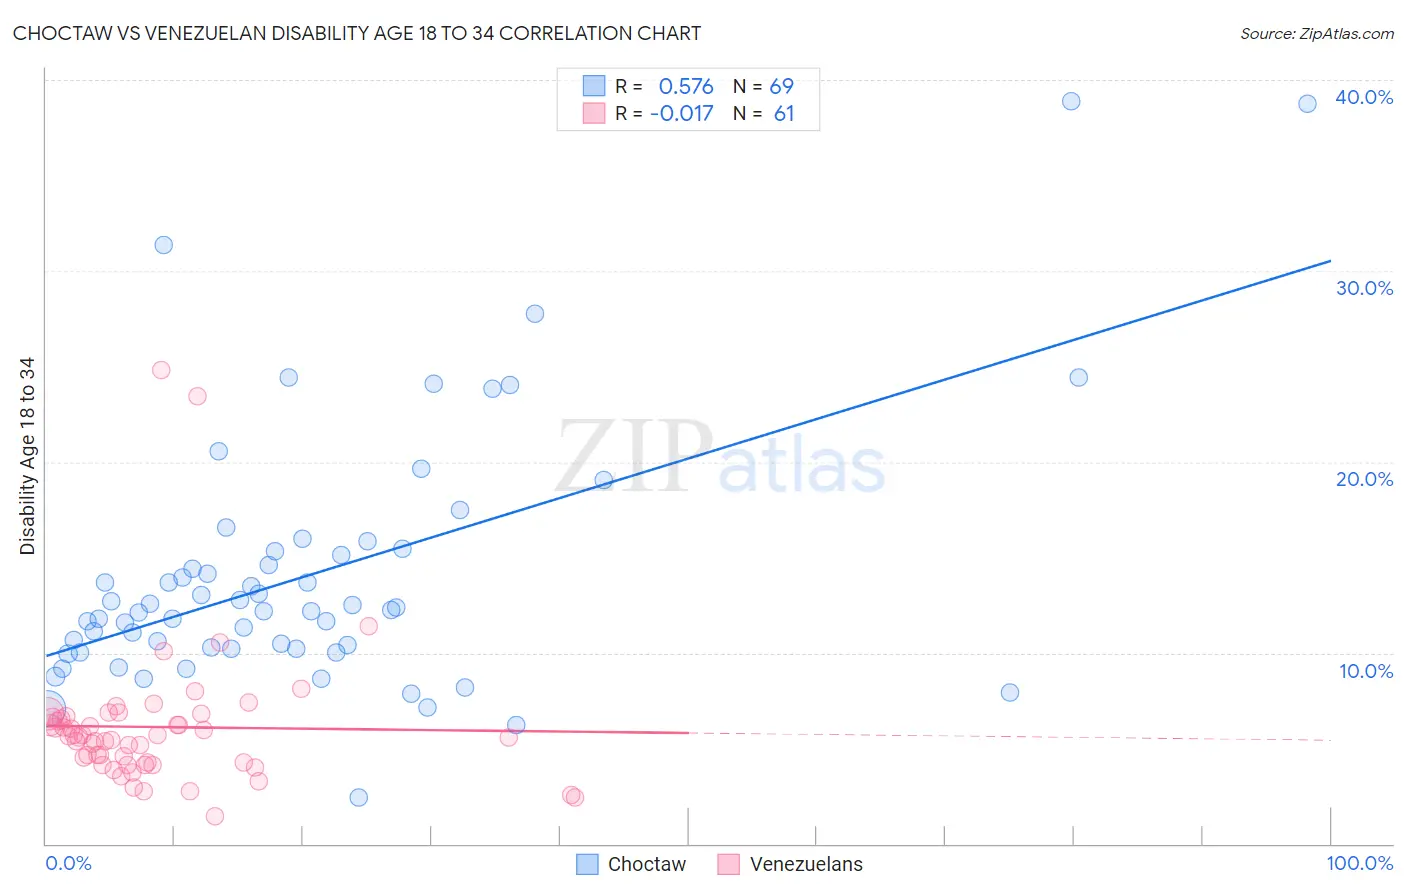
Choctaw vs Venezuelan Disability Age 18 to 34 Correlation Chart
The statistical analysis conducted on geographies consisting of 269,208,215 people shows a substantial positive correlation between the proportion of Choctaw and percentage of population with a disability between the ages 18 and 35 in the United States with a correlation coefficient (R) of 0.576 and weighted average of 9.0%. Similarly, the statistical analysis conducted on geographies consisting of 305,999,562 people shows no correlation between the proportion of Venezuelans and percentage of population with a disability between the ages 18 and 35 in the United States with a correlation coefficient (R) of -0.017 and weighted average of 5.8%, a difference of 55.0%.
Disability Age 18 to 34 Correlation Summary
| Measurement | Choctaw | Venezuelan |
| Minimum | 2.4% | 1.4% |
| Maximum | 38.9% | 24.8% |
| Range | 36.5% | 23.4% |
| Mean | 14.1% | 6.1% |
| Median | 12.2% | 5.6% |
| Interquartile 25% (IQ1) | 10.2% | 4.2% |
| Interquartile 75% (IQ3) | 15.4% | 6.6% |
| Interquartile Range (IQR) | 5.2% | 2.4% |
| Standard Deviation (Sample) | 6.8% | 3.8% |
| Standard Deviation (Population) | 6.7% | 3.8% |
Similar Demographics by Disability Age 18 to 34
Demographics Similar to Choctaw by Disability Age 18 to 34
In terms of disability age 18 to 34, the demographic groups most similar to Choctaw are Chickasaw (9.0%, a difference of 0.080%), Yakama (9.0%, a difference of 0.14%), Chippewa (9.0%, a difference of 0.15%), Creek (9.0%, a difference of 0.53%), and Kiowa (8.8%, a difference of 1.5%).
| Demographics | Rating | Rank | Disability Age 18 to 34 |
| Apache | 0.0 /100 | #333 | Tragic 8.4% |
| Dutch West Indians | 0.0 /100 | #334 | Tragic 8.4% |
| Seminole | 0.0 /100 | #335 | Tragic 8.4% |
| Immigrants | Azores | 0.0 /100 | #336 | Tragic 8.5% |
| Ottawa | 0.0 /100 | #337 | Tragic 8.6% |
| Cherokee | 0.0 /100 | #338 | Tragic 8.7% |
| Kiowa | 0.0 /100 | #339 | Tragic 8.8% |
| Choctaw | 0.0 /100 | #340 | Tragic 9.0% |
| Chickasaw | 0.0 /100 | #341 | Tragic 9.0% |
| Yakama | 0.0 /100 | #342 | Tragic 9.0% |
| Chippewa | 0.0 /100 | #343 | Tragic 9.0% |
| Creek | 0.0 /100 | #344 | Tragic 9.0% |
| Alaskan Athabascans | 0.0 /100 | #345 | Tragic 9.4% |
| Houma | 0.0 /100 | #346 | Tragic 9.7% |
| Yuman | 0.0 /100 | #347 | Tragic 10.6% |
Demographics Similar to Venezuelans by Disability Age 18 to 34
In terms of disability age 18 to 34, the demographic groups most similar to Venezuelans are Argentinean (5.8%, a difference of 0.19%), Iranian (5.8%, a difference of 0.21%), Immigrants from Barbados (5.8%, a difference of 0.21%), Immigrants from Lithuania (5.8%, a difference of 0.22%), and Ecuadorian (5.8%, a difference of 0.38%).
| Demographics | Rating | Rank | Disability Age 18 to 34 |
| Immigrants | Venezuela | 99.9 /100 | #27 | Exceptional 5.7% |
| Soviet Union | 99.9 /100 | #28 | Exceptional 5.7% |
| Immigrants | Ecuador | 99.9 /100 | #29 | Exceptional 5.7% |
| Immigrants | Pakistan | 99.9 /100 | #30 | Exceptional 5.8% |
| Iranians | 99.9 /100 | #31 | Exceptional 5.8% |
| Immigrants | Barbados | 99.9 /100 | #32 | Exceptional 5.8% |
| Argentineans | 99.9 /100 | #33 | Exceptional 5.8% |
| Venezuelans | 99.9 /100 | #34 | Exceptional 5.8% |
| Immigrants | Lithuania | 99.9 /100 | #35 | Exceptional 5.8% |
| Ecuadorians | 99.9 /100 | #36 | Exceptional 5.8% |
| Armenians | 99.9 /100 | #37 | Exceptional 5.8% |
| Immigrants | South America | 99.9 /100 | #38 | Exceptional 5.8% |
| Asians | 99.9 /100 | #39 | Exceptional 5.8% |
| Bolivians | 99.9 /100 | #40 | Exceptional 5.8% |
| Nicaraguans | 99.9 /100 | #41 | Exceptional 5.8% |