Colville vs Irish Disability Age 65 to 74
COMPARE
Colville
Irish
Disability Age 65 to 74
Disability Age 65 to 74 Comparison
Colville
Irish
30.5%
DISABILITY AGE 65 TO 74
0.0/ 100
METRIC RATING
333rd/ 347
METRIC RANK
23.4%
DISABILITY AGE 65 TO 74
44.4/ 100
METRIC RATING
182nd/ 347
METRIC RANK
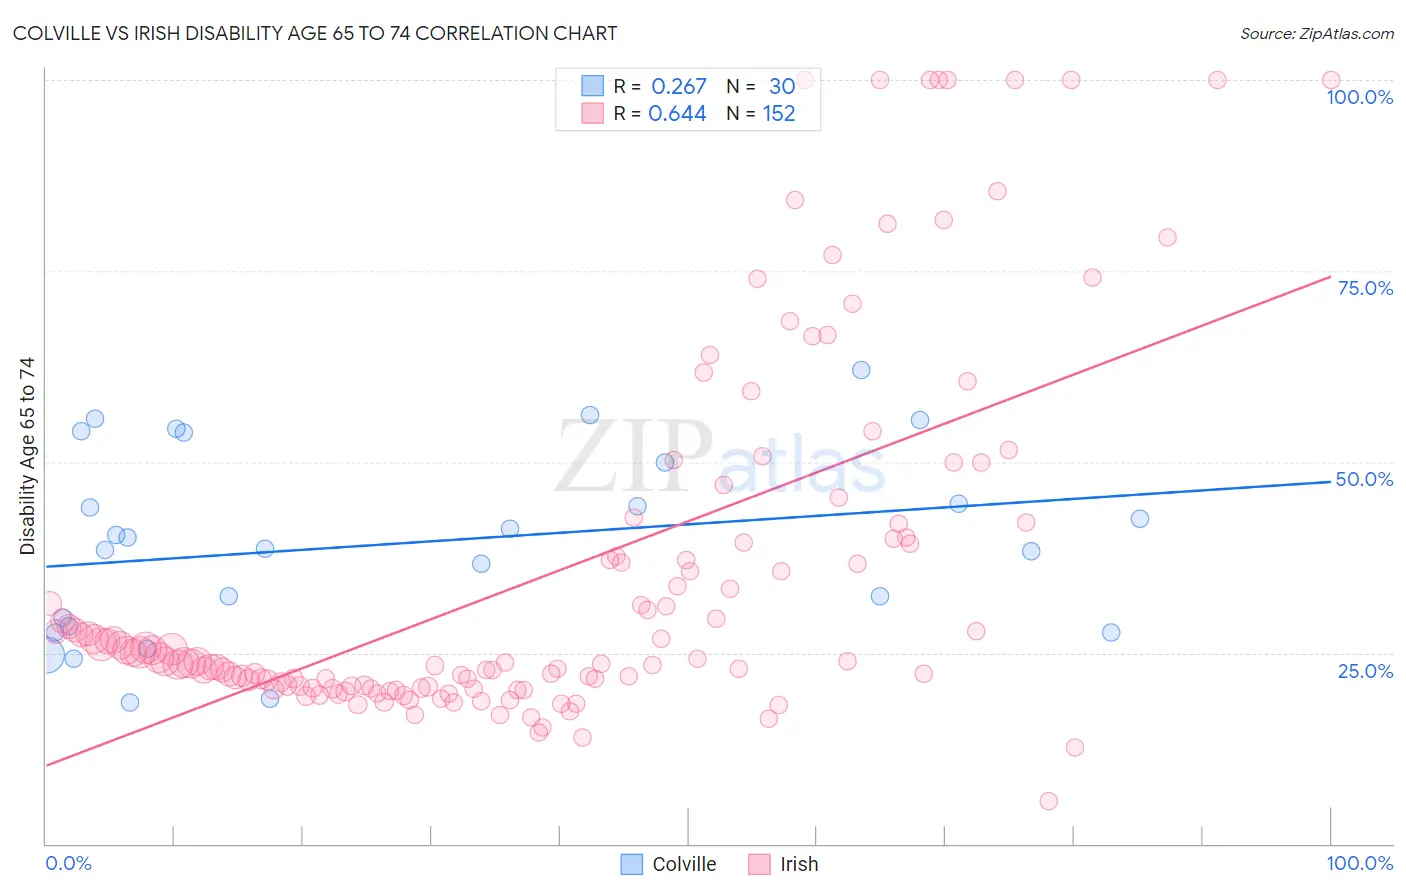
Colville vs Irish Disability Age 65 to 74 Correlation Chart
The statistical analysis conducted on geographies consisting of 34,637,196 people shows a weak positive correlation between the proportion of Colville and percentage of population with a disability between the ages 65 and 75 in the United States with a correlation coefficient (R) of 0.267 and weighted average of 30.5%. Similarly, the statistical analysis conducted on geographies consisting of 577,447,046 people shows a significant positive correlation between the proportion of Irish and percentage of population with a disability between the ages 65 and 75 in the United States with a correlation coefficient (R) of 0.644 and weighted average of 23.4%, a difference of 30.5%.
Disability Age 65 to 74 Correlation Summary
| Measurement | Colville | Irish |
| Minimum | 18.5% | 5.6% |
| Maximum | 62.1% | 100.0% |
| Range | 43.6% | 94.4% |
| Mean | 39.4% | 35.1% |
| Median | 39.3% | 23.9% |
| Interquartile 25% (IQ1) | 28.5% | 20.6% |
| Interquartile 75% (IQ3) | 50.0% | 39.7% |
| Interquartile Range (IQR) | 21.5% | 19.1% |
| Standard Deviation (Sample) | 12.1% | 23.3% |
| Standard Deviation (Population) | 11.9% | 23.3% |
Similar Demographics by Disability Age 65 to 74
Demographics Similar to Colville by Disability Age 65 to 74
In terms of disability age 65 to 74, the demographic groups most similar to Colville are Alaska Native (30.6%, a difference of 0.25%), Native/Alaskan (30.4%, a difference of 0.52%), Chickasaw (30.2%, a difference of 1.1%), Creek (30.2%, a difference of 1.1%), and Choctaw (30.2%, a difference of 1.2%).
| Demographics | Rating | Rank | Disability Age 65 to 74 |
| Yakama | 0.0 /100 | #326 | Tragic 29.6% |
| Apache | 0.0 /100 | #327 | Tragic 29.7% |
| Hopi | 0.0 /100 | #328 | Tragic 30.0% |
| Choctaw | 0.0 /100 | #329 | Tragic 30.2% |
| Creek | 0.0 /100 | #330 | Tragic 30.2% |
| Chickasaw | 0.0 /100 | #331 | Tragic 30.2% |
| Natives/Alaskans | 0.0 /100 | #332 | Tragic 30.4% |
| Colville | 0.0 /100 | #333 | Tragic 30.5% |
| Alaska Natives | 0.0 /100 | #334 | Tragic 30.6% |
| Cheyenne | 0.0 /100 | #335 | Tragic 31.1% |
| Yuman | 0.0 /100 | #336 | Tragic 31.5% |
| Houma | 0.0 /100 | #337 | Tragic 32.3% |
| Alaskan Athabascans | 0.0 /100 | #338 | Tragic 32.4% |
| Kiowa | 0.0 /100 | #339 | Tragic 32.6% |
| Lumbee | 0.0 /100 | #340 | Tragic 32.7% |
Demographics Similar to Irish by Disability Age 65 to 74
In terms of disability age 65 to 74, the demographic groups most similar to Irish are Assyrian/Chaldean/Syriac (23.4%, a difference of 0.060%), Scandinavian (23.4%, a difference of 0.070%), Immigrants from Sierra Leone (23.4%, a difference of 0.080%), Guyanese (23.4%, a difference of 0.090%), and Immigrants from Eastern Africa (23.4%, a difference of 0.090%).
| Demographics | Rating | Rank | Disability Age 65 to 74 |
| Dutch | 49.4 /100 | #175 | Average 23.3% |
| Immigrants | Eritrea | 47.5 /100 | #176 | Average 23.4% |
| Immigrants | Haiti | 47.5 /100 | #177 | Average 23.4% |
| Guyanese | 45.8 /100 | #178 | Average 23.4% |
| Immigrants | Sierra Leone | 45.8 /100 | #179 | Average 23.4% |
| Scandinavians | 45.6 /100 | #180 | Average 23.4% |
| Assyrians/Chaldeans/Syriacs | 45.3 /100 | #181 | Average 23.4% |
| Irish | 44.4 /100 | #182 | Average 23.4% |
| Immigrants | Eastern Africa | 42.8 /100 | #183 | Average 23.4% |
| Immigrants | Germany | 42.5 /100 | #184 | Average 23.4% |
| Haitians | 42.4 /100 | #185 | Average 23.4% |
| Basques | 38.4 /100 | #186 | Fair 23.5% |
| Portuguese | 37.8 /100 | #187 | Fair 23.5% |
| Immigrants | Cuba | 34.0 /100 | #188 | Fair 23.6% |
| Scottish | 33.1 /100 | #189 | Fair 23.6% |