Cree vs British Female Disability
COMPARE
Cree
British
Female Disability
Female Disability Comparison
Cree
British
13.7%
FEMALE DISABILITY
0.0/ 100
METRIC RATING
308th/ 347
METRIC RANK
12.4%
FEMALE DISABILITY
12.7/ 100
METRIC RATING
217th/ 347
METRIC RANK
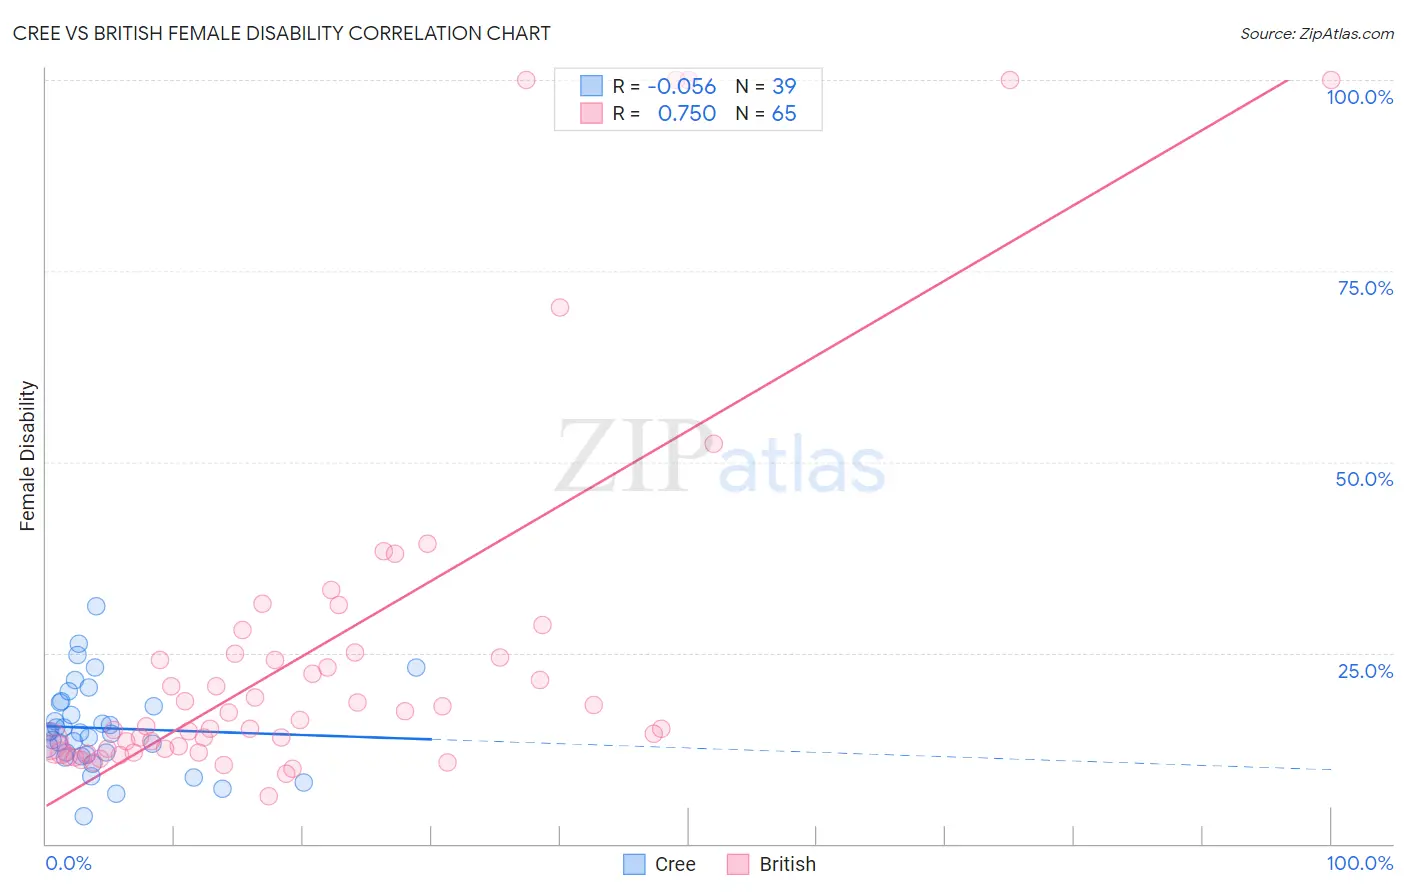
Cree vs British Female Disability Correlation Chart
The statistical analysis conducted on geographies consisting of 76,204,869 people shows a slight negative correlation between the proportion of Cree and percentage of females with a disability in the United States with a correlation coefficient (R) of -0.056 and weighted average of 13.7%. Similarly, the statistical analysis conducted on geographies consisting of 531,338,456 people shows a strong positive correlation between the proportion of British and percentage of females with a disability in the United States with a correlation coefficient (R) of 0.750 and weighted average of 12.4%, a difference of 10.2%.
Female Disability Correlation Summary
| Measurement | Cree | British |
| Minimum | 3.6% | 6.2% |
| Maximum | 31.2% | 100.0% |
| Range | 27.6% | 93.8% |
| Mean | 15.1% | 25.6% |
| Median | 14.6% | 16.2% |
| Interquartile 25% (IQ1) | 11.6% | 12.4% |
| Interquartile 75% (IQ3) | 18.6% | 25.0% |
| Interquartile Range (IQR) | 7.0% | 12.6% |
| Standard Deviation (Sample) | 5.7% | 24.1% |
| Standard Deviation (Population) | 5.6% | 23.9% |
Similar Demographics by Female Disability
Demographics Similar to Cree by Female Disability
In terms of female disability, the demographic groups most similar to Cree are French American Indian (13.7%, a difference of 0.060%), Apache (13.7%, a difference of 0.18%), Central American Indian (13.6%, a difference of 0.46%), Hopi (13.7%, a difference of 0.46%), and French Canadian (13.6%, a difference of 0.75%).
| Demographics | Rating | Rank | Female Disability |
| Africans | 0.0 /100 | #301 | Tragic 13.4% |
| Scotch-Irish | 0.0 /100 | #302 | Tragic 13.4% |
| Immigrants | Portugal | 0.0 /100 | #303 | Tragic 13.5% |
| Immigrants | Micronesia | 0.0 /100 | #304 | Tragic 13.5% |
| Dominicans | 0.0 /100 | #305 | Tragic 13.5% |
| French Canadians | 0.0 /100 | #306 | Tragic 13.6% |
| Central American Indians | 0.0 /100 | #307 | Tragic 13.6% |
| Cree | 0.0 /100 | #308 | Tragic 13.7% |
| French American Indians | 0.0 /100 | #309 | Tragic 13.7% |
| Apache | 0.0 /100 | #310 | Tragic 13.7% |
| Hopi | 0.0 /100 | #311 | Tragic 13.7% |
| Delaware | 0.0 /100 | #312 | Tragic 13.8% |
| Blackfeet | 0.0 /100 | #313 | Tragic 13.8% |
| Puget Sound Salish | 0.0 /100 | #314 | Tragic 13.8% |
| Alaskan Athabascans | 0.0 /100 | #315 | Tragic 13.9% |
Demographics Similar to British by Female Disability
In terms of female disability, the demographic groups most similar to British are Immigrants from Bahamas (12.4%, a difference of 0.020%), Immigrants from Burma/Myanmar (12.4%, a difference of 0.050%), European (12.4%, a difference of 0.050%), Panamanian (12.4%, a difference of 0.060%), and Samoan (12.4%, a difference of 0.060%).
| Demographics | Rating | Rank | Female Disability |
| Swiss | 14.9 /100 | #210 | Poor 12.4% |
| Immigrants | Bosnia and Herzegovina | 14.8 /100 | #211 | Poor 12.4% |
| Ute | 14.7 /100 | #212 | Poor 12.4% |
| Immigrants | Thailand | 14.5 /100 | #213 | Poor 12.4% |
| Panamanians | 13.5 /100 | #214 | Poor 12.4% |
| Samoans | 13.4 /100 | #215 | Poor 12.4% |
| Immigrants | Burma/Myanmar | 13.3 /100 | #216 | Poor 12.4% |
| British | 12.7 /100 | #217 | Poor 12.4% |
| Immigrants | Bahamas | 12.5 /100 | #218 | Poor 12.4% |
| Europeans | 12.1 /100 | #219 | Poor 12.4% |
| Bahamians | 11.1 /100 | #220 | Poor 12.4% |
| Native Hawaiians | 10.8 /100 | #221 | Poor 12.4% |
| Italians | 10.7 /100 | #222 | Poor 12.4% |
| Guamanians/Chamorros | 9.5 /100 | #223 | Tragic 12.5% |
| Belizeans | 9.3 /100 | #224 | Tragic 12.5% |