Crow vs Immigrants from Saudi Arabia Disability Age 5 to 17
COMPARE
Crow
Immigrants from Saudi Arabia
Disability Age 5 to 17
Disability Age 5 to 17 Comparison
Crow
Immigrants from Saudi Arabia
5.4%
DISABILITY AGE 5 TO 17
95.0/ 100
METRIC RATING
124th/ 347
METRIC RANK
5.5%
DISABILITY AGE 5 TO 17
69.1/ 100
METRIC RATING
161st/ 347
METRIC RANK
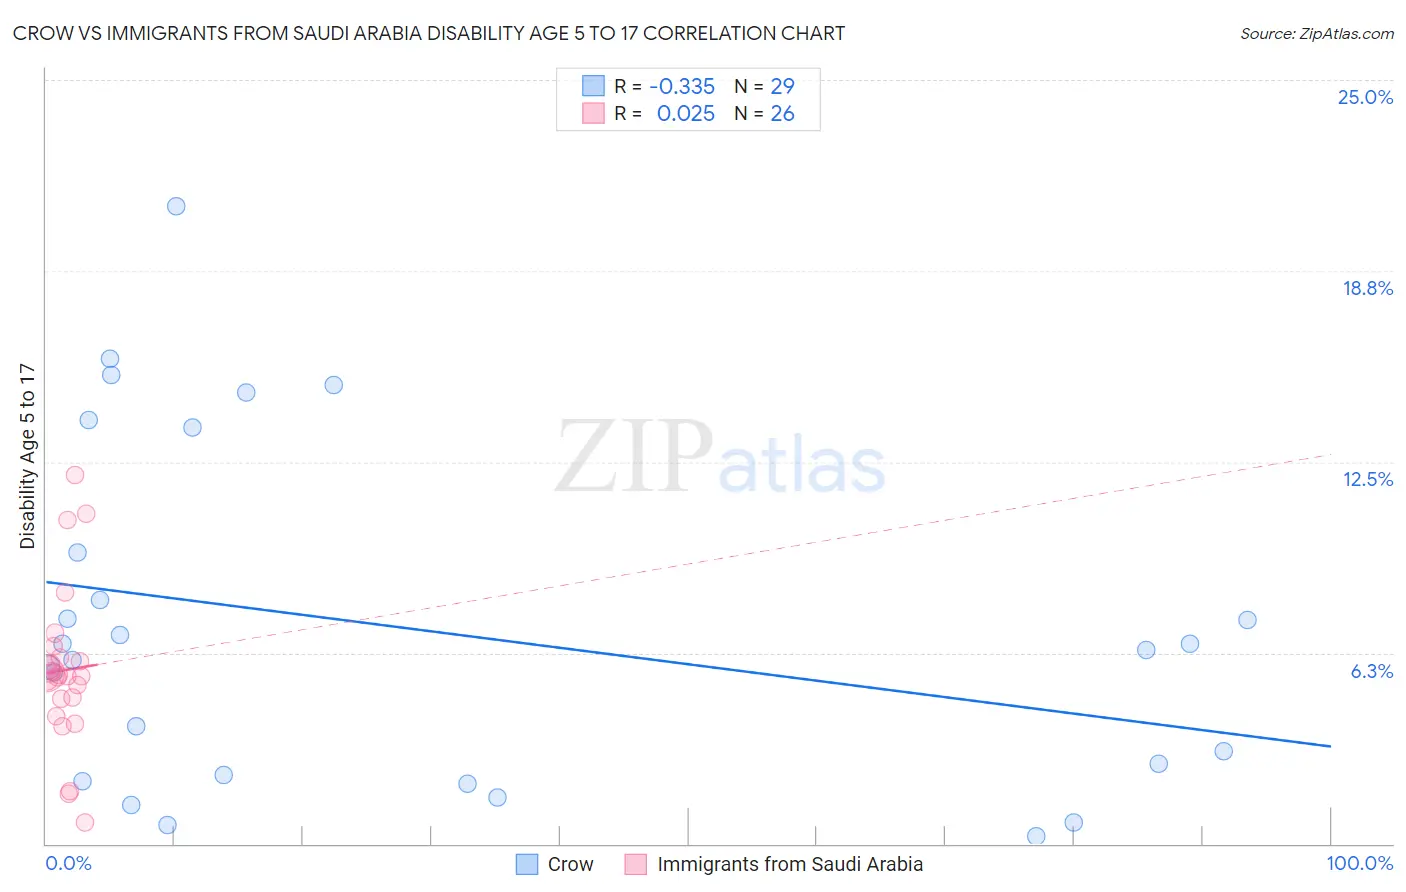
Crow vs Immigrants from Saudi Arabia Disability Age 5 to 17 Correlation Chart
The statistical analysis conducted on geographies consisting of 59,063,912 people shows a mild negative correlation between the proportion of Crow and percentage of population with a disability between the ages 5 and 17 in the United States with a correlation coefficient (R) of -0.335 and weighted average of 5.4%. Similarly, the statistical analysis conducted on geographies consisting of 163,859,029 people shows no correlation between the proportion of Immigrants from Saudi Arabia and percentage of population with a disability between the ages 5 and 17 in the United States with a correlation coefficient (R) of 0.025 and weighted average of 5.5%, a difference of 2.8%.
Disability Age 5 to 17 Correlation Summary
| Measurement | Crow | Immigrants from Saudi Arabia |
| Minimum | 0.26% | 0.70% |
| Maximum | 20.9% | 12.1% |
| Range | 20.6% | 11.4% |
| Mean | 7.1% | 5.7% |
| Median | 6.4% | 5.5% |
| Interquartile 25% (IQ1) | 2.1% | 4.7% |
| Interquartile 75% (IQ3) | 11.6% | 6.1% |
| Interquartile Range (IQR) | 9.4% | 1.4% |
| Standard Deviation (Sample) | 5.6% | 2.6% |
| Standard Deviation (Population) | 5.5% | 2.5% |
Similar Demographics by Disability Age 5 to 17
Demographics Similar to Crow by Disability Age 5 to 17
In terms of disability age 5 to 17, the demographic groups most similar to Crow are Immigrants from Chile (5.4%, a difference of 0.010%), New Zealander (5.4%, a difference of 0.020%), Latvian (5.4%, a difference of 0.030%), Immigrants from Ethiopia (5.4%, a difference of 0.13%), and Immigrants from Venezuela (5.4%, a difference of 0.14%).
| Demographics | Rating | Rank | Disability Age 5 to 17 |
| Immigrants | Afghanistan | 97.4 /100 | #117 | Exceptional 5.3% |
| South Americans | 97.1 /100 | #118 | Exceptional 5.4% |
| Immigrants | South America | 97.1 /100 | #119 | Exceptional 5.4% |
| Immigrants | Immigrants | 97.0 /100 | #120 | Exceptional 5.4% |
| Maltese | 96.0 /100 | #121 | Exceptional 5.4% |
| Chileans | 95.8 /100 | #122 | Exceptional 5.4% |
| Immigrants | Ethiopia | 95.5 /100 | #123 | Exceptional 5.4% |
| Crow | 95.0 /100 | #124 | Exceptional 5.4% |
| Immigrants | Chile | 95.0 /100 | #125 | Exceptional 5.4% |
| New Zealanders | 95.0 /100 | #126 | Exceptional 5.4% |
| Latvians | 95.0 /100 | #127 | Exceptional 5.4% |
| Immigrants | Venezuela | 94.5 /100 | #128 | Exceptional 5.4% |
| Romanians | 94.1 /100 | #129 | Exceptional 5.4% |
| Immigrants | Bulgaria | 94.0 /100 | #130 | Exceptional 5.4% |
| Arabs | 92.9 /100 | #131 | Exceptional 5.4% |
Demographics Similar to Immigrants from Saudi Arabia by Disability Age 5 to 17
In terms of disability age 5 to 17, the demographic groups most similar to Immigrants from Saudi Arabia are Zimbabwean (5.5%, a difference of 0.11%), South African (5.5%, a difference of 0.26%), Immigrants from Southern Europe (5.6%, a difference of 0.28%), Immigrants from Zimbabwe (5.5%, a difference of 0.39%), and Immigrants from Scotland (5.6%, a difference of 0.40%).
| Demographics | Rating | Rank | Disability Age 5 to 17 |
| Australians | 78.8 /100 | #154 | Good 5.5% |
| Immigrants | Ecuador | 78.3 /100 | #155 | Good 5.5% |
| Hawaiians | 78.0 /100 | #156 | Good 5.5% |
| Immigrants | Costa Rica | 77.9 /100 | #157 | Good 5.5% |
| Immigrants | Nepal | 77.1 /100 | #158 | Good 5.5% |
| Immigrants | Zimbabwe | 75.3 /100 | #159 | Good 5.5% |
| South Africans | 73.3 /100 | #160 | Good 5.5% |
| Immigrants | Saudi Arabia | 69.1 /100 | #161 | Good 5.5% |
| Zimbabweans | 67.2 /100 | #162 | Good 5.5% |
| Immigrants | Southern Europe | 64.0 /100 | #163 | Good 5.6% |
| Immigrants | Scotland | 61.9 /100 | #164 | Good 5.6% |
| Lebanese | 61.4 /100 | #165 | Good 5.6% |
| Greeks | 60.6 /100 | #166 | Good 5.6% |
| Immigrants | Burma/Myanmar | 59.3 /100 | #167 | Average 5.6% |
| Iraqis | 56.0 /100 | #168 | Average 5.6% |