Cuban vs Immigrants from Africa Vision Disability
COMPARE
Cuban
Immigrants from Africa
Vision Disability
Vision Disability Comparison
Cubans
Immigrants from Africa
2.4%
VISION DISABILITY
0.1/ 100
METRIC RATING
270th/ 347
METRIC RANK
2.1%
VISION DISABILITY
62.6/ 100
METRIC RATING
167th/ 347
METRIC RANK
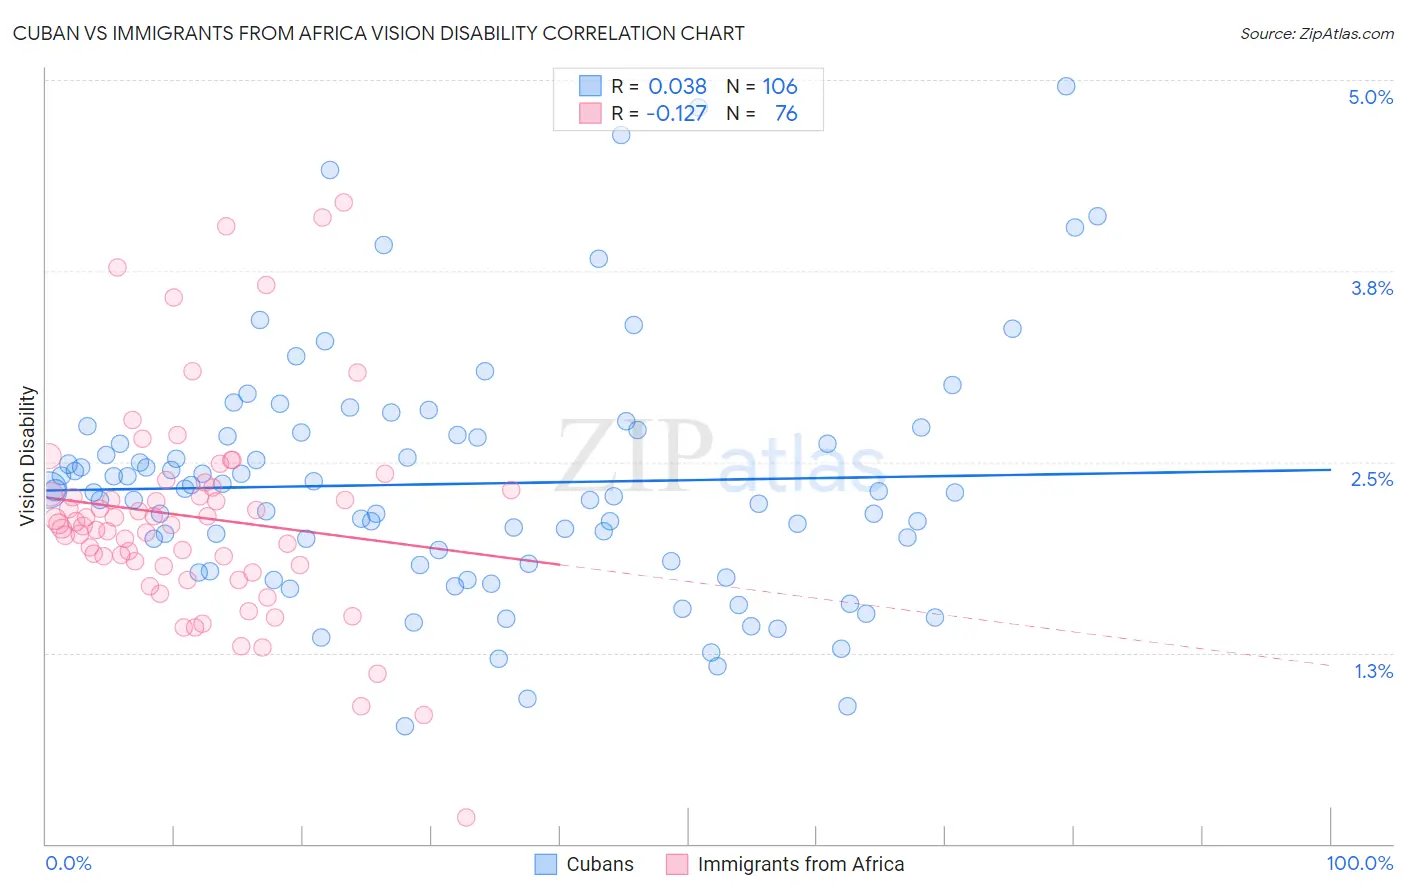
Cuban vs Immigrants from Africa Vision Disability Correlation Chart
The statistical analysis conducted on geographies consisting of 448,885,451 people shows no correlation between the proportion of Cubans and percentage of population with vision disability in the United States with a correlation coefficient (R) of 0.038 and weighted average of 2.4%. Similarly, the statistical analysis conducted on geographies consisting of 468,780,270 people shows a poor negative correlation between the proportion of Immigrants from Africa and percentage of population with vision disability in the United States with a correlation coefficient (R) of -0.127 and weighted average of 2.1%, a difference of 12.1%.
Vision Disability Correlation Summary
| Measurement | Cuban | Immigrants from Africa |
| Minimum | 0.77% | 0.17% |
| Maximum | 5.0% | 4.2% |
| Range | 4.2% | 4.0% |
| Mean | 2.4% | 2.1% |
| Median | 2.3% | 2.1% |
| Interquartile 25% (IQ1) | 1.8% | 1.8% |
| Interquartile 75% (IQ3) | 2.7% | 2.3% |
| Interquartile Range (IQR) | 0.85% | 0.50% |
| Standard Deviation (Sample) | 0.80% | 0.70% |
| Standard Deviation (Population) | 0.79% | 0.70% |
Similar Demographics by Vision Disability
Demographics Similar to Cubans by Vision Disability
In terms of vision disability, the demographic groups most similar to Cubans are Celtic (2.4%, a difference of 0.010%), Immigrants from the Azores (2.4%, a difference of 0.16%), Spaniard (2.4%, a difference of 0.26%), Senegalese (2.4%, a difference of 0.28%), and Ute (2.4%, a difference of 0.37%).
| Demographics | Rating | Rank | Vision Disability |
| Immigrants | Belize | 0.1 /100 | #263 | Tragic 2.4% |
| Immigrants | Liberia | 0.1 /100 | #264 | Tragic 2.4% |
| Immigrants | Jamaica | 0.1 /100 | #265 | Tragic 2.4% |
| Mexican American Indians | 0.1 /100 | #266 | Tragic 2.4% |
| Ute | 0.1 /100 | #267 | Tragic 2.4% |
| Senegalese | 0.1 /100 | #268 | Tragic 2.4% |
| Celtics | 0.1 /100 | #269 | Tragic 2.4% |
| Cubans | 0.1 /100 | #270 | Tragic 2.4% |
| Immigrants | Azores | 0.1 /100 | #271 | Tragic 2.4% |
| Spaniards | 0.1 /100 | #272 | Tragic 2.4% |
| Immigrants | Bahamas | 0.1 /100 | #273 | Tragic 2.4% |
| Immigrants | Latin America | 0.0 /100 | #274 | Tragic 2.4% |
| Chippewa | 0.0 /100 | #275 | Tragic 2.4% |
| Scotch-Irish | 0.0 /100 | #276 | Tragic 2.4% |
| Bahamians | 0.0 /100 | #277 | Tragic 2.4% |
Demographics Similar to Immigrants from Africa by Vision Disability
In terms of vision disability, the demographic groups most similar to Immigrants from Africa are Immigrants from England (2.1%, a difference of 0.010%), Brazilian (2.1%, a difference of 0.030%), Immigrants from Iraq (2.1%, a difference of 0.15%), Immigrants from Bangladesh (2.1%, a difference of 0.20%), and Icelander (2.1%, a difference of 0.24%).
| Demographics | Rating | Rank | Vision Disability |
| Austrians | 69.0 /100 | #160 | Good 2.1% |
| Iraqis | 67.7 /100 | #161 | Good 2.1% |
| Hungarians | 67.4 /100 | #162 | Good 2.1% |
| Icelanders | 66.1 /100 | #163 | Good 2.1% |
| Immigrants | Bangladesh | 65.5 /100 | #164 | Good 2.1% |
| Immigrants | Iraq | 64.8 /100 | #165 | Good 2.1% |
| Immigrants | England | 62.8 /100 | #166 | Good 2.1% |
| Immigrants | Africa | 62.6 /100 | #167 | Good 2.1% |
| Brazilians | 62.2 /100 | #168 | Good 2.1% |
| South American Indians | 57.4 /100 | #169 | Average 2.2% |
| Swiss | 55.7 /100 | #170 | Average 2.2% |
| Lebanese | 54.3 /100 | #171 | Average 2.2% |
| Northern Europeans | 50.1 /100 | #172 | Average 2.2% |
| Scandinavians | 50.0 /100 | #173 | Average 2.2% |
| Immigrants | Canada | 50.0 /100 | #174 | Average 2.2% |