Cypriot vs Greek Male Disability
COMPARE
Cypriot
Greek
Male Disability
Male Disability Comparison
Cypriots
Greeks
10.0%
MALE DISABILITY
100.0/ 100
METRIC RATING
23rd/ 347
METRIC RANK
11.4%
MALE DISABILITY
22.2/ 100
METRIC RATING
193rd/ 347
METRIC RANK
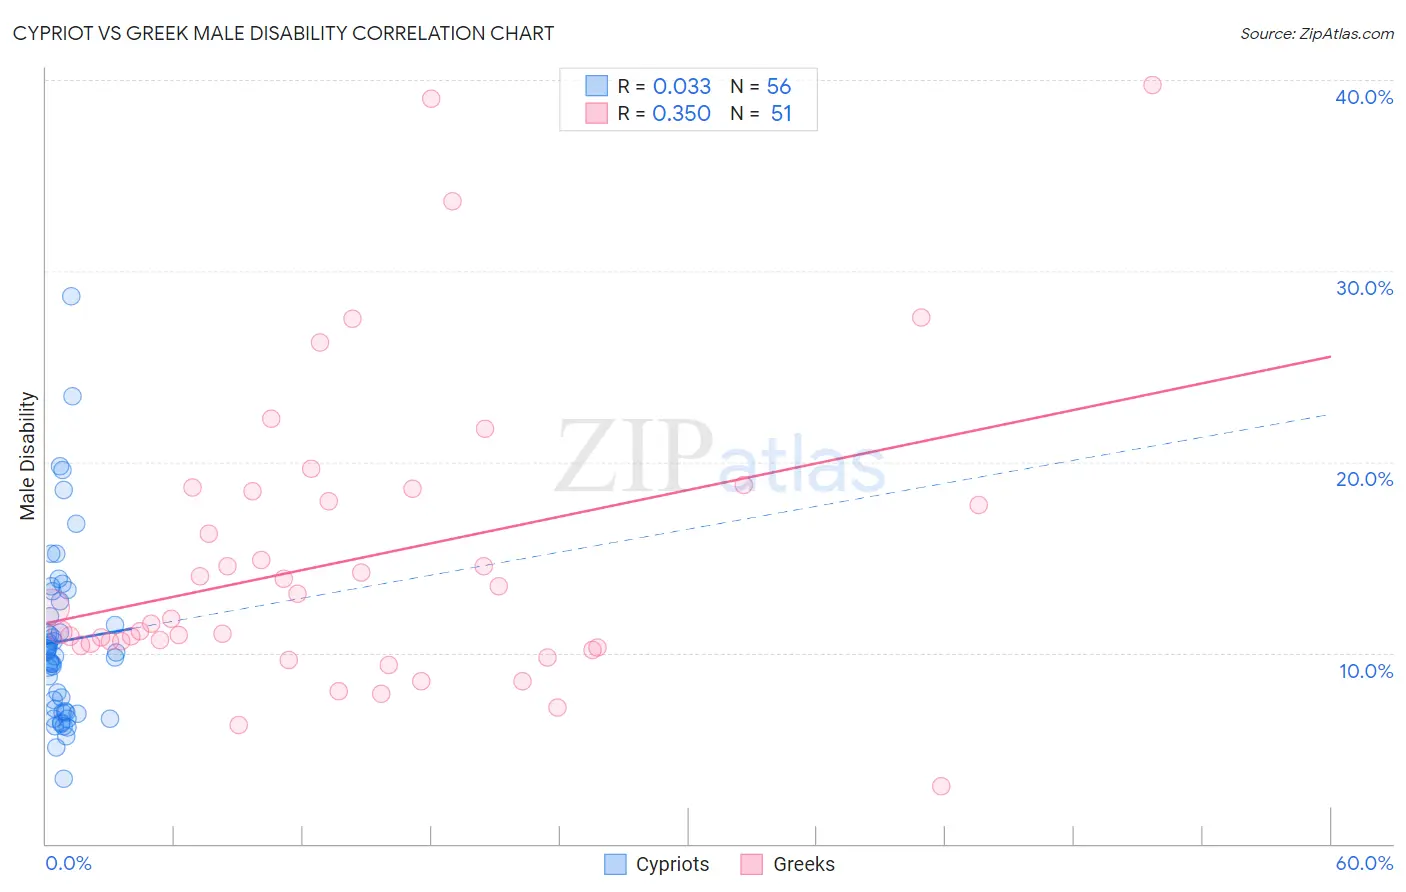
Cypriot vs Greek Male Disability Correlation Chart
The statistical analysis conducted on geographies consisting of 61,868,977 people shows no correlation between the proportion of Cypriots and percentage of males with a disability in the United States with a correlation coefficient (R) of 0.033 and weighted average of 10.0%. Similarly, the statistical analysis conducted on geographies consisting of 482,664,692 people shows a mild positive correlation between the proportion of Greeks and percentage of males with a disability in the United States with a correlation coefficient (R) of 0.350 and weighted average of 11.4%, a difference of 14.0%.
Male Disability Correlation Summary
| Measurement | Cypriot | Greek |
| Minimum | 3.4% | 3.0% |
| Maximum | 28.7% | 39.7% |
| Range | 25.3% | 36.7% |
| Mean | 10.6% | 14.9% |
| Median | 9.9% | 11.8% |
| Interquartile 25% (IQ1) | 6.9% | 10.4% |
| Interquartile 75% (IQ3) | 12.3% | 18.5% |
| Interquartile Range (IQR) | 5.4% | 8.1% |
| Standard Deviation (Sample) | 4.7% | 7.8% |
| Standard Deviation (Population) | 4.6% | 7.7% |
Similar Demographics by Male Disability
Demographics Similar to Cypriots by Male Disability
In terms of male disability, the demographic groups most similar to Cypriots are Immigrants from Venezuela (10.0%, a difference of 0.090%), Immigrants from Asia (10.0%, a difference of 0.14%), Immigrants from Malaysia (10.0%, a difference of 0.32%), Burmese (10.0%, a difference of 0.38%), and Paraguayan (10.1%, a difference of 0.45%).
| Demographics | Rating | Rank | Male Disability |
| Okinawans | 100.0 /100 | #16 | Exceptional 9.8% |
| Immigrants | Korea | 100.0 /100 | #17 | Exceptional 9.8% |
| Immigrants | Pakistan | 100.0 /100 | #18 | Exceptional 9.8% |
| Immigrants | Sri Lanka | 100.0 /100 | #19 | Exceptional 10.0% |
| Asians | 100.0 /100 | #20 | Exceptional 10.0% |
| Burmese | 100.0 /100 | #21 | Exceptional 10.0% |
| Immigrants | Venezuela | 100.0 /100 | #22 | Exceptional 10.0% |
| Cypriots | 100.0 /100 | #23 | Exceptional 10.0% |
| Immigrants | Asia | 100.0 /100 | #24 | Exceptional 10.0% |
| Immigrants | Malaysia | 99.9 /100 | #25 | Exceptional 10.0% |
| Paraguayans | 99.9 /100 | #26 | Exceptional 10.1% |
| Egyptians | 99.9 /100 | #27 | Exceptional 10.1% |
| Vietnamese | 99.9 /100 | #28 | Exceptional 10.1% |
| Venezuelans | 99.9 /100 | #29 | Exceptional 10.1% |
| Immigrants | Egypt | 99.9 /100 | #30 | Exceptional 10.1% |
Demographics Similar to Greeks by Male Disability
In terms of male disability, the demographic groups most similar to Greeks are Assyrian/Chaldean/Syriac (11.4%, a difference of 0.070%), Senegalese (11.4%, a difference of 0.080%), Belizean (11.4%, a difference of 0.080%), Immigrants from Oceania (11.4%, a difference of 0.11%), and Immigrants from Bosnia and Herzegovina (11.4%, a difference of 0.24%).
| Demographics | Rating | Rank | Male Disability |
| Immigrants | Zaire | 27.6 /100 | #186 | Fair 11.4% |
| Immigrants | Austria | 27.3 /100 | #187 | Fair 11.4% |
| Estonians | 26.8 /100 | #188 | Fair 11.4% |
| Immigrants | Netherlands | 25.9 /100 | #189 | Fair 11.4% |
| Immigrants | Bosnia and Herzegovina | 25.4 /100 | #190 | Fair 11.4% |
| Senegalese | 23.2 /100 | #191 | Fair 11.4% |
| Assyrians/Chaldeans/Syriacs | 23.2 /100 | #192 | Fair 11.4% |
| Greeks | 22.2 /100 | #193 | Fair 11.4% |
| Belizeans | 21.2 /100 | #194 | Fair 11.4% |
| Immigrants | Oceania | 20.9 /100 | #195 | Fair 11.4% |
| West Indians | 18.4 /100 | #196 | Poor 11.4% |
| Somalis | 18.2 /100 | #197 | Poor 11.4% |
| Immigrants | Jamaica | 16.3 /100 | #198 | Poor 11.5% |
| Lebanese | 15.4 /100 | #199 | Poor 11.5% |
| Immigrants | Iraq | 13.0 /100 | #200 | Poor 11.5% |