Danish vs Immigrants from Eastern Europe Ambulatory Disability
COMPARE
Danish
Immigrants from Eastern Europe
Ambulatory Disability
Ambulatory Disability Comparison
Danes
Immigrants from Eastern Europe
5.8%
AMBULATORY DISABILITY
96.6/ 100
METRIC RATING
111th/ 347
METRIC RANK
6.0%
AMBULATORY DISABILITY
82.0/ 100
METRIC RATING
148th/ 347
METRIC RANK
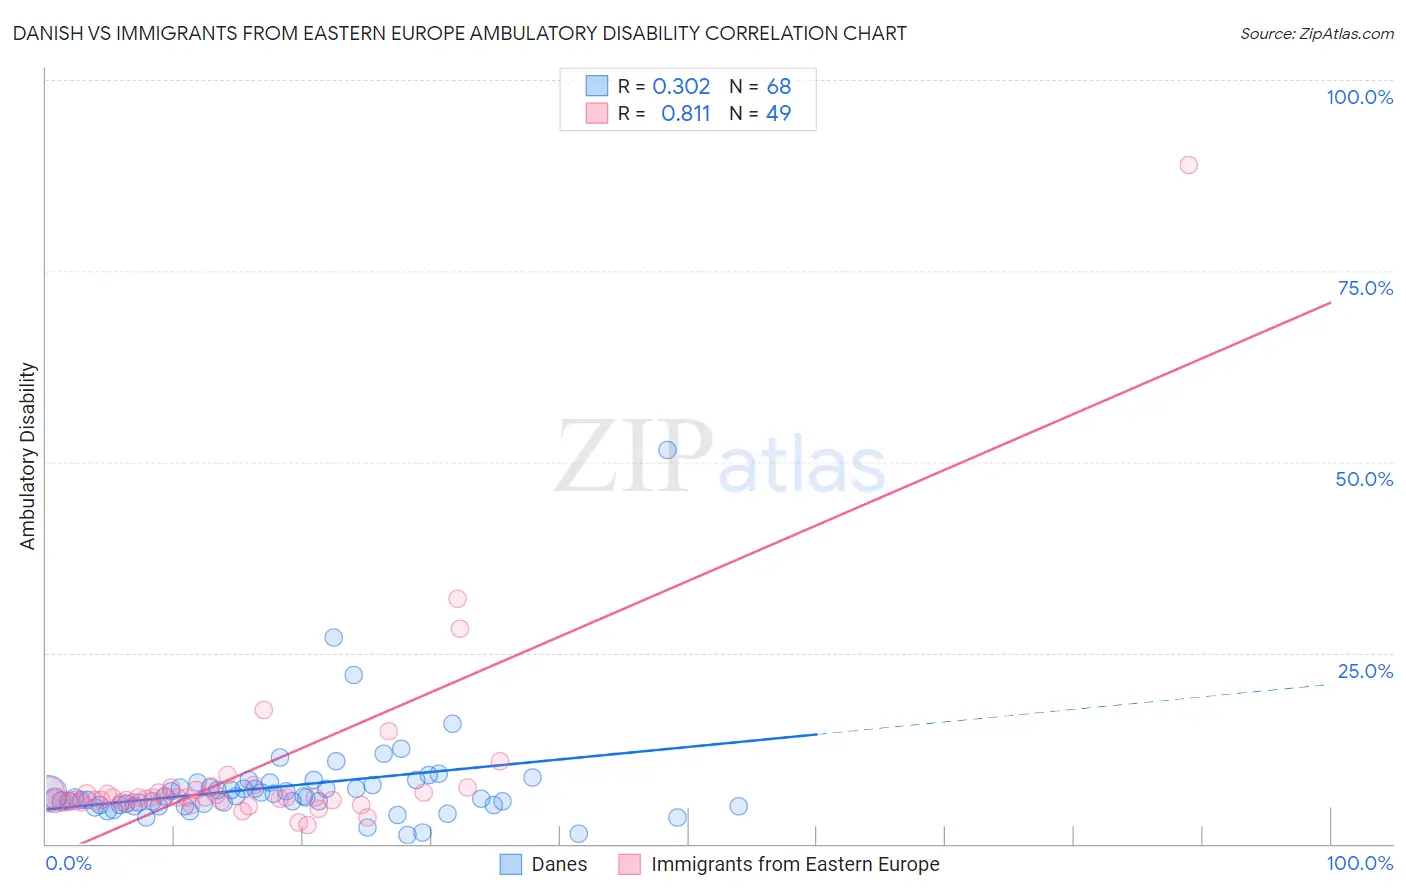
Danish vs Immigrants from Eastern Europe Ambulatory Disability Correlation Chart
The statistical analysis conducted on geographies consisting of 473,952,893 people shows a mild positive correlation between the proportion of Danes and percentage of population with ambulatory disability in the United States with a correlation coefficient (R) of 0.302 and weighted average of 5.8%. Similarly, the statistical analysis conducted on geographies consisting of 475,636,404 people shows a very strong positive correlation between the proportion of Immigrants from Eastern Europe and percentage of population with ambulatory disability in the United States with a correlation coefficient (R) of 0.811 and weighted average of 6.0%, a difference of 2.5%.
Ambulatory Disability Correlation Summary
| Measurement | Danish | Immigrants from Eastern Europe |
| Minimum | 1.2% | 2.4% |
| Maximum | 51.6% | 88.9% |
| Range | 50.4% | 86.4% |
| Mean | 7.5% | 9.1% |
| Median | 6.1% | 6.0% |
| Interquartile 25% (IQ1) | 5.0% | 5.6% |
| Interquartile 75% (IQ3) | 7.5% | 6.9% |
| Interquartile Range (IQR) | 2.5% | 1.3% |
| Standard Deviation (Sample) | 6.7% | 12.8% |
| Standard Deviation (Population) | 6.7% | 12.7% |
Similar Demographics by Ambulatory Disability
Demographics Similar to Danes by Ambulatory Disability
In terms of ambulatory disability, the demographic groups most similar to Danes are Immigrants from Colombia (5.8%, a difference of 0.070%), South African (5.9%, a difference of 0.13%), Immigrants from Netherlands (5.8%, a difference of 0.25%), Colombian (5.8%, a difference of 0.27%), and Uruguayan (5.8%, a difference of 0.28%).
| Demographics | Rating | Rank | Ambulatory Disability |
| New Zealanders | 97.6 /100 | #104 | Exceptional 5.8% |
| Immigrants | Czechoslovakia | 97.4 /100 | #105 | Exceptional 5.8% |
| Immigrants | Morocco | 97.3 /100 | #106 | Exceptional 5.8% |
| Uruguayans | 97.2 /100 | #107 | Exceptional 5.8% |
| Colombians | 97.2 /100 | #108 | Exceptional 5.8% |
| Immigrants | Netherlands | 97.1 /100 | #109 | Exceptional 5.8% |
| Immigrants | Colombia | 96.7 /100 | #110 | Exceptional 5.8% |
| Danes | 96.6 /100 | #111 | Exceptional 5.8% |
| South Africans | 96.3 /100 | #112 | Exceptional 5.9% |
| Immigrants | Uruguay | 95.6 /100 | #113 | Exceptional 5.9% |
| Immigrants | Poland | 95.4 /100 | #114 | Exceptional 5.9% |
| South American Indians | 94.8 /100 | #115 | Exceptional 5.9% |
| Immigrants | Africa | 94.7 /100 | #116 | Exceptional 5.9% |
| Immigrants | South Eastern Asia | 93.6 /100 | #117 | Exceptional 5.9% |
| Russians | 93.4 /100 | #118 | Exceptional 5.9% |
Demographics Similar to Immigrants from Eastern Europe by Ambulatory Disability
In terms of ambulatory disability, the demographic groups most similar to Immigrants from Eastern Europe are Lithuanian (6.0%, a difference of 0.010%), Maltese (6.0%, a difference of 0.030%), Immigrants from Moldova (6.0%, a difference of 0.040%), Pakistani (6.0%, a difference of 0.050%), and Immigrants from Greece (6.0%, a difference of 0.050%).
| Demographics | Rating | Rank | Ambulatory Disability |
| Swedes | 83.1 /100 | #141 | Excellent 6.0% |
| Immigrants | Philippines | 83.0 /100 | #142 | Excellent 6.0% |
| Romanians | 82.9 /100 | #143 | Excellent 6.0% |
| Macedonians | 82.8 /100 | #144 | Excellent 6.0% |
| Pakistanis | 82.5 /100 | #145 | Excellent 6.0% |
| Immigrants | Greece | 82.5 /100 | #146 | Excellent 6.0% |
| Immigrants | Moldova | 82.4 /100 | #147 | Excellent 6.0% |
| Immigrants | Eastern Europe | 82.0 /100 | #148 | Excellent 6.0% |
| Lithuanians | 81.9 /100 | #149 | Excellent 6.0% |
| Maltese | 81.6 /100 | #150 | Excellent 6.0% |
| Greeks | 79.6 /100 | #151 | Good 6.0% |
| Immigrants | Austria | 78.8 /100 | #152 | Good 6.0% |
| Syrians | 75.5 /100 | #153 | Good 6.0% |
| Immigrants | Croatia | 75.1 /100 | #154 | Good 6.0% |
| Immigrants | Scotland | 72.1 /100 | #155 | Good 6.0% |