Ethiopian vs Immigrants from the Azores Cognitive Disability
COMPARE
Ethiopian
Immigrants from the Azores
Cognitive Disability
Cognitive Disability Comparison
Ethiopians
Immigrants from the Azores
17.9%
COGNITIVE DISABILITY
0.5/ 100
METRIC RATING
259th/ 347
METRIC RANK
17.9%
COGNITIVE DISABILITY
0.6/ 100
METRIC RATING
255th/ 347
METRIC RANK
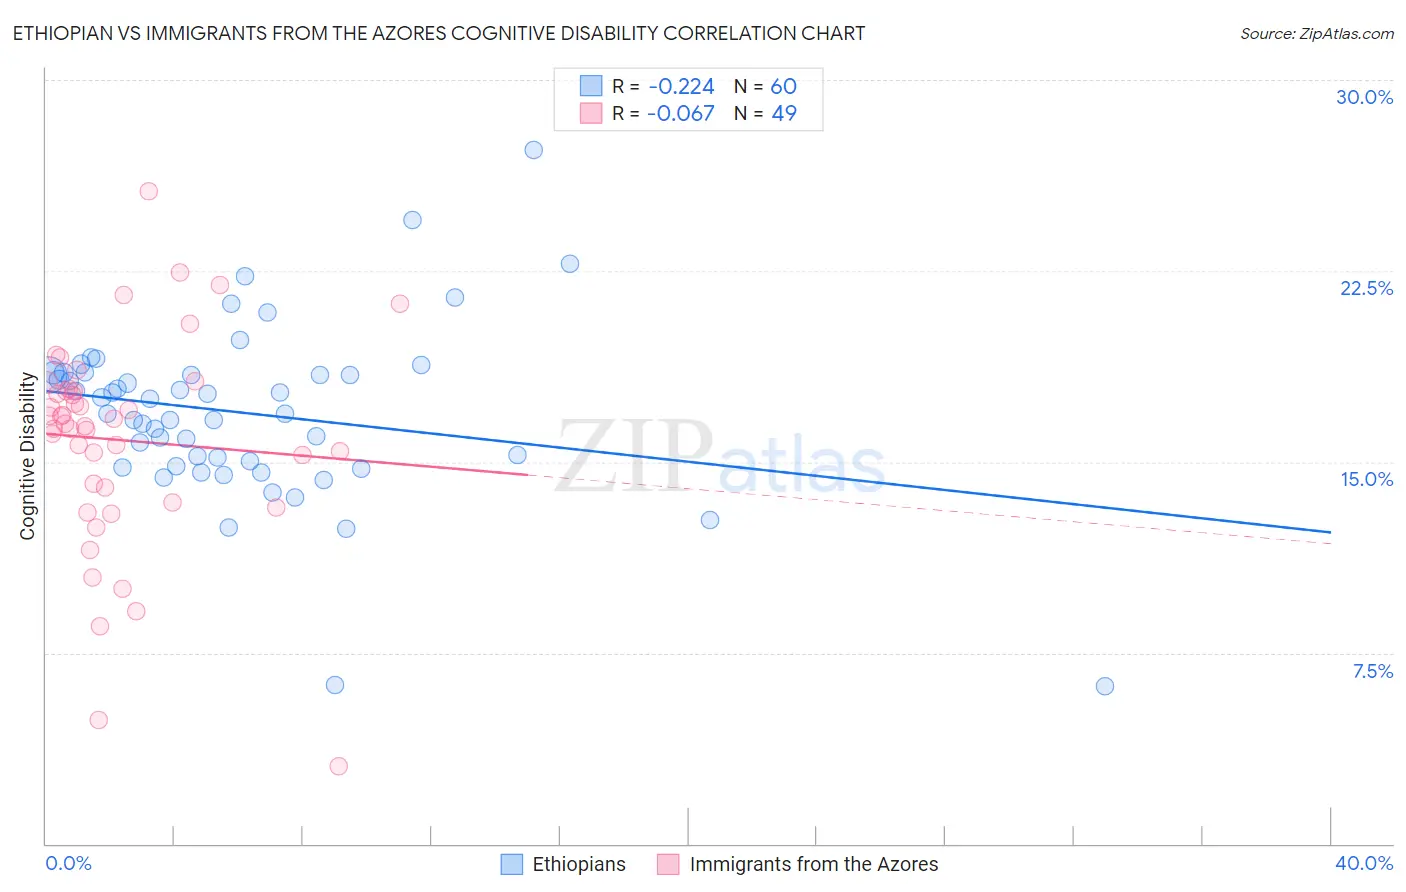
Ethiopian vs Immigrants from the Azores Cognitive Disability Correlation Chart
The statistical analysis conducted on geographies consisting of 223,243,402 people shows a weak negative correlation between the proportion of Ethiopians and percentage of population with cognitive disability in the United States with a correlation coefficient (R) of -0.224 and weighted average of 17.9%. Similarly, the statistical analysis conducted on geographies consisting of 46,257,310 people shows a slight negative correlation between the proportion of Immigrants from the Azores and percentage of population with cognitive disability in the United States with a correlation coefficient (R) of -0.067 and weighted average of 17.9%, a difference of 0.13%.
Cognitive Disability Correlation Summary
| Measurement | Ethiopian | Immigrants from the Azores |
| Minimum | 6.2% | 3.0% |
| Maximum | 27.2% | 25.6% |
| Range | 21.1% | 22.6% |
| Mean | 16.9% | 15.9% |
| Median | 17.2% | 16.5% |
| Interquartile 25% (IQ1) | 14.9% | 13.7% |
| Interquartile 75% (IQ3) | 18.5% | 17.8% |
| Interquartile Range (IQR) | 3.6% | 4.1% |
| Standard Deviation (Sample) | 3.5% | 4.2% |
| Standard Deviation (Population) | 3.4% | 4.1% |
Demographics Similar to Ethiopians and Immigrants from the Azores by Cognitive Disability
In terms of cognitive disability, the demographic groups most similar to Ethiopians are Immigrants from Belize (17.9%, a difference of 0.010%), Guamanian/Chamorro (17.9%, a difference of 0.060%), Immigrants from Armenia (17.9%, a difference of 0.080%), Mexican American Indian (17.9%, a difference of 0.090%), and Sierra Leonean (17.9%, a difference of 0.090%). Similarly, the demographic groups most similar to Immigrants from the Azores are Hispanic or Latino (17.9%, a difference of 0.0%), Bahamian (17.9%, a difference of 0.0%), Hopi (17.9%, a difference of 0.010%), Immigrants from Grenada (17.9%, a difference of 0.020%), and Malaysian (17.9%, a difference of 0.030%).
| Demographics | Rating | Rank | Cognitive Disability |
| Samoans | 0.7 /100 | #247 | Tragic 17.9% |
| French American Indians | 0.7 /100 | #248 | Tragic 17.9% |
| Cree | 0.7 /100 | #249 | Tragic 17.9% |
| Immigrants | Ethiopia | 0.7 /100 | #250 | Tragic 17.9% |
| Malaysians | 0.6 /100 | #251 | Tragic 17.9% |
| Immigrants | Grenada | 0.6 /100 | #252 | Tragic 17.9% |
| Hopi | 0.6 /100 | #253 | Tragic 17.9% |
| Hispanics or Latinos | 0.6 /100 | #254 | Tragic 17.9% |
| Immigrants | Azores | 0.6 /100 | #255 | Tragic 17.9% |
| Bahamians | 0.6 /100 | #256 | Tragic 17.9% |
| Mexican American Indians | 0.6 /100 | #257 | Tragic 17.9% |
| Immigrants | Armenia | 0.6 /100 | #258 | Tragic 17.9% |
| Ethiopians | 0.5 /100 | #259 | Tragic 17.9% |
| Immigrants | Belize | 0.5 /100 | #260 | Tragic 17.9% |
| Guamanians/Chamorros | 0.5 /100 | #261 | Tragic 17.9% |
| Sierra Leoneans | 0.4 /100 | #262 | Tragic 17.9% |
| Immigrants | Barbados | 0.4 /100 | #263 | Tragic 17.9% |
| Menominee | 0.4 /100 | #264 | Tragic 18.0% |
| Spanish Americans | 0.4 /100 | #265 | Tragic 18.0% |
| Belizeans | 0.4 /100 | #266 | Tragic 18.0% |
| Nepalese | 0.3 /100 | #267 | Tragic 18.0% |