French vs Immigrants from Jordan Disability
COMPARE
French
Immigrants from Jordan
Disability
Disability Comparison
French
Immigrants from Jordan
13.2%
DISABILITY
0.0/ 100
METRIC RATING
299th/ 347
METRIC RANK
11.1%
DISABILITY
99.3/ 100
METRIC RATING
79th/ 347
METRIC RANK
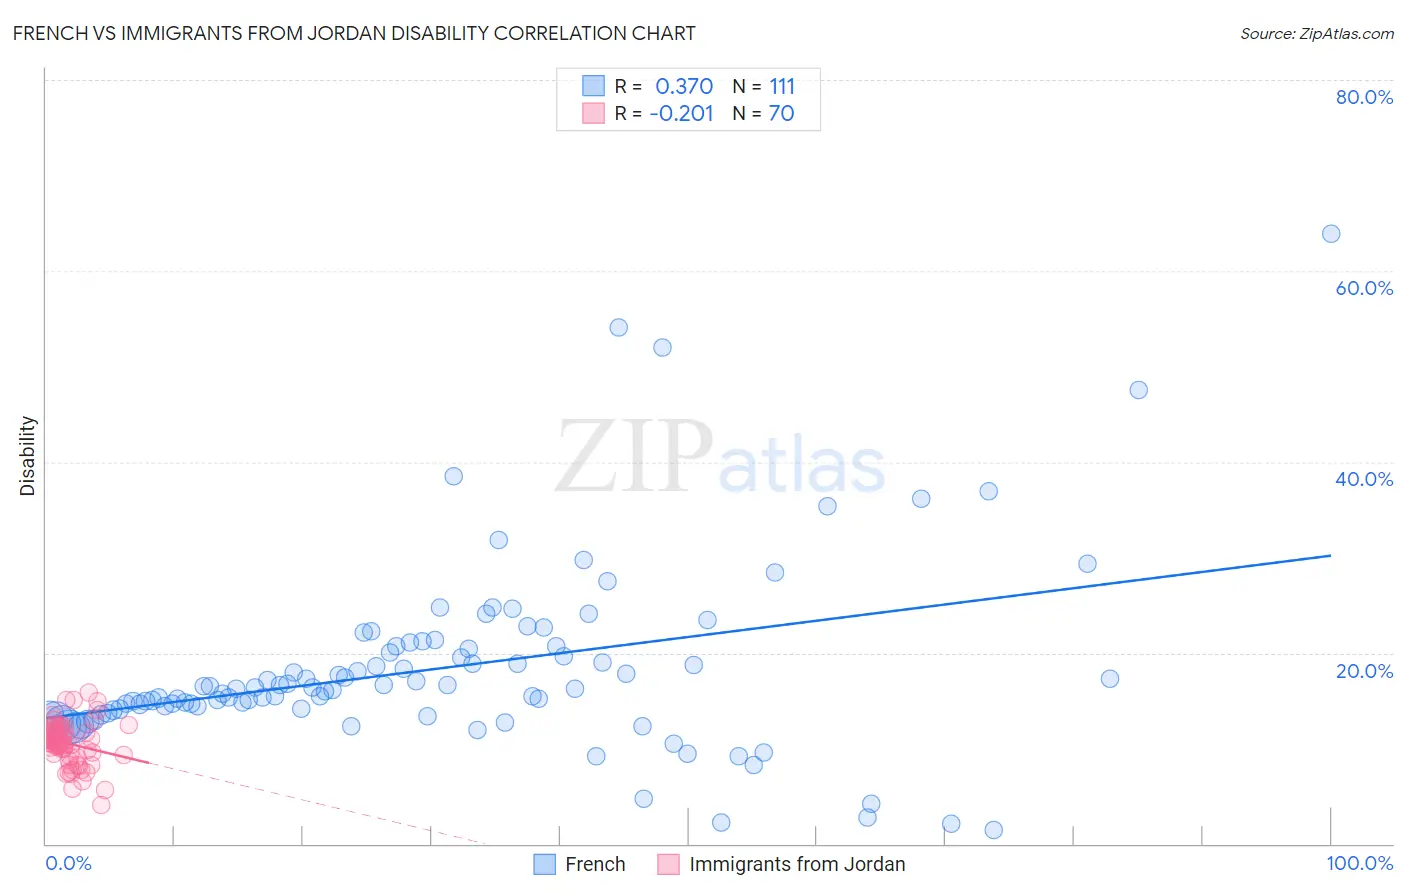
French vs Immigrants from Jordan Disability Correlation Chart
The statistical analysis conducted on geographies consisting of 572,283,731 people shows a mild positive correlation between the proportion of French and percentage of population with a disability in the United States with a correlation coefficient (R) of 0.370 and weighted average of 13.2%. Similarly, the statistical analysis conducted on geographies consisting of 181,277,491 people shows a weak negative correlation between the proportion of Immigrants from Jordan and percentage of population with a disability in the United States with a correlation coefficient (R) of -0.201 and weighted average of 11.1%, a difference of 19.1%.
Disability Correlation Summary
| Measurement | French | Immigrants from Jordan |
| Minimum | 1.5% | 4.0% |
| Maximum | 63.9% | 15.9% |
| Range | 62.4% | 11.8% |
| Mean | 18.3% | 10.5% |
| Median | 16.2% | 10.6% |
| Interquartile 25% (IQ1) | 13.9% | 9.2% |
| Interquartile 75% (IQ3) | 20.7% | 11.8% |
| Interquartile Range (IQR) | 6.7% | 2.5% |
| Standard Deviation (Sample) | 9.7% | 2.3% |
| Standard Deviation (Population) | 9.7% | 2.2% |
Similar Demographics by Disability
Demographics Similar to French by Disability
In terms of disability, the demographic groups most similar to French are Alaska Native (13.2%, a difference of 0.020%), Hopi (13.2%, a difference of 0.030%), Pennsylvania German (13.2%, a difference of 0.050%), Central American Indian (13.2%, a difference of 0.080%), and Nonimmigrants (13.2%, a difference of 0.12%).
| Demographics | Rating | Rank | Disability |
| Aleuts | 0.0 /100 | #292 | Tragic 13.1% |
| Marshallese | 0.0 /100 | #293 | Tragic 13.1% |
| Celtics | 0.0 /100 | #294 | Tragic 13.1% |
| Immigrants | Nonimmigrants | 0.0 /100 | #295 | Tragic 13.2% |
| Central American Indians | 0.0 /100 | #296 | Tragic 13.2% |
| Hopi | 0.0 /100 | #297 | Tragic 13.2% |
| Alaska Natives | 0.0 /100 | #298 | Tragic 13.2% |
| French | 0.0 /100 | #299 | Tragic 13.2% |
| Pennsylvania Germans | 0.0 /100 | #300 | Tragic 13.2% |
| Immigrants | Micronesia | 0.0 /100 | #301 | Tragic 13.2% |
| Arapaho | 0.0 /100 | #302 | Tragic 13.2% |
| Scotch-Irish | 0.0 /100 | #303 | Tragic 13.3% |
| Yakama | 0.0 /100 | #304 | Tragic 13.4% |
| French Canadians | 0.0 /100 | #305 | Tragic 13.4% |
| Cape Verdeans | 0.0 /100 | #306 | Tragic 13.5% |
Demographics Similar to Immigrants from Jordan by Disability
In terms of disability, the demographic groups most similar to Immigrants from Jordan are Immigrants from Cameroon (11.1%, a difference of 0.040%), Immigrants from Ireland (11.1%, a difference of 0.050%), Immigrants from Belgium (11.0%, a difference of 0.070%), Sierra Leonean (11.0%, a difference of 0.080%), and Immigrants from Vietnam (11.0%, a difference of 0.10%).
| Demographics | Rating | Rank | Disability |
| Immigrants | Chile | 99.4 /100 | #72 | Exceptional 11.0% |
| Immigrants | Bangladesh | 99.4 /100 | #73 | Exceptional 11.0% |
| Immigrants | Serbia | 99.4 /100 | #74 | Exceptional 11.0% |
| Immigrants | Vietnam | 99.4 /100 | #75 | Exceptional 11.0% |
| Sierra Leoneans | 99.3 /100 | #76 | Exceptional 11.0% |
| Immigrants | Belgium | 99.3 /100 | #77 | Exceptional 11.0% |
| Immigrants | Cameroon | 99.3 /100 | #78 | Exceptional 11.1% |
| Immigrants | Jordan | 99.3 /100 | #79 | Exceptional 11.1% |
| Immigrants | Ireland | 99.3 /100 | #80 | Exceptional 11.1% |
| Immigrants | Poland | 99.1 /100 | #81 | Exceptional 11.1% |
| Chileans | 99.1 /100 | #82 | Exceptional 11.1% |
| Immigrants | Switzerland | 99.0 /100 | #83 | Exceptional 11.1% |
| Immigrants | Sierra Leone | 99.0 /100 | #84 | Exceptional 11.1% |
| Immigrants | Belarus | 98.9 /100 | #85 | Exceptional 11.1% |
| Immigrants | Russia | 98.9 /100 | #86 | Exceptional 11.1% |