Hispanic or Latino vs Dutch Disability Age Under 5
COMPARE
Hispanic or Latino
Dutch
Disability Age Under 5
Disability Age Under 5 Comparison
Hispanics or Latinos
Dutch
1.3%
DISABILITY AGE UNDER 5
7.7/ 100
METRIC RATING
223rd/ 347
METRIC RANK
1.7%
DISABILITY AGE UNDER 5
0.0/ 100
METRIC RATING
315th/ 347
METRIC RANK
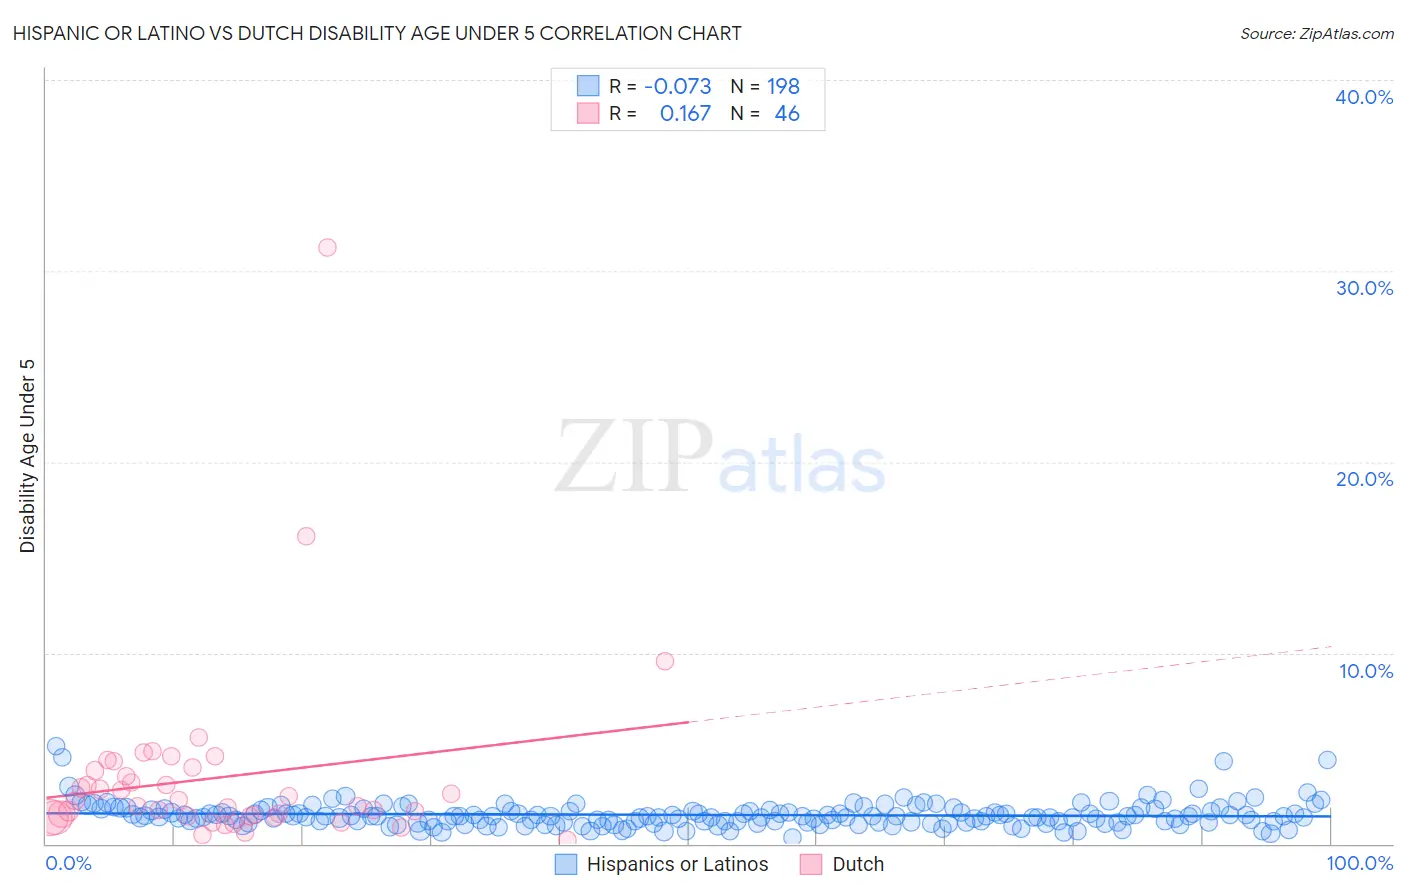
Hispanic or Latino vs Dutch Disability Age Under 5 Correlation Chart
The statistical analysis conducted on geographies consisting of 261,565,458 people shows a slight negative correlation between the proportion of Hispanics or Latinos and percentage of population with a disability under the age of 5 in the United States with a correlation coefficient (R) of -0.073 and weighted average of 1.3%. Similarly, the statistical analysis conducted on geographies consisting of 256,007,977 people shows a poor positive correlation between the proportion of Dutch and percentage of population with a disability under the age of 5 in the United States with a correlation coefficient (R) of 0.167 and weighted average of 1.7%, a difference of 28.3%.
Disability Age Under 5 Correlation Summary
| Measurement | Hispanic or Latino | Dutch |
| Minimum | 0.35% | 0.18% |
| Maximum | 5.1% | 31.2% |
| Range | 4.8% | 31.1% |
| Mean | 1.5% | 3.5% |
| Median | 1.4% | 2.1% |
| Interquartile 25% (IQ1) | 1.1% | 1.5% |
| Interquartile 75% (IQ3) | 1.7% | 3.8% |
| Interquartile Range (IQR) | 0.61% | 2.4% |
| Standard Deviation (Sample) | 0.65% | 4.9% |
| Standard Deviation (Population) | 0.65% | 4.9% |
Similar Demographics by Disability Age Under 5
Demographics Similar to Hispanics or Latinos by Disability Age Under 5
In terms of disability age under 5, the demographic groups most similar to Hispanics or Latinos are Latvian (1.3%, a difference of 0.16%), Subsaharan African (1.3%, a difference of 0.19%), Ukrainian (1.3%, a difference of 0.19%), Panamanian (1.3%, a difference of 0.19%), and Bahamian (1.3%, a difference of 0.19%).
| Demographics | Rating | Rank | Disability Age Under 5 |
| Bangladeshis | 15.5 /100 | #216 | Poor 1.3% |
| Cypriots | 14.9 /100 | #217 | Poor 1.3% |
| Malaysians | 13.2 /100 | #218 | Poor 1.3% |
| Immigrants | Croatia | 11.2 /100 | #219 | Poor 1.3% |
| Serbians | 9.6 /100 | #220 | Tragic 1.3% |
| Sub-Saharan Africans | 8.3 /100 | #221 | Tragic 1.3% |
| Ukrainians | 8.3 /100 | #222 | Tragic 1.3% |
| Hispanics or Latinos | 7.7 /100 | #223 | Tragic 1.3% |
| Latvians | 7.1 /100 | #224 | Tragic 1.3% |
| Panamanians | 7.1 /100 | #225 | Tragic 1.3% |
| Bahamians | 7.1 /100 | #226 | Tragic 1.3% |
| Taiwanese | 6.1 /100 | #227 | Tragic 1.3% |
| Luxembourgers | 6.1 /100 | #228 | Tragic 1.3% |
| Immigrants | Costa Rica | 5.5 /100 | #229 | Tragic 1.3% |
| Lebanese | 5.3 /100 | #230 | Tragic 1.3% |
Demographics Similar to Dutch by Disability Age Under 5
In terms of disability age under 5, the demographic groups most similar to Dutch are Immigrants from Cabo Verde (1.7%, a difference of 0.18%), Norwegian (1.7%, a difference of 0.26%), Celtic (1.7%, a difference of 0.42%), Puerto Rican (1.7%, a difference of 0.58%), and French (1.7%, a difference of 0.61%).
| Demographics | Rating | Rank | Disability Age Under 5 |
| Navajo | 0.0 /100 | #308 | Tragic 1.6% |
| Cape Verdeans | 0.0 /100 | #309 | Tragic 1.7% |
| Whites/Caucasians | 0.0 /100 | #310 | Tragic 1.7% |
| English | 0.0 /100 | #311 | Tragic 1.7% |
| Puerto Ricans | 0.0 /100 | #312 | Tragic 1.7% |
| Celtics | 0.0 /100 | #313 | Tragic 1.7% |
| Norwegians | 0.0 /100 | #314 | Tragic 1.7% |
| Dutch | 0.0 /100 | #315 | Tragic 1.7% |
| Immigrants | Cabo Verde | 0.0 /100 | #316 | Tragic 1.7% |
| French | 0.0 /100 | #317 | Tragic 1.7% |
| Irish | 0.0 /100 | #318 | Tragic 1.7% |
| Slovaks | 0.0 /100 | #319 | Tragic 1.7% |
| Scotch-Irish | 0.0 /100 | #320 | Tragic 1.7% |
| Ottawa | 0.0 /100 | #321 | Tragic 1.7% |
| Germans | 0.0 /100 | #322 | Tragic 1.7% |