Immigrants from Asia vs Jamaican Disability Age 65 to 74
COMPARE
Immigrants from Asia
Jamaican
Disability Age 65 to 74
Disability Age 65 to 74 Comparison
Immigrants from Asia
Jamaicans
21.5%
DISABILITY AGE 65 TO 74
99.5/ 100
METRIC RATING
57th/ 347
METRIC RANK
24.0%
DISABILITY AGE 65 TO 74
12.2/ 100
METRIC RATING
216th/ 347
METRIC RANK
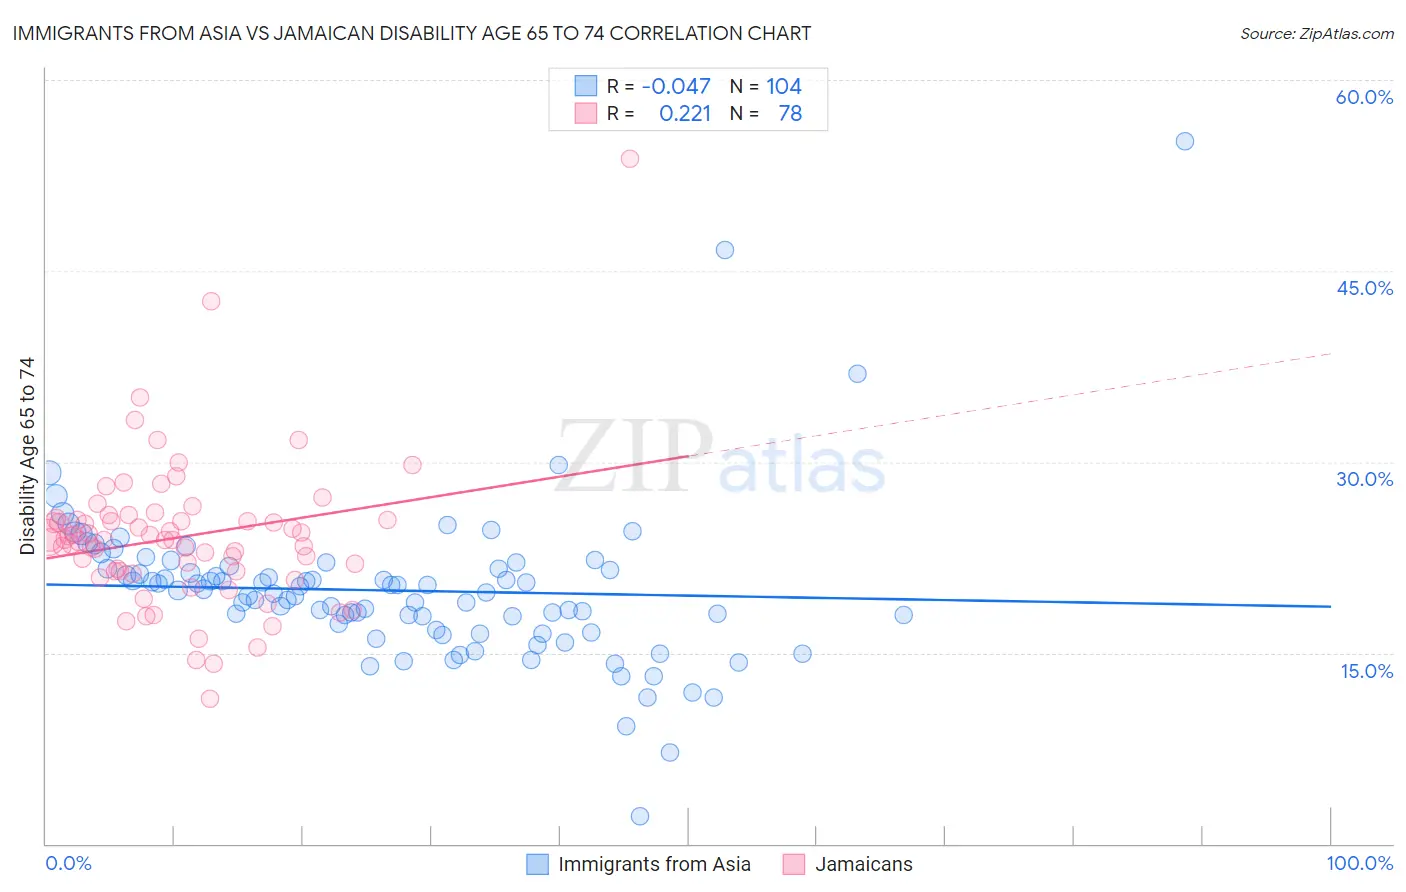
Immigrants from Asia vs Jamaican Disability Age 65 to 74 Correlation Chart
The statistical analysis conducted on geographies consisting of 547,092,389 people shows no correlation between the proportion of Immigrants from Asia and percentage of population with a disability between the ages 65 and 75 in the United States with a correlation coefficient (R) of -0.047 and weighted average of 21.5%. Similarly, the statistical analysis conducted on geographies consisting of 366,923,760 people shows a weak positive correlation between the proportion of Jamaicans and percentage of population with a disability between the ages 65 and 75 in the United States with a correlation coefficient (R) of 0.221 and weighted average of 24.0%, a difference of 11.5%.
Disability Age 65 to 74 Correlation Summary
| Measurement | Immigrants from Asia | Jamaican |
| Minimum | 2.2% | 11.4% |
| Maximum | 55.2% | 53.8% |
| Range | 53.1% | 42.5% |
| Mean | 19.9% | 24.1% |
| Median | 19.8% | 23.9% |
| Interquartile 25% (IQ1) | 17.1% | 21.4% |
| Interquartile 75% (IQ3) | 21.6% | 25.4% |
| Interquartile Range (IQR) | 4.6% | 4.1% |
| Standard Deviation (Sample) | 6.3% | 5.8% |
| Standard Deviation (Population) | 6.3% | 5.8% |
Similar Demographics by Disability Age 65 to 74
Demographics Similar to Immigrants from Asia by Disability Age 65 to 74
In terms of disability age 65 to 74, the demographic groups most similar to Immigrants from Asia are Immigrants from Pakistan (21.5%, a difference of 0.030%), Zimbabwean (21.5%, a difference of 0.070%), Immigrants from Denmark (21.5%, a difference of 0.10%), Immigrants from North Macedonia (21.6%, a difference of 0.10%), and Immigrants from Romania (21.5%, a difference of 0.12%).
| Demographics | Rating | Rank | Disability Age 65 to 74 |
| Immigrants | Malaysia | 99.7 /100 | #50 | Exceptional 21.4% |
| Immigrants | Serbia | 99.6 /100 | #51 | Exceptional 21.4% |
| Immigrants | France | 99.6 /100 | #52 | Exceptional 21.5% |
| Bhutanese | 99.6 /100 | #53 | Exceptional 21.5% |
| Immigrants | Italy | 99.6 /100 | #54 | Exceptional 21.5% |
| Immigrants | Romania | 99.5 /100 | #55 | Exceptional 21.5% |
| Immigrants | Denmark | 99.5 /100 | #56 | Exceptional 21.5% |
| Immigrants | Asia | 99.5 /100 | #57 | Exceptional 21.5% |
| Immigrants | Pakistan | 99.5 /100 | #58 | Exceptional 21.5% |
| Zimbabweans | 99.5 /100 | #59 | Exceptional 21.5% |
| Immigrants | North Macedonia | 99.5 /100 | #60 | Exceptional 21.6% |
| Egyptians | 99.5 /100 | #61 | Exceptional 21.6% |
| Carpatho Rusyns | 99.5 /100 | #62 | Exceptional 21.6% |
| Immigrants | Europe | 99.4 /100 | #63 | Exceptional 21.6% |
| Immigrants | Latvia | 99.4 /100 | #64 | Exceptional 21.6% |
Demographics Similar to Jamaicans by Disability Age 65 to 74
In terms of disability age 65 to 74, the demographic groups most similar to Jamaicans are Immigrants from Portugal (24.0%, a difference of 0.070%), Immigrants from Nigeria (24.0%, a difference of 0.070%), Immigrants from Burma/Myanmar (24.0%, a difference of 0.090%), Pennsylvania German (24.0%, a difference of 0.13%), and Immigrants from Oceania (24.0%, a difference of 0.18%).
| Demographics | Rating | Rank | Disability Age 65 to 74 |
| Immigrants | Kenya | 19.6 /100 | #209 | Poor 23.8% |
| Trinidadians and Tobagonians | 16.4 /100 | #210 | Poor 23.9% |
| Immigrants | West Indies | 15.9 /100 | #211 | Poor 23.9% |
| French | 15.7 /100 | #212 | Poor 23.9% |
| Nicaraguans | 14.3 /100 | #213 | Poor 23.9% |
| Immigrants | Oceania | 13.6 /100 | #214 | Poor 24.0% |
| Pennsylvania Germans | 13.3 /100 | #215 | Poor 24.0% |
| Jamaicans | 12.2 /100 | #216 | Poor 24.0% |
| Immigrants | Portugal | 11.7 /100 | #217 | Poor 24.0% |
| Immigrants | Nigeria | 11.7 /100 | #218 | Poor 24.0% |
| Immigrants | Burma/Myanmar | 11.6 /100 | #219 | Poor 24.0% |
| Ghanaians | 10.4 /100 | #220 | Poor 24.1% |
| Immigrants | Nicaragua | 9.8 /100 | #221 | Tragic 24.1% |
| Native Hawaiians | 9.3 /100 | #222 | Tragic 24.1% |
| Immigrants | Middle Africa | 8.9 /100 | #223 | Tragic 24.1% |