Immigrants from Australia vs Puerto Rican Cognitive Disability
COMPARE
Immigrants from Australia
Puerto Rican
Cognitive Disability
Cognitive Disability Comparison
Immigrants from Australia
Puerto Ricans
17.1%
COGNITIVE DISABILITY
76.0/ 100
METRIC RATING
157th/ 347
METRIC RANK
19.2%
COGNITIVE DISABILITY
0.0/ 100
METRIC RATING
339th/ 347
METRIC RANK
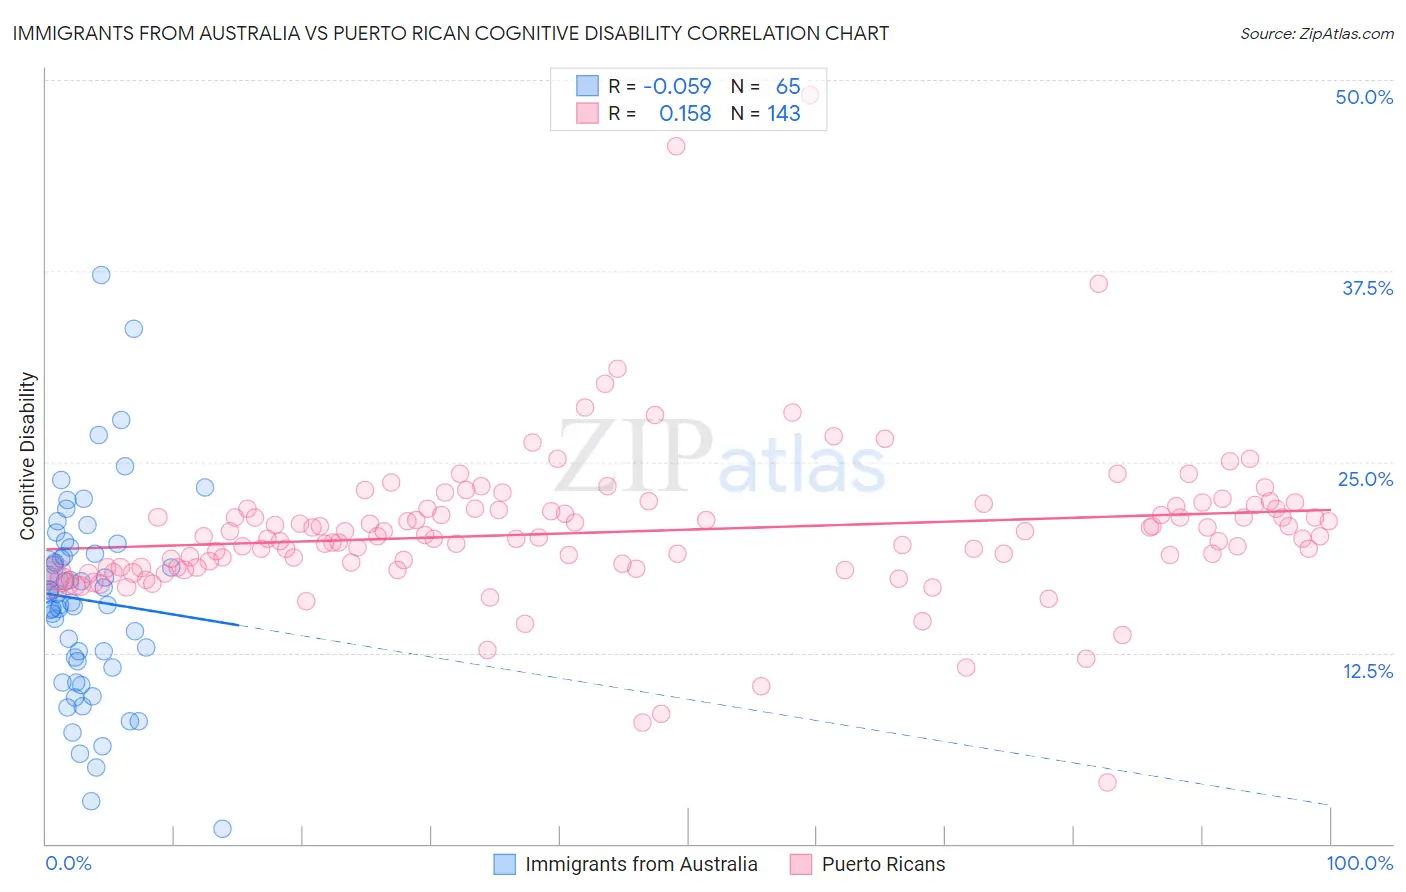
Immigrants from Australia vs Puerto Rican Cognitive Disability Correlation Chart
The statistical analysis conducted on geographies consisting of 227,201,073 people shows a slight negative correlation between the proportion of Immigrants from Australia and percentage of population with cognitive disability in the United States with a correlation coefficient (R) of -0.059 and weighted average of 17.1%. Similarly, the statistical analysis conducted on geographies consisting of 528,170,098 people shows a poor positive correlation between the proportion of Puerto Ricans and percentage of population with cognitive disability in the United States with a correlation coefficient (R) of 0.158 and weighted average of 19.2%, a difference of 12.1%.
Cognitive Disability Correlation Summary
| Measurement | Immigrants from Australia | Puerto Rican |
| Minimum | 0.98% | 4.0% |
| Maximum | 37.3% | 49.0% |
| Range | 36.3% | 44.9% |
| Mean | 15.9% | 20.4% |
| Median | 16.4% | 20.1% |
| Interquartile 25% (IQ1) | 11.8% | 18.1% |
| Interquartile 75% (IQ3) | 19.2% | 21.9% |
| Interquartile Range (IQR) | 7.4% | 3.8% |
| Standard Deviation (Sample) | 6.6% | 5.2% |
| Standard Deviation (Population) | 6.5% | 5.1% |
Similar Demographics by Cognitive Disability
Demographics Similar to Immigrants from Australia by Cognitive Disability
In terms of cognitive disability, the demographic groups most similar to Immigrants from Australia are Celtic (17.1%, a difference of 0.070%), Immigrants from Latvia (17.2%, a difference of 0.11%), Brazilian (17.1%, a difference of 0.12%), Sri Lankan (17.1%, a difference of 0.12%), and Immigrants from Malaysia (17.1%, a difference of 0.14%).
| Demographics | Rating | Rank | Cognitive Disability |
| Basques | 85.5 /100 | #150 | Excellent 17.1% |
| Syrians | 83.0 /100 | #151 | Excellent 17.1% |
| Immigrants | Indonesia | 82.7 /100 | #152 | Excellent 17.1% |
| Immigrants | Kazakhstan | 80.5 /100 | #153 | Excellent 17.1% |
| Immigrants | Malaysia | 79.3 /100 | #154 | Good 17.1% |
| Brazilians | 78.9 /100 | #155 | Good 17.1% |
| Sri Lankans | 78.9 /100 | #156 | Good 17.1% |
| Immigrants | Australia | 76.0 /100 | #157 | Good 17.1% |
| Celtics | 74.1 /100 | #158 | Good 17.1% |
| Immigrants | Latvia | 73.2 /100 | #159 | Good 17.2% |
| Australians | 72.4 /100 | #160 | Good 17.2% |
| Americans | 72.2 /100 | #161 | Good 17.2% |
| Yugoslavians | 71.6 /100 | #162 | Good 17.2% |
| Immigrants | Switzerland | 71.5 /100 | #163 | Good 17.2% |
| Armenians | 70.1 /100 | #164 | Good 17.2% |
Demographics Similar to Puerto Ricans by Cognitive Disability
In terms of cognitive disability, the demographic groups most similar to Puerto Ricans are Cape Verdean (19.2%, a difference of 0.020%), Tohono O'odham (19.3%, a difference of 0.26%), Houma (19.3%, a difference of 0.26%), Lumbee (19.1%, a difference of 0.47%), and Immigrants from Saudi Arabia (19.1%, a difference of 0.82%).
| Demographics | Rating | Rank | Cognitive Disability |
| Immigrants | Sudan | 0.0 /100 | #332 | Tragic 18.8% |
| Immigrants | Yemen | 0.0 /100 | #333 | Tragic 18.8% |
| Sudanese | 0.0 /100 | #334 | Tragic 18.9% |
| Senegalese | 0.0 /100 | #335 | Tragic 19.0% |
| Blacks/African Americans | 0.0 /100 | #336 | Tragic 19.0% |
| Immigrants | Saudi Arabia | 0.0 /100 | #337 | Tragic 19.1% |
| Lumbee | 0.0 /100 | #338 | Tragic 19.1% |
| Puerto Ricans | 0.0 /100 | #339 | Tragic 19.2% |
| Cape Verdeans | 0.0 /100 | #340 | Tragic 19.2% |
| Tohono O'odham | 0.0 /100 | #341 | Tragic 19.3% |
| Houma | 0.0 /100 | #342 | Tragic 19.3% |
| Immigrants | Zaire | 0.0 /100 | #343 | Tragic 19.4% |
| Immigrants | Congo | 0.0 /100 | #344 | Tragic 19.7% |
| Somalis | 0.0 /100 | #345 | Tragic 19.8% |
| Immigrants | Cabo Verde | 0.0 /100 | #346 | Tragic 19.9% |