Immigrants from Bangladesh vs Soviet Union Cognitive Disability
COMPARE
Immigrants from Bangladesh
Soviet Union
Cognitive Disability
Cognitive Disability Comparison
Immigrants from Bangladesh
Soviet Union
17.8%
COGNITIVE DISABILITY
1.0/ 100
METRIC RATING
243rd/ 347
METRIC RANK
16.5%
COGNITIVE DISABILITY
99.8/ 100
METRIC RATING
52nd/ 347
METRIC RANK
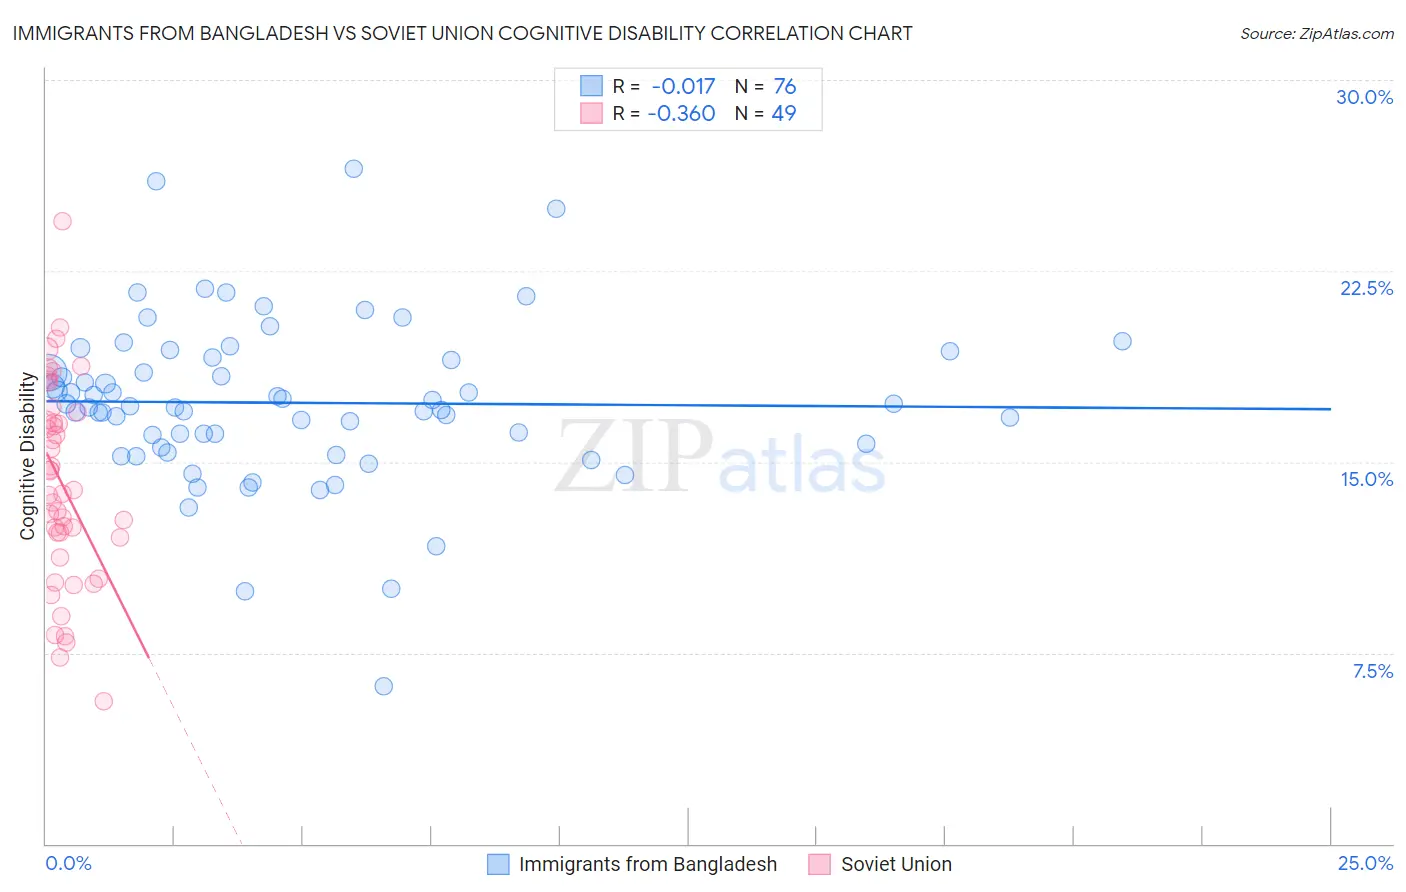
Immigrants from Bangladesh vs Soviet Union Cognitive Disability Correlation Chart
The statistical analysis conducted on geographies consisting of 203,670,223 people shows no correlation between the proportion of Immigrants from Bangladesh and percentage of population with cognitive disability in the United States with a correlation coefficient (R) of -0.017 and weighted average of 17.8%. Similarly, the statistical analysis conducted on geographies consisting of 43,504,324 people shows a mild negative correlation between the proportion of Soviet Union and percentage of population with cognitive disability in the United States with a correlation coefficient (R) of -0.360 and weighted average of 16.5%, a difference of 8.0%.
Cognitive Disability Correlation Summary
| Measurement | Immigrants from Bangladesh | Soviet Union |
| Minimum | 6.2% | 5.6% |
| Maximum | 26.5% | 24.4% |
| Range | 20.3% | 18.8% |
| Mean | 17.3% | 14.1% |
| Median | 17.2% | 13.7% |
| Interquartile 25% (IQ1) | 15.6% | 11.6% |
| Interquartile 75% (IQ3) | 19.1% | 16.8% |
| Interquartile Range (IQR) | 3.4% | 5.2% |
| Standard Deviation (Sample) | 3.2% | 3.9% |
| Standard Deviation (Population) | 3.2% | 3.9% |
Similar Demographics by Cognitive Disability
Demographics Similar to Immigrants from Bangladesh by Cognitive Disability
In terms of cognitive disability, the demographic groups most similar to Immigrants from Bangladesh are Jamaican (17.9%, a difference of 0.040%), Paiute (17.8%, a difference of 0.070%), Mexican (17.8%, a difference of 0.090%), Trinidadian and Tobagonian (17.9%, a difference of 0.13%), and Immigrants from Thailand (17.9%, a difference of 0.15%).
| Demographics | Rating | Rank | Cognitive Disability |
| Immigrants | Iraq | 1.8 /100 | #236 | Tragic 17.8% |
| Immigrants | Mexico | 1.8 /100 | #237 | Tragic 17.8% |
| Cheyenne | 1.7 /100 | #238 | Tragic 17.8% |
| Cajuns | 1.4 /100 | #239 | Tragic 17.8% |
| Iraqis | 1.4 /100 | #240 | Tragic 17.8% |
| Mexicans | 1.1 /100 | #241 | Tragic 17.8% |
| Paiute | 1.1 /100 | #242 | Tragic 17.8% |
| Immigrants | Bangladesh | 1.0 /100 | #243 | Tragic 17.8% |
| Jamaicans | 0.9 /100 | #244 | Tragic 17.9% |
| Trinidadians and Tobagonians | 0.8 /100 | #245 | Tragic 17.9% |
| Immigrants | Thailand | 0.8 /100 | #246 | Tragic 17.9% |
| Samoans | 0.7 /100 | #247 | Tragic 17.9% |
| French American Indians | 0.7 /100 | #248 | Tragic 17.9% |
| Cree | 0.7 /100 | #249 | Tragic 17.9% |
| Immigrants | Ethiopia | 0.7 /100 | #250 | Tragic 17.9% |
Demographics Similar to Soviet Union by Cognitive Disability
In terms of cognitive disability, the demographic groups most similar to Soviet Union are Immigrants from Korea (16.5%, a difference of 0.040%), Swedish (16.5%, a difference of 0.060%), Iranian (16.5%, a difference of 0.090%), Norwegian (16.5%, a difference of 0.090%), and Immigrants from Iran (16.5%, a difference of 0.10%).
| Demographics | Rating | Rank | Cognitive Disability |
| Immigrants | Europe | 99.8 /100 | #45 | Exceptional 16.5% |
| Immigrants | Colombia | 99.8 /100 | #46 | Exceptional 16.5% |
| Immigrants | Italy | 99.8 /100 | #47 | Exceptional 16.5% |
| Immigrants | North America | 99.8 /100 | #48 | Exceptional 16.5% |
| Iranians | 99.8 /100 | #49 | Exceptional 16.5% |
| Norwegians | 99.8 /100 | #50 | Exceptional 16.5% |
| Immigrants | Korea | 99.8 /100 | #51 | Exceptional 16.5% |
| Soviet Union | 99.8 /100 | #52 | Exceptional 16.5% |
| Swedes | 99.8 /100 | #53 | Exceptional 16.5% |
| Immigrants | Iran | 99.8 /100 | #54 | Exceptional 16.5% |
| Immigrants | Venezuela | 99.7 /100 | #55 | Exceptional 16.5% |
| Austrians | 99.7 /100 | #56 | Exceptional 16.6% |
| Bhutanese | 99.7 /100 | #57 | Exceptional 16.6% |
| Pennsylvania Germans | 99.7 /100 | #58 | Exceptional 16.6% |
| Immigrants | Peru | 99.7 /100 | #59 | Exceptional 16.6% |