Immigrants from Bulgaria vs Immigrants Disability Age 35 to 64
COMPARE
Immigrants from Bulgaria
Immigrants
Disability Age 35 to 64
Disability Age 35 to 64 Comparison
Immigrants from Bulgaria
Immigrants
9.8%
DISABILITY AGE 35 TO 64
99.8/ 100
METRIC RATING
52nd/ 347
METRIC RANK
10.7%
DISABILITY AGE 35 TO 64
92.5/ 100
METRIC RATING
133rd/ 347
METRIC RANK
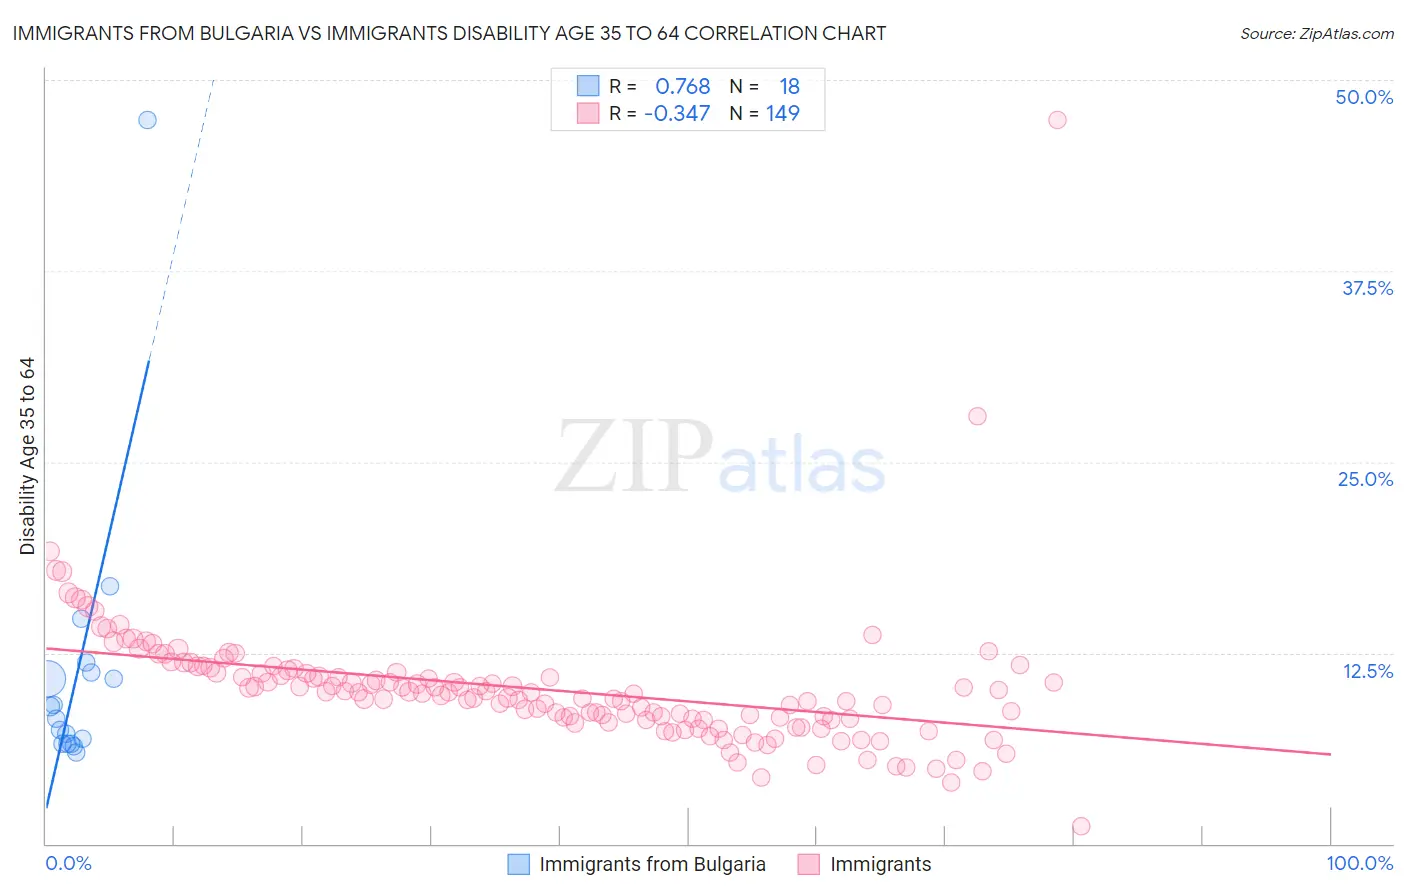
Immigrants from Bulgaria vs Immigrants Disability Age 35 to 64 Correlation Chart
The statistical analysis conducted on geographies consisting of 172,533,865 people shows a strong positive correlation between the proportion of Immigrants from Bulgaria and percentage of population with a disability between the ages 34 and 64 in the United States with a correlation coefficient (R) of 0.768 and weighted average of 9.8%. Similarly, the statistical analysis conducted on geographies consisting of 576,523,974 people shows a mild negative correlation between the proportion of Immigrants and percentage of population with a disability between the ages 34 and 64 in the United States with a correlation coefficient (R) of -0.347 and weighted average of 10.7%, a difference of 8.8%.
Disability Age 35 to 64 Correlation Summary
| Measurement | Immigrants from Bulgaria | Immigrants |
| Minimum | 5.9% | 1.1% |
| Maximum | 47.4% | 47.4% |
| Range | 41.4% | 46.2% |
| Mean | 11.3% | 10.2% |
| Median | 8.6% | 9.9% |
| Interquartile 25% (IQ1) | 6.5% | 8.1% |
| Interquartile 75% (IQ3) | 11.2% | 11.3% |
| Interquartile Range (IQR) | 4.7% | 3.1% |
| Standard Deviation (Sample) | 9.5% | 4.4% |
| Standard Deviation (Population) | 9.2% | 4.4% |
Similar Demographics by Disability Age 35 to 64
Demographics Similar to Immigrants from Bulgaria by Disability Age 35 to 64
In terms of disability age 35 to 64, the demographic groups most similar to Immigrants from Bulgaria are Bhutanese (9.8%, a difference of 0.010%), Taiwanese (9.8%, a difference of 0.060%), Immigrants from Russia (9.8%, a difference of 0.090%), Paraguayan (9.8%, a difference of 0.10%), and Peruvian (9.9%, a difference of 0.16%).
| Demographics | Rating | Rank | Disability Age 35 to 64 |
| Immigrants | Peru | 99.9 /100 | #45 | Exceptional 9.8% |
| Cambodians | 99.8 /100 | #46 | Exceptional 9.8% |
| Immigrants | Belgium | 99.8 /100 | #47 | Exceptional 9.8% |
| Immigrants | Serbia | 99.8 /100 | #48 | Exceptional 9.8% |
| Immigrants | Greece | 99.8 /100 | #49 | Exceptional 9.8% |
| Paraguayans | 99.8 /100 | #50 | Exceptional 9.8% |
| Bhutanese | 99.8 /100 | #51 | Exceptional 9.8% |
| Immigrants | Bulgaria | 99.8 /100 | #52 | Exceptional 9.8% |
| Taiwanese | 99.8 /100 | #53 | Exceptional 9.8% |
| Immigrants | Russia | 99.8 /100 | #54 | Exceptional 9.8% |
| Peruvians | 99.8 /100 | #55 | Exceptional 9.9% |
| South Americans | 99.8 /100 | #56 | Exceptional 9.9% |
| Colombians | 99.8 /100 | #57 | Exceptional 9.9% |
| Armenians | 99.8 /100 | #58 | Exceptional 9.9% |
| Immigrants | Sweden | 99.7 /100 | #59 | Exceptional 9.9% |
Demographics Similar to Immigrants by Disability Age 35 to 64
In terms of disability age 35 to 64, the demographic groups most similar to Immigrants are Immigrants from Albania (10.7%, a difference of 0.0%), Immigrants from Ecuador (10.7%, a difference of 0.0%), Greek (10.7%, a difference of 0.050%), Immigrants from El Salvador (10.7%, a difference of 0.11%), and Immigrants from Syria (10.7%, a difference of 0.16%).
| Demographics | Rating | Rank | Disability Age 35 to 64 |
| Immigrants | Afghanistan | 94.1 /100 | #126 | Exceptional 10.6% |
| Immigrants | Zimbabwe | 94.0 /100 | #127 | Exceptional 10.6% |
| South Africans | 93.3 /100 | #128 | Exceptional 10.7% |
| Ecuadorians | 93.1 /100 | #129 | Exceptional 10.7% |
| Immigrants | Syria | 93.0 /100 | #130 | Exceptional 10.7% |
| Immigrants | El Salvador | 92.8 /100 | #131 | Exceptional 10.7% |
| Immigrants | Albania | 92.5 /100 | #132 | Exceptional 10.7% |
| Immigrants | Immigrants | 92.5 /100 | #133 | Exceptional 10.7% |
| Immigrants | Ecuador | 92.5 /100 | #134 | Exceptional 10.7% |
| Greeks | 92.3 /100 | #135 | Exceptional 10.7% |
| Salvadorans | 91.9 /100 | #136 | Exceptional 10.7% |
| Immigrants | Costa Rica | 91.7 /100 | #137 | Exceptional 10.7% |
| Immigrants | Southern Europe | 91.5 /100 | #138 | Exceptional 10.7% |
| Costa Ricans | 91.4 /100 | #139 | Exceptional 10.7% |
| Immigrants | Scotland | 91.3 /100 | #140 | Exceptional 10.7% |