Immigrants from Cameroon vs Comanche Disability Age Under 5
COMPARE
Immigrants from Cameroon
Comanche
Disability Age Under 5
Disability Age Under 5 Comparison
Immigrants from Cameroon
Comanche
1.4%
DISABILITY AGE UNDER 5
1.7/ 100
METRIC RATING
243rd/ 347
METRIC RANK
1.2%
DISABILITY AGE UNDER 5
47.5/ 100
METRIC RATING
177th/ 347
METRIC RANK
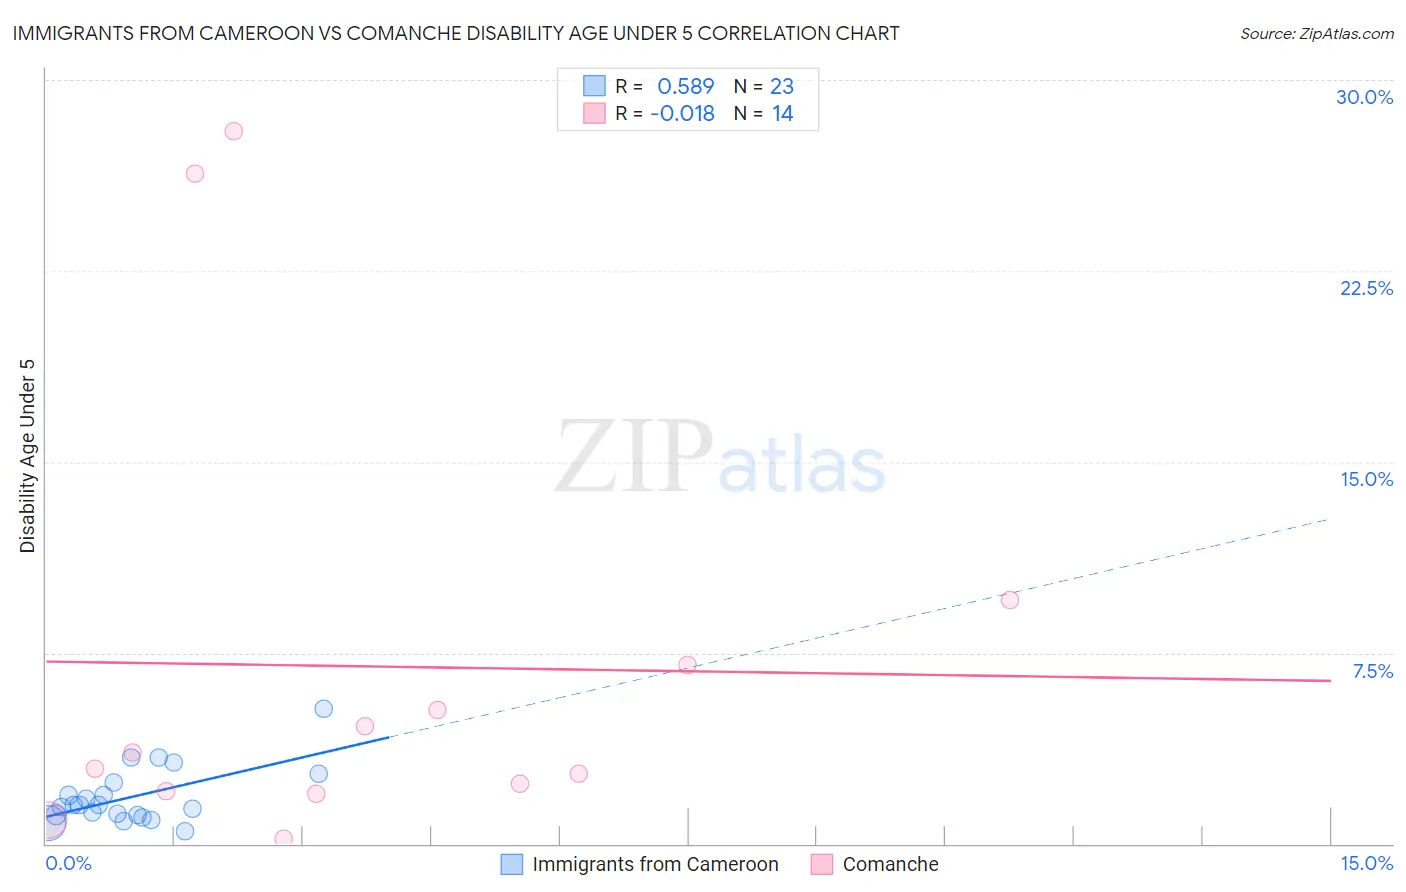
Immigrants from Cameroon vs Comanche Disability Age Under 5 Correlation Chart
The statistical analysis conducted on geographies consisting of 95,639,339 people shows a substantial positive correlation between the proportion of Immigrants from Cameroon and percentage of population with a disability under the age of 5 in the United States with a correlation coefficient (R) of 0.589 and weighted average of 1.4%. Similarly, the statistical analysis conducted on geographies consisting of 83,999,768 people shows no correlation between the proportion of Comanche and percentage of population with a disability under the age of 5 in the United States with a correlation coefficient (R) of -0.018 and weighted average of 1.2%, a difference of 8.9%.
Disability Age Under 5 Correlation Summary
| Measurement | Immigrants from Cameroon | Comanche |
| Minimum | 0.51% | 0.20% |
| Maximum | 5.3% | 28.0% |
| Range | 4.8% | 27.8% |
| Mean | 1.8% | 7.0% |
| Median | 1.5% | 3.3% |
| Interquartile 25% (IQ1) | 1.1% | 2.0% |
| Interquartile 75% (IQ3) | 2.4% | 7.0% |
| Interquartile Range (IQR) | 1.3% | 5.0% |
| Standard Deviation (Sample) | 1.1% | 8.9% |
| Standard Deviation (Population) | 1.1% | 8.6% |
Similar Demographics by Disability Age Under 5
Demographics Similar to Immigrants from Cameroon by Disability Age Under 5
In terms of disability age under 5, the demographic groups most similar to Immigrants from Cameroon are Lumbee (1.3%, a difference of 0.38%), Spaniard (1.4%, a difference of 0.43%), Maltese (1.3%, a difference of 0.46%), Native Hawaiian (1.3%, a difference of 0.53%), and Immigrants from Austria (1.3%, a difference of 0.56%).
| Demographics | Rating | Rank | Disability Age Under 5 |
| South American Indians | 3.3 /100 | #236 | Tragic 1.3% |
| Basques | 3.0 /100 | #237 | Tragic 1.3% |
| Spanish American Indians | 2.4 /100 | #238 | Tragic 1.3% |
| Immigrants | Austria | 2.3 /100 | #239 | Tragic 1.3% |
| Native Hawaiians | 2.2 /100 | #240 | Tragic 1.3% |
| Maltese | 2.2 /100 | #241 | Tragic 1.3% |
| Lumbee | 2.1 /100 | #242 | Tragic 1.3% |
| Immigrants | Cameroon | 1.7 /100 | #243 | Tragic 1.4% |
| Spaniards | 1.4 /100 | #244 | Tragic 1.4% |
| Potawatomi | 1.1 /100 | #245 | Tragic 1.4% |
| Russians | 1.0 /100 | #246 | Tragic 1.4% |
| Immigrants | England | 1.0 /100 | #247 | Tragic 1.4% |
| Eastern Europeans | 1.0 /100 | #248 | Tragic 1.4% |
| Bermudans | 1.0 /100 | #249 | Tragic 1.4% |
| Africans | 1.0 /100 | #250 | Tragic 1.4% |
Demographics Similar to Comanche by Disability Age Under 5
In terms of disability age under 5, the demographic groups most similar to Comanche are Venezuelan (1.2%, a difference of 0.040%), Immigrants from Kenya (1.2%, a difference of 0.090%), Immigrants from Bahamas (1.2%, a difference of 0.21%), Immigrants from Latvia (1.2%, a difference of 0.22%), and Immigrants from Nigeria (1.2%, a difference of 0.22%).
| Demographics | Rating | Rank | Disability Age Under 5 |
| Immigrants | Jamaica | 58.8 /100 | #170 | Average 1.2% |
| Guamanians/Chamorros | 57.8 /100 | #171 | Average 1.2% |
| Crow | 51.0 /100 | #172 | Average 1.2% |
| Immigrants | Ireland | 50.3 /100 | #173 | Average 1.2% |
| Immigrants | Latvia | 50.0 /100 | #174 | Average 1.2% |
| Immigrants | Nigeria | 50.0 /100 | #175 | Average 1.2% |
| Immigrants | Kenya | 48.6 /100 | #176 | Average 1.2% |
| Comanche | 47.5 /100 | #177 | Average 1.2% |
| Venezuelans | 47.1 /100 | #178 | Average 1.2% |
| Immigrants | Bahamas | 45.2 /100 | #179 | Average 1.2% |
| Immigrants | Mexico | 44.4 /100 | #180 | Average 1.2% |
| Immigrants | Peru | 43.7 /100 | #181 | Average 1.2% |
| Macedonians | 43.7 /100 | #181 | Average 1.2% |
| Immigrants | Saudi Arabia | 43.3 /100 | #183 | Average 1.2% |
| Palestinians | 43.0 /100 | #184 | Average 1.2% |