Immigrants from China vs West Indian Ambulatory Disability
COMPARE
Immigrants from China
West Indian
Ambulatory Disability
Ambulatory Disability Comparison
Immigrants from China
West Indians
5.3%
AMBULATORY DISABILITY
100.0/ 100
METRIC RATING
15th/ 347
METRIC RANK
6.9%
AMBULATORY DISABILITY
0.0/ 100
METRIC RATING
291st/ 347
METRIC RANK
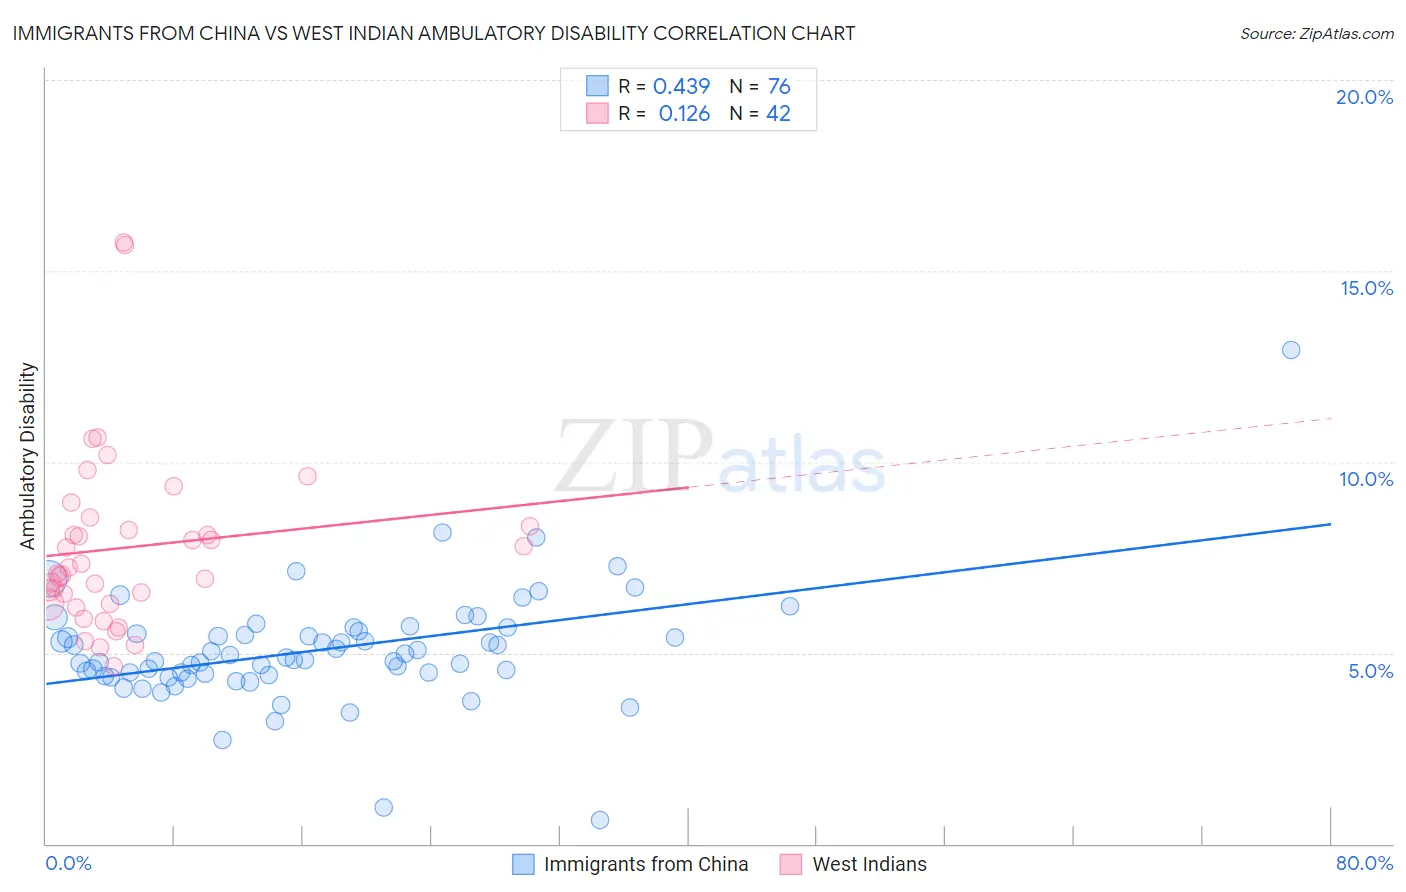
Immigrants from China vs West Indian Ambulatory Disability Correlation Chart
The statistical analysis conducted on geographies consisting of 456,848,702 people shows a moderate positive correlation between the proportion of Immigrants from China and percentage of population with ambulatory disability in the United States with a correlation coefficient (R) of 0.439 and weighted average of 5.3%. Similarly, the statistical analysis conducted on geographies consisting of 253,984,061 people shows a poor positive correlation between the proportion of West Indians and percentage of population with ambulatory disability in the United States with a correlation coefficient (R) of 0.126 and weighted average of 6.9%, a difference of 29.4%.
Ambulatory Disability Correlation Summary
| Measurement | Immigrants from China | West Indian |
| Minimum | 0.61% | 4.7% |
| Maximum | 12.9% | 15.7% |
| Range | 12.3% | 11.1% |
| Mean | 5.1% | 7.8% |
| Median | 4.8% | 7.2% |
| Interquartile 25% (IQ1) | 4.4% | 6.3% |
| Interquartile 75% (IQ3) | 5.5% | 8.3% |
| Interquartile Range (IQR) | 1.1% | 2.0% |
| Standard Deviation (Sample) | 1.5% | 2.3% |
| Standard Deviation (Population) | 1.5% | 2.3% |
Similar Demographics by Ambulatory Disability
Demographics Similar to Immigrants from China by Ambulatory Disability
In terms of ambulatory disability, the demographic groups most similar to Immigrants from China are Immigrants from Eastern Asia (5.3%, a difference of 0.33%), Burmese (5.3%, a difference of 0.48%), Immigrants from Hong Kong (5.3%, a difference of 0.54%), Immigrants from Ethiopia (5.4%, a difference of 0.88%), and Immigrants from Sri Lanka (5.4%, a difference of 0.88%).
| Demographics | Rating | Rank | Ambulatory Disability |
| Immigrants | South Central Asia | 100.0 /100 | #8 | Exceptional 5.1% |
| Iranians | 100.0 /100 | #9 | Exceptional 5.1% |
| Yup'ik | 100.0 /100 | #10 | Exceptional 5.2% |
| Immigrants | Korea | 100.0 /100 | #11 | Exceptional 5.2% |
| Okinawans | 100.0 /100 | #12 | Exceptional 5.3% |
| Burmese | 100.0 /100 | #13 | Exceptional 5.3% |
| Immigrants | Eastern Asia | 100.0 /100 | #14 | Exceptional 5.3% |
| Immigrants | China | 100.0 /100 | #15 | Exceptional 5.3% |
| Immigrants | Hong Kong | 100.0 /100 | #16 | Exceptional 5.3% |
| Immigrants | Ethiopia | 100.0 /100 | #17 | Exceptional 5.4% |
| Immigrants | Sri Lanka | 100.0 /100 | #18 | Exceptional 5.4% |
| Indians (Asian) | 100.0 /100 | #19 | Exceptional 5.4% |
| Ethiopians | 100.0 /100 | #20 | Exceptional 5.4% |
| Immigrants | Kuwait | 100.0 /100 | #21 | Exceptional 5.4% |
| Immigrants | Israel | 100.0 /100 | #22 | Exceptional 5.4% |
Demographics Similar to West Indians by Ambulatory Disability
In terms of ambulatory disability, the demographic groups most similar to West Indians are Cheyenne (6.9%, a difference of 0.060%), Scotch-Irish (6.9%, a difference of 0.10%), Immigrants from Dominica (6.9%, a difference of 0.12%), Nonimmigrants (6.9%, a difference of 0.27%), and Immigrants from St. Vincent and the Grenadines (6.9%, a difference of 0.30%).
| Demographics | Rating | Rank | Ambulatory Disability |
| Immigrants | Jamaica | 0.0 /100 | #284 | Tragic 6.8% |
| Fijians | 0.0 /100 | #285 | Tragic 6.8% |
| Yakama | 0.0 /100 | #286 | Tragic 6.8% |
| U.S. Virgin Islanders | 0.0 /100 | #287 | Tragic 6.8% |
| Immigrants | Nonimmigrants | 0.0 /100 | #288 | Tragic 6.9% |
| Immigrants | Dominica | 0.0 /100 | #289 | Tragic 6.9% |
| Scotch-Irish | 0.0 /100 | #290 | Tragic 6.9% |
| West Indians | 0.0 /100 | #291 | Tragic 6.9% |
| Cheyenne | 0.0 /100 | #292 | Tragic 6.9% |
| Immigrants | St. Vincent and the Grenadines | 0.0 /100 | #293 | Tragic 6.9% |
| Cape Verdeans | 0.0 /100 | #294 | Tragic 6.9% |
| Crow | 0.0 /100 | #295 | Tragic 6.9% |
| Alaskan Athabascans | 0.0 /100 | #296 | Tragic 6.9% |
| French American Indians | 0.0 /100 | #297 | Tragic 6.9% |
| Immigrants | Grenada | 0.0 /100 | #298 | Tragic 6.9% |