Immigrants from Costa Rica vs Bangladeshi Disability Age 5 to 17
COMPARE
Immigrants from Costa Rica
Bangladeshi
Disability Age 5 to 17
Disability Age 5 to 17 Comparison
Immigrants from Costa Rica
Bangladeshis
5.5%
DISABILITY AGE 5 TO 17
77.9/ 100
METRIC RATING
157th/ 347
METRIC RANK
5.8%
DISABILITY AGE 5 TO 17
4.8/ 100
METRIC RATING
229th/ 347
METRIC RANK
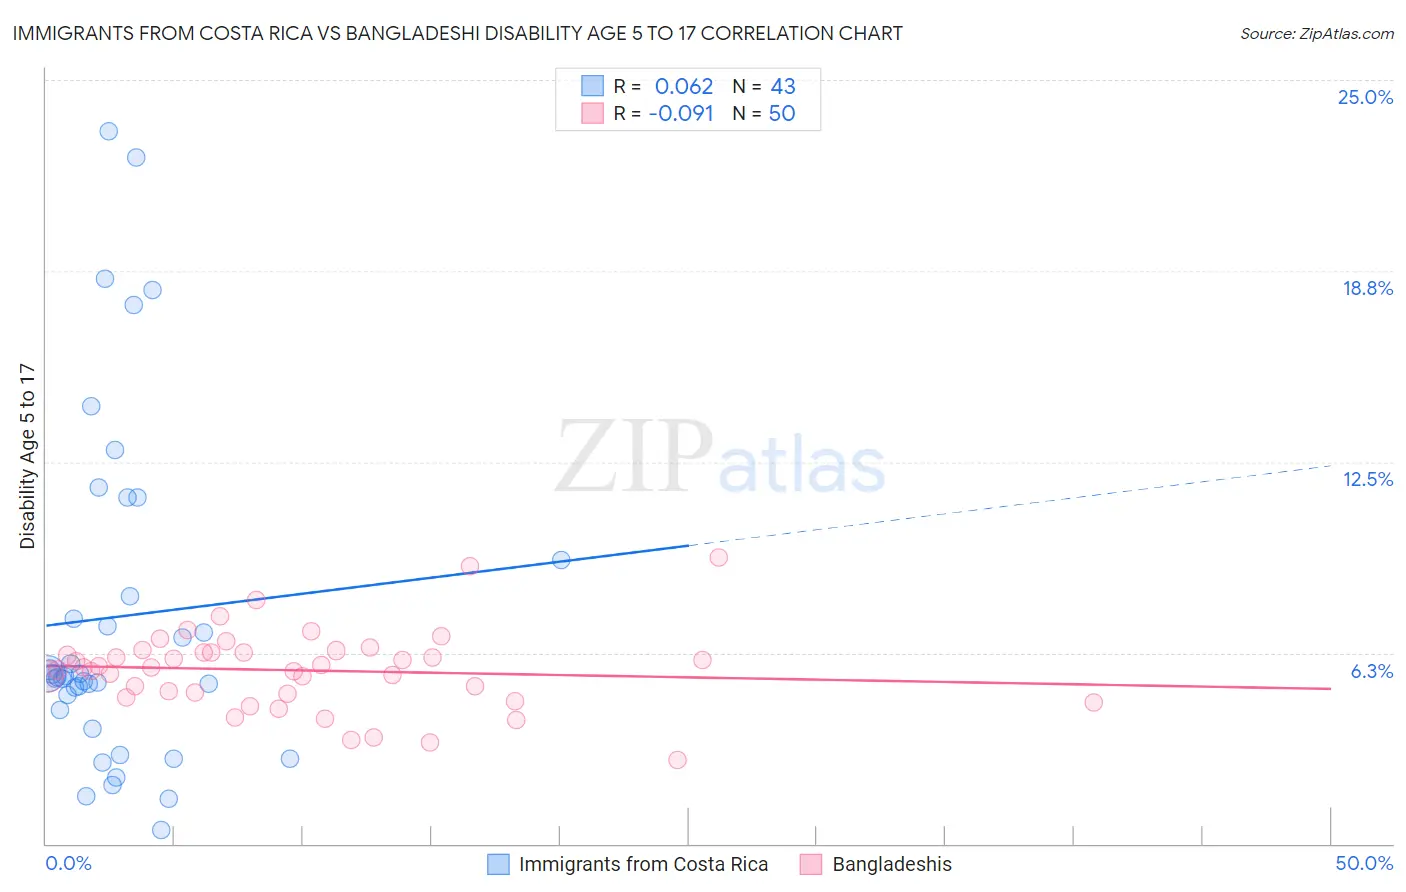
Immigrants from Costa Rica vs Bangladeshi Disability Age 5 to 17 Correlation Chart
The statistical analysis conducted on geographies consisting of 203,667,525 people shows a slight positive correlation between the proportion of Immigrants from Costa Rica and percentage of population with a disability between the ages 5 and 17 in the United States with a correlation coefficient (R) of 0.062 and weighted average of 5.5%. Similarly, the statistical analysis conducted on geographies consisting of 140,952,749 people shows a slight negative correlation between the proportion of Bangladeshis and percentage of population with a disability between the ages 5 and 17 in the United States with a correlation coefficient (R) of -0.091 and weighted average of 5.8%, a difference of 5.3%.
Disability Age 5 to 17 Correlation Summary
| Measurement | Immigrants from Costa Rica | Bangladeshi |
| Minimum | 0.44% | 2.7% |
| Maximum | 23.3% | 9.4% |
| Range | 22.9% | 6.7% |
| Mean | 7.4% | 5.7% |
| Median | 5.5% | 5.8% |
| Interquartile 25% (IQ1) | 4.4% | 4.9% |
| Interquartile 75% (IQ3) | 9.3% | 6.3% |
| Interquartile Range (IQR) | 4.9% | 1.4% |
| Standard Deviation (Sample) | 5.6% | 1.3% |
| Standard Deviation (Population) | 5.5% | 1.3% |
Similar Demographics by Disability Age 5 to 17
Demographics Similar to Immigrants from Costa Rica by Disability Age 5 to 17
In terms of disability age 5 to 17, the demographic groups most similar to Immigrants from Costa Rica are Hawaiian (5.5%, a difference of 0.010%), Immigrants from Ecuador (5.5%, a difference of 0.030%), Immigrants from Nepal (5.5%, a difference of 0.050%), Australian (5.5%, a difference of 0.070%), and Ecuadorian (5.5%, a difference of 0.14%).
| Demographics | Rating | Rank | Disability Age 5 to 17 |
| Guatemalans | 81.5 /100 | #150 | Excellent 5.5% |
| Estonians | 80.8 /100 | #151 | Excellent 5.5% |
| Ute | 80.6 /100 | #152 | Excellent 5.5% |
| Ecuadorians | 79.7 /100 | #153 | Good 5.5% |
| Australians | 78.8 /100 | #154 | Good 5.5% |
| Immigrants | Ecuador | 78.3 /100 | #155 | Good 5.5% |
| Hawaiians | 78.0 /100 | #156 | Good 5.5% |
| Immigrants | Costa Rica | 77.9 /100 | #157 | Good 5.5% |
| Immigrants | Nepal | 77.1 /100 | #158 | Good 5.5% |
| Immigrants | Zimbabwe | 75.3 /100 | #159 | Good 5.5% |
| South Africans | 73.3 /100 | #160 | Good 5.5% |
| Immigrants | Saudi Arabia | 69.1 /100 | #161 | Good 5.5% |
| Zimbabweans | 67.2 /100 | #162 | Good 5.5% |
| Immigrants | Southern Europe | 64.0 /100 | #163 | Good 5.6% |
| Immigrants | Scotland | 61.9 /100 | #164 | Good 5.6% |
Demographics Similar to Bangladeshis by Disability Age 5 to 17
In terms of disability age 5 to 17, the demographic groups most similar to Bangladeshis are Haitian (5.8%, a difference of 0.010%), Ghanaian (5.8%, a difference of 0.010%), European (5.8%, a difference of 0.080%), Swiss (5.8%, a difference of 0.090%), and British West Indian (5.8%, a difference of 0.17%).
| Demographics | Rating | Rank | Disability Age 5 to 17 |
| Immigrants | Sudan | 6.7 /100 | #222 | Tragic 5.8% |
| Alsatians | 6.0 /100 | #223 | Tragic 5.8% |
| Mexicans | 5.7 /100 | #224 | Tragic 5.8% |
| Guamanians/Chamorros | 5.6 /100 | #225 | Tragic 5.8% |
| British West Indians | 5.4 /100 | #226 | Tragic 5.8% |
| Swiss | 5.1 /100 | #227 | Tragic 5.8% |
| Haitians | 4.8 /100 | #228 | Tragic 5.8% |
| Bangladeshis | 4.8 /100 | #229 | Tragic 5.8% |
| Ghanaians | 4.7 /100 | #230 | Tragic 5.8% |
| Europeans | 4.5 /100 | #231 | Tragic 5.8% |
| Immigrants | Laos | 3.8 /100 | #232 | Tragic 5.8% |
| Immigrants | West Indies | 3.5 /100 | #233 | Tragic 5.8% |
| Immigrants | Kenya | 3.4 /100 | #234 | Tragic 5.8% |
| Malaysians | 3.4 /100 | #235 | Tragic 5.8% |
| Immigrants | Brazil | 3.2 /100 | #236 | Tragic 5.8% |