Immigrants from Egypt vs Salvadoran Vision Disability
COMPARE
Immigrants from Egypt
Salvadoran
Vision Disability
Vision Disability Comparison
Immigrants from Egypt
Salvadorans
1.9%
VISION DISABILITY
99.9/ 100
METRIC RATING
33rd/ 347
METRIC RANK
2.2%
VISION DISABILITY
27.4/ 100
METRIC RATING
189th/ 347
METRIC RANK
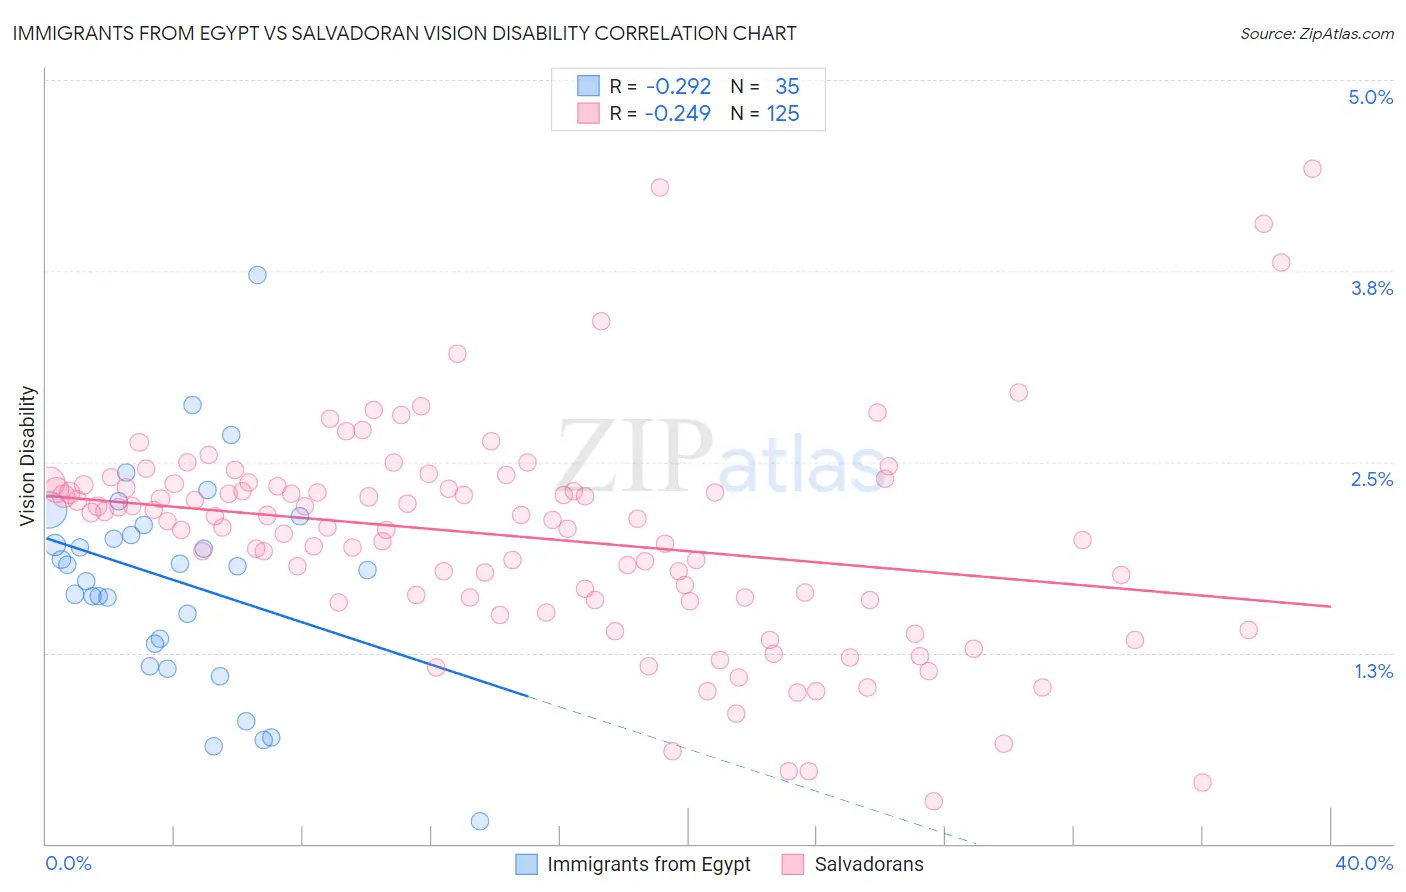
Immigrants from Egypt vs Salvadoran Vision Disability Correlation Chart
The statistical analysis conducted on geographies consisting of 245,409,407 people shows a weak negative correlation between the proportion of Immigrants from Egypt and percentage of population with vision disability in the United States with a correlation coefficient (R) of -0.292 and weighted average of 1.9%. Similarly, the statistical analysis conducted on geographies consisting of 398,695,149 people shows a weak negative correlation between the proportion of Salvadorans and percentage of population with vision disability in the United States with a correlation coefficient (R) of -0.249 and weighted average of 2.2%, a difference of 13.1%.
Vision Disability Correlation Summary
| Measurement | Immigrants from Egypt | Salvadoran |
| Minimum | 0.14% | 0.28% |
| Maximum | 3.7% | 4.4% |
| Range | 3.6% | 4.1% |
| Mean | 1.7% | 2.0% |
| Median | 1.8% | 2.1% |
| Interquartile 25% (IQ1) | 1.3% | 1.6% |
| Interquartile 75% (IQ3) | 2.1% | 2.3% |
| Interquartile Range (IQR) | 0.78% | 0.75% |
| Standard Deviation (Sample) | 0.69% | 0.72% |
| Standard Deviation (Population) | 0.68% | 0.71% |
Similar Demographics by Vision Disability
Demographics Similar to Immigrants from Egypt by Vision Disability
In terms of vision disability, the demographic groups most similar to Immigrants from Egypt are Immigrants from Turkey (1.9%, a difference of 0.13%), Immigrants from Australia (1.9%, a difference of 0.22%), Luxembourger (1.9%, a difference of 0.31%), Cambodian (2.0%, a difference of 0.57%), and Mongolian (1.9%, a difference of 0.58%).
| Demographics | Rating | Rank | Vision Disability |
| Immigrants | Japan | 99.9 /100 | #26 | Exceptional 1.9% |
| Taiwanese | 99.9 /100 | #27 | Exceptional 1.9% |
| Immigrants | Malaysia | 99.9 /100 | #28 | Exceptional 1.9% |
| Egyptians | 99.9 /100 | #29 | Exceptional 1.9% |
| Immigrants | Nepal | 99.9 /100 | #30 | Exceptional 1.9% |
| Mongolians | 99.9 /100 | #31 | Exceptional 1.9% |
| Luxembourgers | 99.9 /100 | #32 | Exceptional 1.9% |
| Immigrants | Egypt | 99.9 /100 | #33 | Exceptional 1.9% |
| Immigrants | Turkey | 99.8 /100 | #34 | Exceptional 1.9% |
| Immigrants | Australia | 99.8 /100 | #35 | Exceptional 1.9% |
| Cambodians | 99.8 /100 | #36 | Exceptional 2.0% |
| Bhutanese | 99.8 /100 | #37 | Exceptional 2.0% |
| Immigrants | Kuwait | 99.8 /100 | #38 | Exceptional 2.0% |
| Zimbabweans | 99.7 /100 | #39 | Exceptional 2.0% |
| Immigrants | Ireland | 99.7 /100 | #40 | Exceptional 2.0% |
Demographics Similar to Salvadorans by Vision Disability
In terms of vision disability, the demographic groups most similar to Salvadorans are Guyanese (2.2%, a difference of 0.11%), Immigrants from Costa Rica (2.2%, a difference of 0.11%), Canadian (2.2%, a difference of 0.13%), European (2.2%, a difference of 0.13%), and British (2.2%, a difference of 0.19%).
| Demographics | Rating | Rank | Vision Disability |
| Costa Ricans | 40.7 /100 | #182 | Average 2.2% |
| Immigrants | Burma/Myanmar | 37.9 /100 | #183 | Fair 2.2% |
| Moroccans | 35.4 /100 | #184 | Fair 2.2% |
| Immigrants | Middle Africa | 33.5 /100 | #185 | Fair 2.2% |
| Native Hawaiians | 33.3 /100 | #186 | Fair 2.2% |
| Immigrants | St. Vincent and the Grenadines | 30.3 /100 | #187 | Fair 2.2% |
| Guyanese | 28.9 /100 | #188 | Fair 2.2% |
| Salvadorans | 27.4 /100 | #189 | Fair 2.2% |
| Immigrants | Costa Rica | 26.1 /100 | #190 | Fair 2.2% |
| Canadians | 25.8 /100 | #191 | Fair 2.2% |
| Europeans | 25.7 /100 | #192 | Fair 2.2% |
| British | 25.1 /100 | #193 | Fair 2.2% |
| Immigrants | Barbados | 24.0 /100 | #194 | Fair 2.2% |
| Immigrants | Immigrants | 23.7 /100 | #195 | Fair 2.2% |
| Immigrants | Grenada | 23.1 /100 | #196 | Fair 2.2% |