Immigrants from Guatemala vs Malaysian Male Disability
COMPARE
Immigrants from Guatemala
Malaysian
Male Disability
Male Disability Comparison
Immigrants from Guatemala
Malaysians
11.0%
MALE DISABILITY
75.1/ 100
METRIC RATING
150th/ 347
METRIC RANK
11.8%
MALE DISABILITY
1.8/ 100
METRIC RATING
232nd/ 347
METRIC RANK
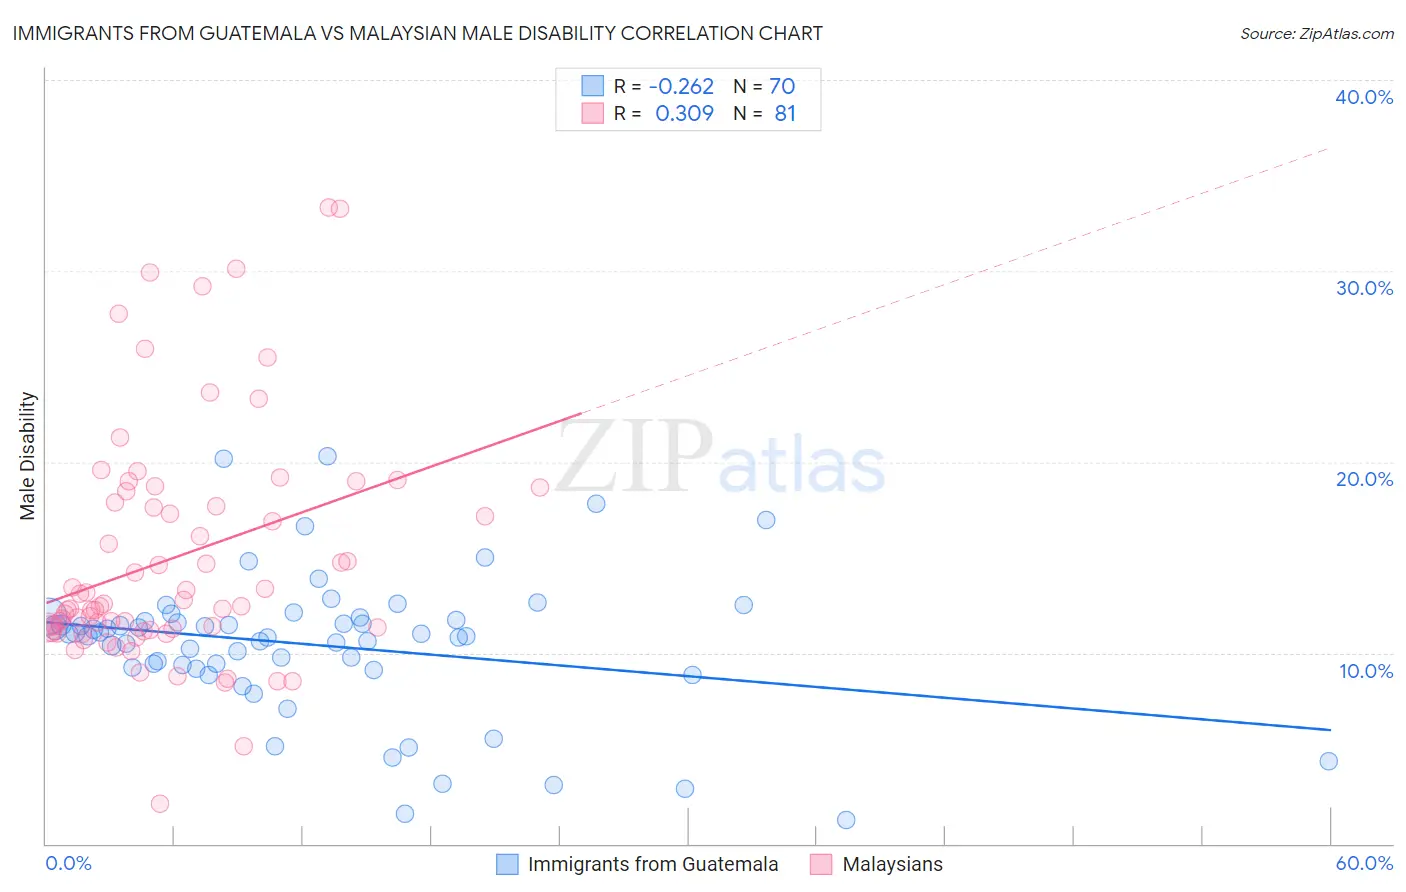
Immigrants from Guatemala vs Malaysian Male Disability Correlation Chart
The statistical analysis conducted on geographies consisting of 377,223,661 people shows a weak negative correlation between the proportion of Immigrants from Guatemala and percentage of males with a disability in the United States with a correlation coefficient (R) of -0.262 and weighted average of 11.0%. Similarly, the statistical analysis conducted on geographies consisting of 226,062,465 people shows a mild positive correlation between the proportion of Malaysians and percentage of males with a disability in the United States with a correlation coefficient (R) of 0.309 and weighted average of 11.8%, a difference of 7.2%.
Male Disability Correlation Summary
| Measurement | Immigrants from Guatemala | Malaysian |
| Minimum | 1.3% | 2.1% |
| Maximum | 20.3% | 33.3% |
| Range | 19.1% | 31.3% |
| Mean | 10.4% | 15.0% |
| Median | 10.9% | 12.5% |
| Interquartile 25% (IQ1) | 9.2% | 11.2% |
| Interquartile 75% (IQ3) | 11.7% | 18.2% |
| Interquartile Range (IQR) | 2.5% | 6.9% |
| Standard Deviation (Sample) | 3.7% | 6.2% |
| Standard Deviation (Population) | 3.7% | 6.1% |
Similar Demographics by Male Disability
Demographics Similar to Immigrants from Guatemala by Male Disability
In terms of male disability, the demographic groups most similar to Immigrants from Guatemala are Cuban (11.0%, a difference of 0.020%), Immigrants from Albania (11.0%, a difference of 0.050%), Immigrants from Denmark (11.0%, a difference of 0.10%), Immigrants from Northern Europe (11.1%, a difference of 0.14%), and Sudanese (11.0%, a difference of 0.15%).
| Demographics | Rating | Rank | Male Disability |
| Moroccans | 80.7 /100 | #143 | Excellent 11.0% |
| Kenyans | 78.1 /100 | #144 | Good 11.0% |
| Costa Ricans | 78.0 /100 | #145 | Good 11.0% |
| Koreans | 77.5 /100 | #146 | Good 11.0% |
| Immigrants | Croatia | 77.3 /100 | #147 | Good 11.0% |
| Sudanese | 77.1 /100 | #148 | Good 11.0% |
| Immigrants | Denmark | 76.4 /100 | #149 | Good 11.0% |
| Immigrants | Guatemala | 75.1 /100 | #150 | Good 11.0% |
| Cubans | 74.9 /100 | #151 | Good 11.0% |
| Immigrants | Albania | 74.4 /100 | #152 | Good 11.0% |
| Immigrants | Northern Europe | 73.2 /100 | #153 | Good 11.1% |
| Immigrants | Moldova | 72.8 /100 | #154 | Good 11.1% |
| Immigrants | Middle Africa | 70.9 /100 | #155 | Good 11.1% |
| Russians | 69.8 /100 | #156 | Good 11.1% |
| Immigrants | Western Africa | 69.2 /100 | #157 | Good 11.1% |
Demographics Similar to Malaysians by Male Disability
In terms of male disability, the demographic groups most similar to Malaysians are Mexican (11.8%, a difference of 0.040%), Dominican (11.8%, a difference of 0.060%), Immigrants from Canada (11.9%, a difference of 0.11%), Immigrants from North America (11.9%, a difference of 0.24%), and Croatian (11.8%, a difference of 0.26%).
| Demographics | Rating | Rank | Male Disability |
| Liberians | 3.1 /100 | #225 | Tragic 11.8% |
| Sub-Saharan Africans | 2.8 /100 | #226 | Tragic 11.8% |
| Austrians | 2.5 /100 | #227 | Tragic 11.8% |
| Hispanics or Latinos | 2.3 /100 | #228 | Tragic 11.8% |
| Bermudans | 2.3 /100 | #229 | Tragic 11.8% |
| Croatians | 2.1 /100 | #230 | Tragic 11.8% |
| Dominicans | 1.8 /100 | #231 | Tragic 11.8% |
| Malaysians | 1.8 /100 | #232 | Tragic 11.8% |
| Mexicans | 1.7 /100 | #233 | Tragic 11.8% |
| Immigrants | Canada | 1.6 /100 | #234 | Tragic 11.9% |
| Immigrants | North America | 1.5 /100 | #235 | Tragic 11.9% |
| U.S. Virgin Islanders | 1.3 /100 | #236 | Tragic 11.9% |
| Carpatho Rusyns | 1.3 /100 | #237 | Tragic 11.9% |
| Yugoslavians | 1.2 /100 | #238 | Tragic 11.9% |
| Italians | 1.2 /100 | #239 | Tragic 11.9% |