Immigrants from Guatemala vs Pima Hearing Disability
COMPARE
Immigrants from Guatemala
Pima
Hearing Disability
Hearing Disability Comparison
Immigrants from Guatemala
Pima
2.8%
HEARING DISABILITY
95.1/ 100
METRIC RATING
99th/ 347
METRIC RANK
3.7%
HEARING DISABILITY
0.0/ 100
METRIC RATING
296th/ 347
METRIC RANK
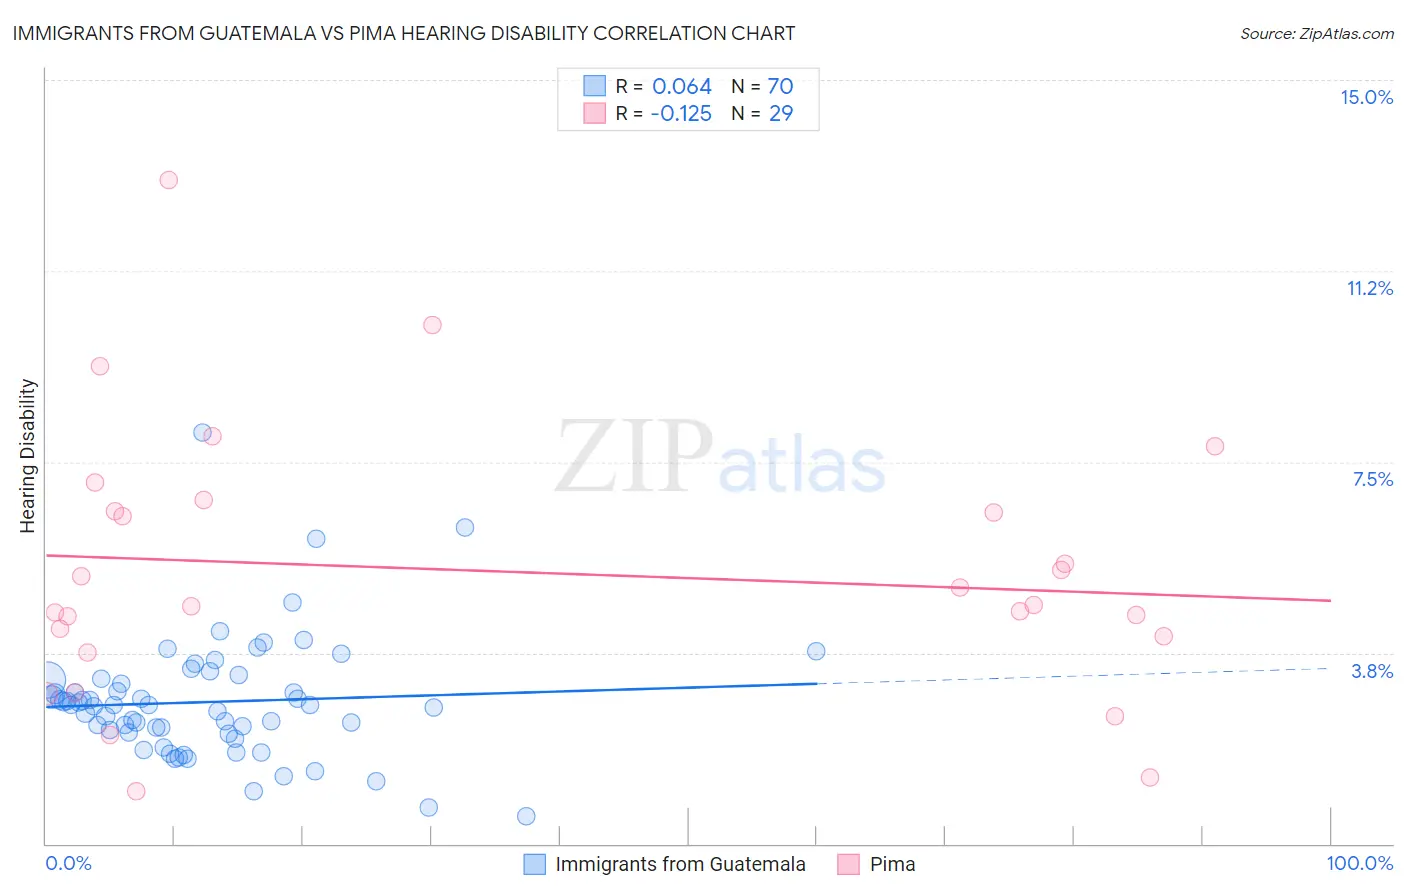
Immigrants from Guatemala vs Pima Hearing Disability Correlation Chart
The statistical analysis conducted on geographies consisting of 377,187,532 people shows a slight positive correlation between the proportion of Immigrants from Guatemala and percentage of population with hearing disability in the United States with a correlation coefficient (R) of 0.064 and weighted average of 2.8%. Similarly, the statistical analysis conducted on geographies consisting of 61,536,530 people shows a poor negative correlation between the proportion of Pima and percentage of population with hearing disability in the United States with a correlation coefficient (R) of -0.125 and weighted average of 3.7%, a difference of 33.2%.
Hearing Disability Correlation Summary
| Measurement | Immigrants from Guatemala | Pima |
| Minimum | 0.55% | 1.0% |
| Maximum | 8.1% | 13.0% |
| Range | 7.5% | 12.0% |
| Mean | 2.8% | 5.4% |
| Median | 2.7% | 4.7% |
| Interquartile 25% (IQ1) | 2.2% | 3.9% |
| Interquartile 75% (IQ3) | 3.2% | 6.6% |
| Interquartile Range (IQR) | 1.0% | 2.7% |
| Standard Deviation (Sample) | 1.2% | 2.6% |
| Standard Deviation (Population) | 1.2% | 2.6% |
Similar Demographics by Hearing Disability
Demographics Similar to Immigrants from Guatemala by Hearing Disability
In terms of hearing disability, the demographic groups most similar to Immigrants from Guatemala are Immigrants from Honduras (2.8%, a difference of 0.040%), Immigrants from Eastern Africa (2.8%, a difference of 0.050%), Immigrants from Afghanistan (2.8%, a difference of 0.10%), Immigrants from Spain (2.8%, a difference of 0.11%), and Taiwanese (2.8%, a difference of 0.12%).
| Demographics | Rating | Rank | Hearing Disability |
| Iranians | 96.4 /100 | #92 | Exceptional 2.8% |
| Immigrants | Kuwait | 96.3 /100 | #93 | Exceptional 2.8% |
| Uruguayans | 95.9 /100 | #94 | Exceptional 2.8% |
| Israelis | 95.9 /100 | #95 | Exceptional 2.8% |
| Immigrants | Somalia | 95.5 /100 | #96 | Exceptional 2.8% |
| Immigrants | Afghanistan | 95.3 /100 | #97 | Exceptional 2.8% |
| Immigrants | Honduras | 95.1 /100 | #98 | Exceptional 2.8% |
| Immigrants | Guatemala | 95.1 /100 | #99 | Exceptional 2.8% |
| Immigrants | Eastern Africa | 95.0 /100 | #100 | Exceptional 2.8% |
| Immigrants | Spain | 94.9 /100 | #101 | Exceptional 2.8% |
| Taiwanese | 94.8 /100 | #102 | Exceptional 2.8% |
| Immigrants | Indonesia | 94.7 /100 | #103 | Exceptional 2.8% |
| Burmese | 94.2 /100 | #104 | Exceptional 2.8% |
| Moroccans | 93.9 /100 | #105 | Exceptional 2.8% |
| Hondurans | 93.4 /100 | #106 | Exceptional 2.8% |
Demographics Similar to Pima by Hearing Disability
In terms of hearing disability, the demographic groups most similar to Pima are Immigrants from the Azores (3.7%, a difference of 0.070%), Welsh (3.7%, a difference of 0.13%), Celtic (3.7%, a difference of 0.26%), Iroquois (3.7%, a difference of 0.39%), and German (3.7%, a difference of 0.54%).
| Demographics | Rating | Rank | Hearing Disability |
| Chinese | 0.0 /100 | #289 | Tragic 3.7% |
| Whites/Caucasians | 0.0 /100 | #290 | Tragic 3.7% |
| Finns | 0.0 /100 | #291 | Tragic 3.7% |
| Native Hawaiians | 0.0 /100 | #292 | Tragic 3.7% |
| Norwegians | 0.0 /100 | #293 | Tragic 3.7% |
| Iroquois | 0.0 /100 | #294 | Tragic 3.7% |
| Welsh | 0.0 /100 | #295 | Tragic 3.7% |
| Pima | 0.0 /100 | #296 | Tragic 3.7% |
| Immigrants | Azores | 0.0 /100 | #297 | Tragic 3.7% |
| Celtics | 0.0 /100 | #298 | Tragic 3.7% |
| Germans | 0.0 /100 | #299 | Tragic 3.7% |
| Scottish | 0.0 /100 | #300 | Tragic 3.7% |
| Pennsylvania Germans | 0.0 /100 | #301 | Tragic 3.7% |
| Dutch | 0.0 /100 | #302 | Tragic 3.7% |
| Menominee | 0.0 /100 | #303 | Tragic 3.7% |