Immigrants from Indonesia vs Basque Disability Age 18 to 34
COMPARE
Immigrants from Indonesia
Basque
Disability Age 18 to 34
Disability Age 18 to 34 Comparison
Immigrants from Indonesia
Basques
5.9%
DISABILITY AGE 18 TO 34
99.7/ 100
METRIC RATING
53rd/ 347
METRIC RANK
7.4%
DISABILITY AGE 18 TO 34
0.1/ 100
METRIC RATING
269th/ 347
METRIC RANK
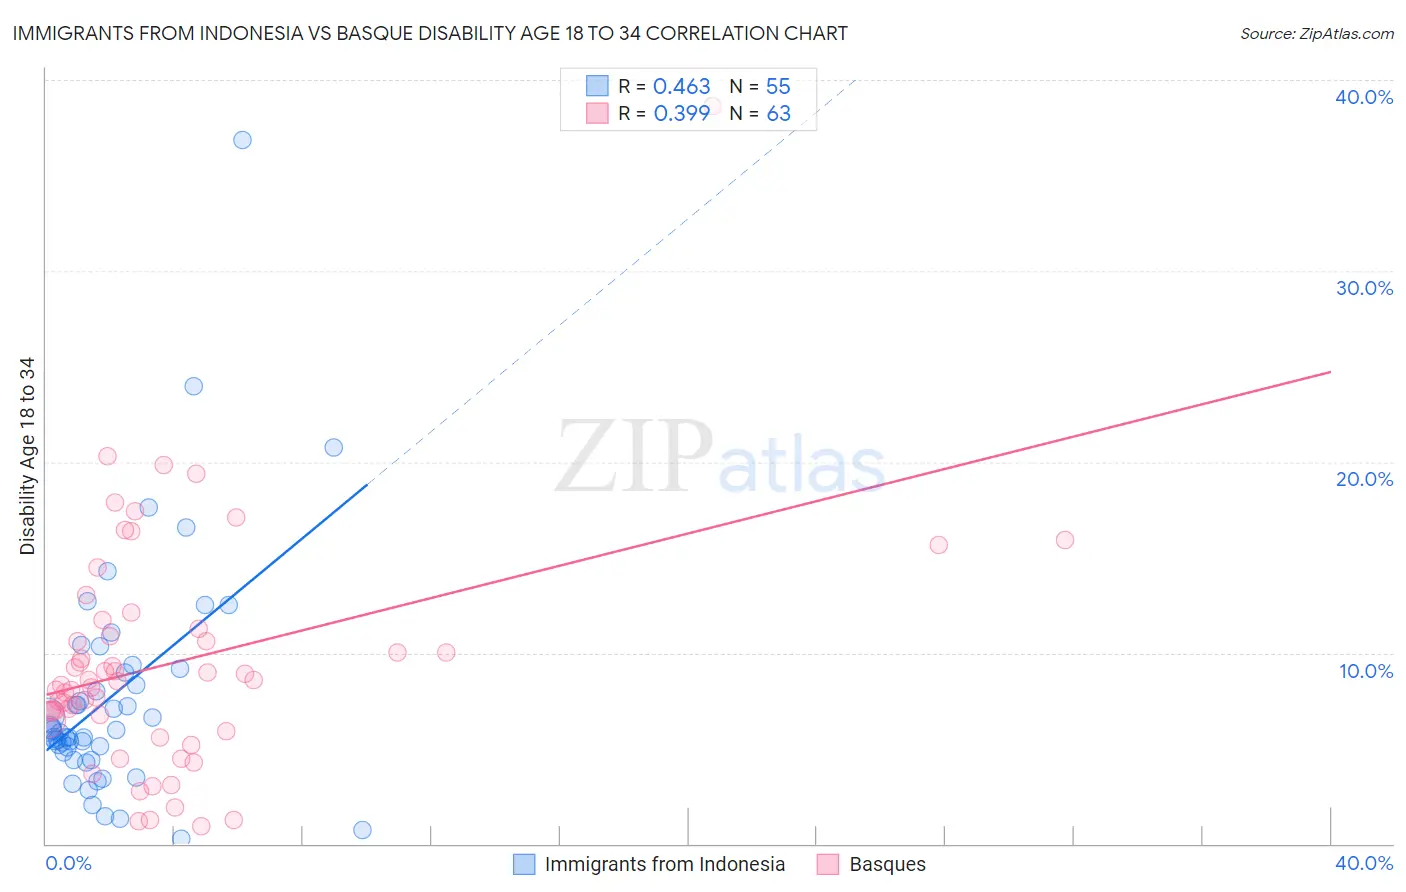
Immigrants from Indonesia vs Basque Disability Age 18 to 34 Correlation Chart
The statistical analysis conducted on geographies consisting of 215,585,234 people shows a moderate positive correlation between the proportion of Immigrants from Indonesia and percentage of population with a disability between the ages 18 and 35 in the United States with a correlation coefficient (R) of 0.463 and weighted average of 5.9%. Similarly, the statistical analysis conducted on geographies consisting of 165,605,006 people shows a mild positive correlation between the proportion of Basques and percentage of population with a disability between the ages 18 and 35 in the United States with a correlation coefficient (R) of 0.399 and weighted average of 7.4%, a difference of 24.4%.
Disability Age 18 to 34 Correlation Summary
| Measurement | Immigrants from Indonesia | Basque |
| Minimum | 0.29% | 0.88% |
| Maximum | 36.9% | 38.6% |
| Range | 36.6% | 37.7% |
| Mean | 7.8% | 9.5% |
| Median | 6.0% | 8.5% |
| Interquartile 25% (IQ1) | 4.8% | 6.5% |
| Interquartile 75% (IQ3) | 9.2% | 11.2% |
| Interquartile Range (IQR) | 4.4% | 4.8% |
| Standard Deviation (Sample) | 6.2% | 6.1% |
| Standard Deviation (Population) | 6.1% | 6.0% |
Similar Demographics by Disability Age 18 to 34
Demographics Similar to Immigrants from Indonesia by Disability Age 18 to 34
In terms of disability age 18 to 34, the demographic groups most similar to Immigrants from Indonesia are Immigrants from Malaysia (5.9%, a difference of 0.050%), Immigrants from Spain (5.9%, a difference of 0.060%), Okinawan (5.9%, a difference of 0.14%), Paraguayan (5.9%, a difference of 0.22%), and Immigrants from El Salvador (5.9%, a difference of 0.28%).
| Demographics | Rating | Rank | Disability Age 18 to 34 |
| Immigrants | Korea | 99.8 /100 | #46 | Exceptional 5.9% |
| Immigrants | Egypt | 99.8 /100 | #47 | Exceptional 5.9% |
| Immigrants | Trinidad and Tobago | 99.8 /100 | #48 | Exceptional 5.9% |
| Immigrants | Belarus | 99.8 /100 | #49 | Exceptional 5.9% |
| Immigrants | El Salvador | 99.8 /100 | #50 | Exceptional 5.9% |
| Egyptians | 99.8 /100 | #51 | Exceptional 5.9% |
| Okinawans | 99.7 /100 | #52 | Exceptional 5.9% |
| Immigrants | Indonesia | 99.7 /100 | #53 | Exceptional 5.9% |
| Immigrants | Malaysia | 99.7 /100 | #54 | Exceptional 5.9% |
| Immigrants | Spain | 99.7 /100 | #55 | Exceptional 5.9% |
| Paraguayans | 99.7 /100 | #56 | Exceptional 5.9% |
| Immigrants | Haiti | 99.7 /100 | #57 | Exceptional 5.9% |
| Immigrants | Serbia | 99.7 /100 | #58 | Exceptional 5.9% |
| Immigrants | Caribbean | 99.6 /100 | #59 | Exceptional 6.0% |
| Immigrants | Sri Lanka | 99.6 /100 | #60 | Exceptional 6.0% |
Demographics Similar to Basques by Disability Age 18 to 34
In terms of disability age 18 to 34, the demographic groups most similar to Basques are Portuguese (7.4%, a difference of 0.040%), Belgian (7.4%, a difference of 0.090%), Bangladeshi (7.4%, a difference of 0.11%), Swiss (7.4%, a difference of 0.14%), and German Russian (7.4%, a difference of 0.18%).
| Demographics | Rating | Rank | Disability Age 18 to 34 |
| Canadians | 0.2 /100 | #262 | Tragic 7.3% |
| British | 0.2 /100 | #263 | Tragic 7.3% |
| Bermudans | 0.1 /100 | #264 | Tragic 7.3% |
| Slovenes | 0.1 /100 | #265 | Tragic 7.3% |
| German Russians | 0.1 /100 | #266 | Tragic 7.4% |
| Bangladeshis | 0.1 /100 | #267 | Tragic 7.4% |
| Portuguese | 0.1 /100 | #268 | Tragic 7.4% |
| Basques | 0.1 /100 | #269 | Tragic 7.4% |
| Belgians | 0.1 /100 | #270 | Tragic 7.4% |
| Swiss | 0.1 /100 | #271 | Tragic 7.4% |
| Tsimshian | 0.1 /100 | #272 | Tragic 7.4% |
| Slavs | 0.1 /100 | #273 | Tragic 7.4% |
| Africans | 0.1 /100 | #274 | Tragic 7.4% |
| Immigrants | Somalia | 0.1 /100 | #275 | Tragic 7.4% |
| Europeans | 0.1 /100 | #276 | Tragic 7.4% |