Immigrants from Japan vs Seminole Ambulatory Disability
COMPARE
Immigrants from Japan
Seminole
Ambulatory Disability
Ambulatory Disability Comparison
Immigrants from Japan
Seminole
5.6%
AMBULATORY DISABILITY
99.9/ 100
METRIC RATING
47th/ 347
METRIC RANK
8.0%
AMBULATORY DISABILITY
0.0/ 100
METRIC RATING
336th/ 347
METRIC RANK
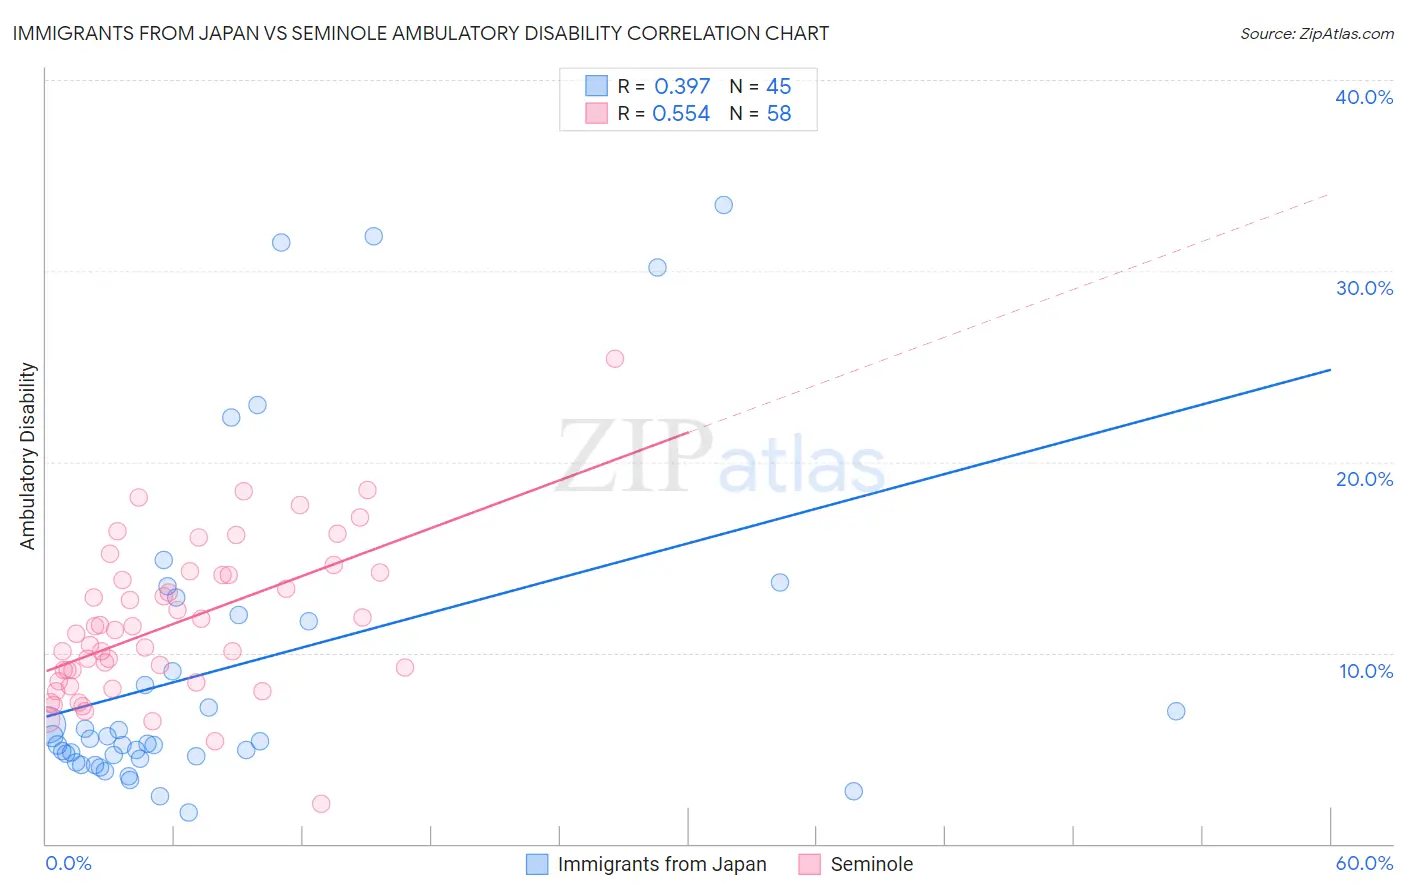
Immigrants from Japan vs Seminole Ambulatory Disability Correlation Chart
The statistical analysis conducted on geographies consisting of 340,080,063 people shows a mild positive correlation between the proportion of Immigrants from Japan and percentage of population with ambulatory disability in the United States with a correlation coefficient (R) of 0.397 and weighted average of 5.6%. Similarly, the statistical analysis conducted on geographies consisting of 118,301,825 people shows a substantial positive correlation between the proportion of Seminole and percentage of population with ambulatory disability in the United States with a correlation coefficient (R) of 0.554 and weighted average of 8.0%, a difference of 44.7%.
Ambulatory Disability Correlation Summary
| Measurement | Immigrants from Japan | Seminole |
| Minimum | 1.7% | 2.1% |
| Maximum | 33.4% | 25.4% |
| Range | 31.8% | 23.3% |
| Mean | 9.2% | 11.5% |
| Median | 5.4% | 11.1% |
| Interquartile 25% (IQ1) | 4.5% | 8.5% |
| Interquartile 75% (IQ3) | 11.8% | 14.1% |
| Interquartile Range (IQR) | 7.3% | 5.5% |
| Standard Deviation (Sample) | 8.5% | 4.1% |
| Standard Deviation (Population) | 8.4% | 4.0% |
Similar Demographics by Ambulatory Disability
Demographics Similar to Immigrants from Japan by Ambulatory Disability
In terms of ambulatory disability, the demographic groups most similar to Immigrants from Japan are Egyptian (5.6%, a difference of 0.0%), Immigrants from Sweden (5.6%, a difference of 0.010%), Immigrants from Argentina (5.6%, a difference of 0.010%), Immigrants from Indonesia (5.5%, a difference of 0.18%), and Bulgarian (5.6%, a difference of 0.21%).
| Demographics | Rating | Rank | Ambulatory Disability |
| Venezuelans | 99.9 /100 | #40 | Exceptional 5.5% |
| Mongolians | 99.9 /100 | #41 | Exceptional 5.5% |
| Argentineans | 99.9 /100 | #42 | Exceptional 5.5% |
| Paraguayans | 99.9 /100 | #43 | Exceptional 5.5% |
| Immigrants | Indonesia | 99.9 /100 | #44 | Exceptional 5.5% |
| Immigrants | Sweden | 99.9 /100 | #45 | Exceptional 5.6% |
| Egyptians | 99.9 /100 | #46 | Exceptional 5.6% |
| Immigrants | Japan | 99.9 /100 | #47 | Exceptional 5.6% |
| Immigrants | Argentina | 99.9 /100 | #48 | Exceptional 5.6% |
| Bulgarians | 99.9 /100 | #49 | Exceptional 5.6% |
| Luxembourgers | 99.9 /100 | #50 | Exceptional 5.6% |
| Taiwanese | 99.8 /100 | #51 | Exceptional 5.6% |
| Jordanians | 99.8 /100 | #52 | Exceptional 5.6% |
| Immigrants | Egypt | 99.8 /100 | #53 | Exceptional 5.6% |
| Immigrants | Eastern Africa | 99.8 /100 | #54 | Exceptional 5.6% |
Demographics Similar to Seminole by Ambulatory Disability
In terms of ambulatory disability, the demographic groups most similar to Seminole are Chickasaw (8.0%, a difference of 0.070%), Yuman (7.9%, a difference of 1.2%), Dutch West Indian (8.2%, a difference of 1.6%), Cherokee (7.9%, a difference of 2.1%), and Colville (8.2%, a difference of 2.2%).
| Demographics | Rating | Rank | Ambulatory Disability |
| Pueblo | 0.0 /100 | #329 | Tragic 7.6% |
| Paiute | 0.0 /100 | #330 | Tragic 7.7% |
| Cajuns | 0.0 /100 | #331 | Tragic 7.8% |
| Menominee | 0.0 /100 | #332 | Tragic 7.8% |
| Cherokee | 0.0 /100 | #333 | Tragic 7.9% |
| Yuman | 0.0 /100 | #334 | Tragic 7.9% |
| Chickasaw | 0.0 /100 | #335 | Tragic 8.0% |
| Seminole | 0.0 /100 | #336 | Tragic 8.0% |
| Dutch West Indians | 0.0 /100 | #337 | Tragic 8.2% |
| Colville | 0.0 /100 | #338 | Tragic 8.2% |
| Pima | 0.0 /100 | #339 | Tragic 8.2% |
| Choctaw | 0.0 /100 | #340 | Tragic 8.3% |
| Creek | 0.0 /100 | #341 | Tragic 8.5% |
| Kiowa | 0.0 /100 | #342 | Tragic 8.6% |
| Tohono O'odham | 0.0 /100 | #343 | Tragic 8.7% |