Immigrants from Kazakhstan vs Immigrants from Dominica Female Disability
COMPARE
Immigrants from Kazakhstan
Immigrants from Dominica
Female Disability
Female Disability Comparison
Immigrants from Kazakhstan
Immigrants from Dominica
11.8%
FEMALE DISABILITY
97.0/ 100
METRIC RATING
120th/ 347
METRIC RANK
13.0%
FEMALE DISABILITY
0.1/ 100
METRIC RATING
276th/ 347
METRIC RANK
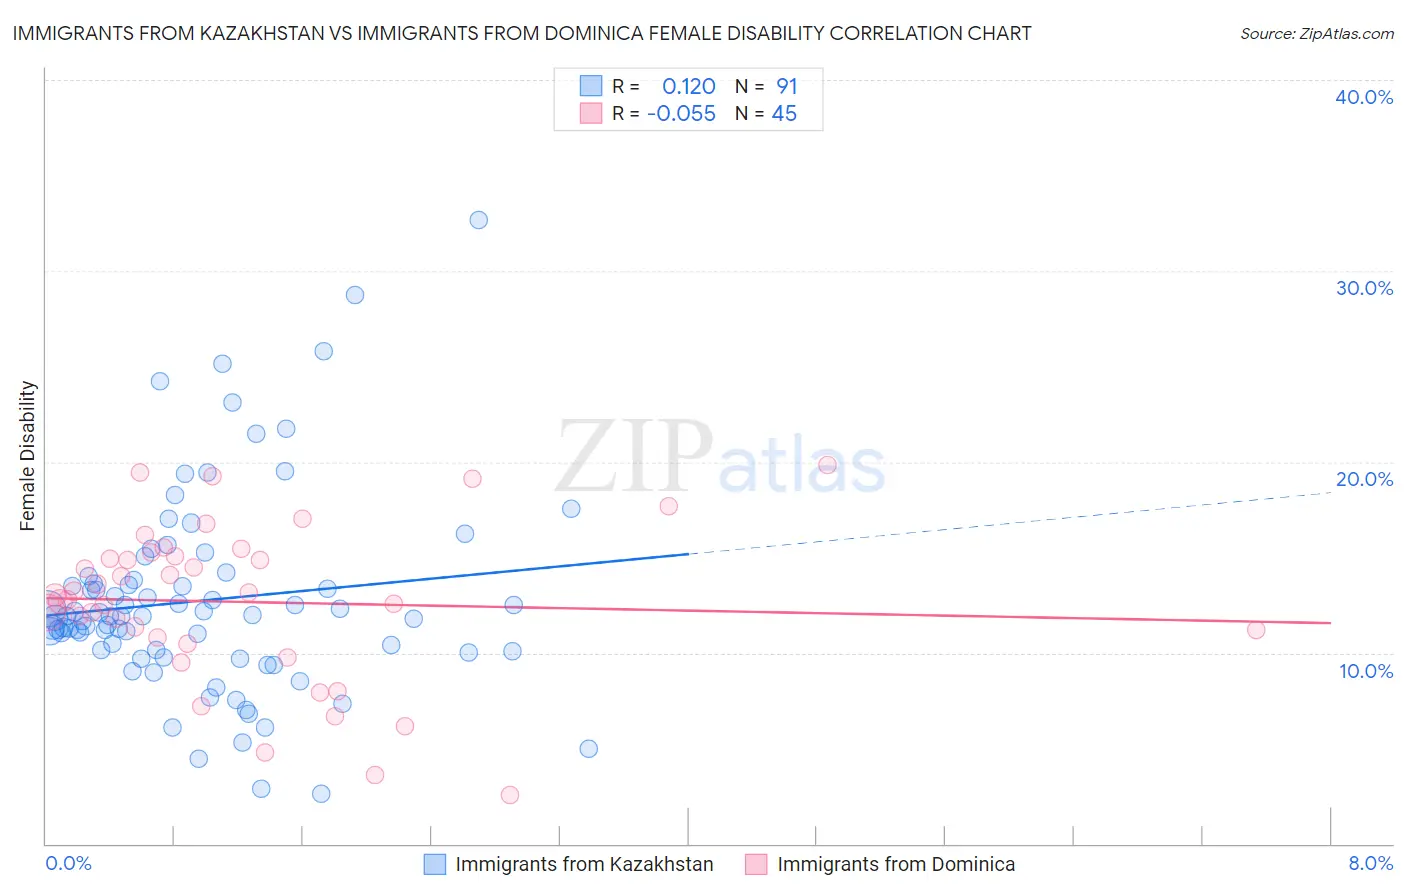
Immigrants from Kazakhstan vs Immigrants from Dominica Female Disability Correlation Chart
The statistical analysis conducted on geographies consisting of 124,443,706 people shows a poor positive correlation between the proportion of Immigrants from Kazakhstan and percentage of females with a disability in the United States with a correlation coefficient (R) of 0.120 and weighted average of 11.8%. Similarly, the statistical analysis conducted on geographies consisting of 83,793,109 people shows a slight negative correlation between the proportion of Immigrants from Dominica and percentage of females with a disability in the United States with a correlation coefficient (R) of -0.055 and weighted average of 13.0%, a difference of 10.0%.
Female Disability Correlation Summary
| Measurement | Immigrants from Kazakhstan | Immigrants from Dominica |
| Minimum | 2.6% | 2.5% |
| Maximum | 32.7% | 19.9% |
| Range | 30.1% | 17.3% |
| Mean | 12.7% | 12.7% |
| Median | 11.9% | 13.0% |
| Interquartile 25% (IQ1) | 10.1% | 10.6% |
| Interquartile 75% (IQ3) | 13.8% | 15.2% |
| Interquartile Range (IQR) | 3.8% | 4.5% |
| Standard Deviation (Sample) | 5.2% | 4.1% |
| Standard Deviation (Population) | 5.2% | 4.1% |
Similar Demographics by Female Disability
Demographics Similar to Immigrants from Kazakhstan by Female Disability
In terms of female disability, the demographic groups most similar to Immigrants from Kazakhstan are Immigrants from Netherlands (11.8%, a difference of 0.030%), Immigrants from North Macedonia (11.8%, a difference of 0.040%), Immigrants from Uganda (11.8%, a difference of 0.080%), Immigrants from Eastern Europe (11.8%, a difference of 0.090%), and Immigrants from Nigeria (11.8%, a difference of 0.090%).
| Demographics | Rating | Rank | Female Disability |
| Immigrants | Belarus | 97.8 /100 | #113 | Exceptional 11.8% |
| South Africans | 97.7 /100 | #114 | Exceptional 11.8% |
| Brazilians | 97.7 /100 | #115 | Exceptional 11.8% |
| Immigrants | Morocco | 97.6 /100 | #116 | Exceptional 11.8% |
| Immigrants | Eastern Europe | 97.2 /100 | #117 | Exceptional 11.8% |
| Immigrants | Nigeria | 97.2 /100 | #118 | Exceptional 11.8% |
| Immigrants | Uganda | 97.2 /100 | #119 | Exceptional 11.8% |
| Immigrants | Kazakhstan | 97.0 /100 | #120 | Exceptional 11.8% |
| Immigrants | Netherlands | 96.9 /100 | #121 | Exceptional 11.8% |
| Immigrants | North Macedonia | 96.8 /100 | #122 | Exceptional 11.8% |
| Immigrants | Croatia | 96.7 /100 | #123 | Exceptional 11.8% |
| Russians | 96.5 /100 | #124 | Exceptional 11.8% |
| Immigrants | Italy | 96.4 /100 | #125 | Exceptional 11.8% |
| Immigrants | Europe | 96.2 /100 | #126 | Exceptional 11.8% |
| South American Indians | 95.8 /100 | #127 | Exceptional 11.8% |
Demographics Similar to Immigrants from Dominica by Female Disability
In terms of female disability, the demographic groups most similar to Immigrants from Dominica are Cheyenne (13.0%, a difference of 0.050%), Portuguese (13.0%, a difference of 0.10%), Spanish (13.0%, a difference of 0.20%), Sioux (12.9%, a difference of 0.22%), and German (12.9%, a difference of 0.24%).
| Demographics | Rating | Rank | Female Disability |
| Indonesians | 0.4 /100 | #269 | Tragic 12.8% |
| Immigrants | Liberia | 0.3 /100 | #270 | Tragic 12.9% |
| Dutch | 0.2 /100 | #271 | Tragic 12.9% |
| Germans | 0.1 /100 | #272 | Tragic 12.9% |
| Sioux | 0.1 /100 | #273 | Tragic 12.9% |
| Portuguese | 0.1 /100 | #274 | Tragic 13.0% |
| Cheyenne | 0.1 /100 | #275 | Tragic 13.0% |
| Immigrants | Dominica | 0.1 /100 | #276 | Tragic 13.0% |
| Spanish | 0.1 /100 | #277 | Tragic 13.0% |
| Scottish | 0.1 /100 | #278 | Tragic 13.0% |
| Arapaho | 0.1 /100 | #279 | Tragic 13.0% |
| Irish | 0.1 /100 | #280 | Tragic 13.1% |
| U.S. Virgin Islanders | 0.1 /100 | #281 | Tragic 13.1% |
| Welsh | 0.0 /100 | #282 | Tragic 13.1% |
| English | 0.0 /100 | #283 | Tragic 13.1% |