Immigrants from Netherlands vs Salvadoran Male Disability
COMPARE
Immigrants from Netherlands
Salvadoran
Male Disability
Male Disability Comparison
Immigrants from Netherlands
Salvadorans
11.4%
MALE DISABILITY
25.9/ 100
METRIC RATING
189th/ 347
METRIC RANK
10.4%
MALE DISABILITY
99.6/ 100
METRIC RATING
51st/ 347
METRIC RANK
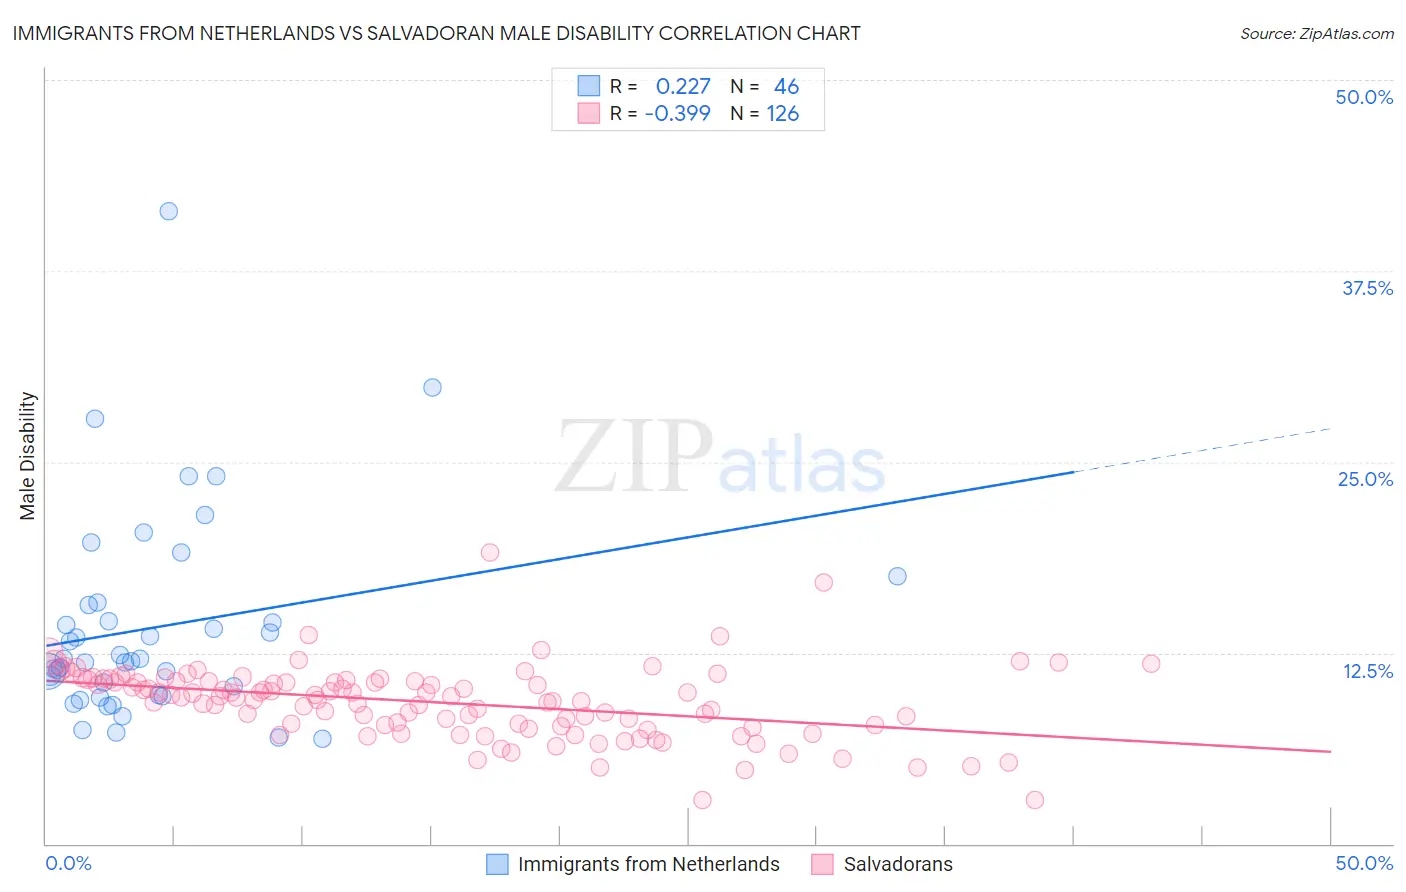
Immigrants from Netherlands vs Salvadoran Male Disability Correlation Chart
The statistical analysis conducted on geographies consisting of 237,879,390 people shows a weak positive correlation between the proportion of Immigrants from Netherlands and percentage of males with a disability in the United States with a correlation coefficient (R) of 0.227 and weighted average of 11.4%. Similarly, the statistical analysis conducted on geographies consisting of 398,921,058 people shows a mild negative correlation between the proportion of Salvadorans and percentage of males with a disability in the United States with a correlation coefficient (R) of -0.399 and weighted average of 10.4%, a difference of 9.8%.
Male Disability Correlation Summary
| Measurement | Immigrants from Netherlands | Salvadoran |
| Minimum | 6.9% | 2.9% |
| Maximum | 41.4% | 19.1% |
| Range | 34.5% | 16.2% |
| Mean | 14.2% | 9.3% |
| Median | 12.0% | 9.6% |
| Interquartile 25% (IQ1) | 9.8% | 7.7% |
| Interquartile 75% (IQ3) | 15.6% | 10.6% |
| Interquartile Range (IQR) | 5.8% | 2.9% |
| Standard Deviation (Sample) | 6.7% | 2.4% |
| Standard Deviation (Population) | 6.6% | 2.3% |
Similar Demographics by Male Disability
Demographics Similar to Immigrants from Netherlands by Male Disability
In terms of male disability, the demographic groups most similar to Immigrants from Netherlands are Immigrants from Bosnia and Herzegovina (11.4%, a difference of 0.040%), Estonian (11.4%, a difference of 0.060%), Immigrants from Austria (11.4%, a difference of 0.10%), Immigrants from Zaire (11.4%, a difference of 0.12%), and Senegalese (11.4%, a difference of 0.20%).
| Demographics | Rating | Rank | Male Disability |
| Immigrants | Belize | 33.7 /100 | #182 | Fair 11.3% |
| Immigrants | Central America | 32.9 /100 | #183 | Fair 11.3% |
| Iraqis | 30.5 /100 | #184 | Fair 11.3% |
| Pakistanis | 30.3 /100 | #185 | Fair 11.3% |
| Immigrants | Zaire | 27.6 /100 | #186 | Fair 11.4% |
| Immigrants | Austria | 27.3 /100 | #187 | Fair 11.4% |
| Estonians | 26.8 /100 | #188 | Fair 11.4% |
| Immigrants | Netherlands | 25.9 /100 | #189 | Fair 11.4% |
| Immigrants | Bosnia and Herzegovina | 25.4 /100 | #190 | Fair 11.4% |
| Senegalese | 23.2 /100 | #191 | Fair 11.4% |
| Assyrians/Chaldeans/Syriacs | 23.2 /100 | #192 | Fair 11.4% |
| Greeks | 22.2 /100 | #193 | Fair 11.4% |
| Belizeans | 21.2 /100 | #194 | Fair 11.4% |
| Immigrants | Oceania | 20.9 /100 | #195 | Fair 11.4% |
| West Indians | 18.4 /100 | #196 | Poor 11.4% |
Demographics Similar to Salvadorans by Male Disability
In terms of male disability, the demographic groups most similar to Salvadorans are Immigrants from Saudi Arabia (10.4%, a difference of 0.020%), Immigrants from Uzbekistan (10.4%, a difference of 0.040%), Peruvian (10.4%, a difference of 0.080%), Immigrants from Eritrea (10.4%, a difference of 0.10%), and Tongan (10.4%, a difference of 0.14%).
| Demographics | Rating | Rank | Male Disability |
| Immigrants | El Salvador | 99.7 /100 | #44 | Exceptional 10.3% |
| Turks | 99.7 /100 | #45 | Exceptional 10.3% |
| Cambodians | 99.7 /100 | #46 | Exceptional 10.3% |
| Immigrants | Peru | 99.7 /100 | #47 | Exceptional 10.3% |
| Israelis | 99.7 /100 | #48 | Exceptional 10.3% |
| Immigrants | Spain | 99.7 /100 | #49 | Exceptional 10.3% |
| South Americans | 99.6 /100 | #50 | Exceptional 10.3% |
| Salvadorans | 99.6 /100 | #51 | Exceptional 10.4% |
| Immigrants | Saudi Arabia | 99.6 /100 | #52 | Exceptional 10.4% |
| Immigrants | Uzbekistan | 99.6 /100 | #53 | Exceptional 10.4% |
| Peruvians | 99.6 /100 | #54 | Exceptional 10.4% |
| Immigrants | Eritrea | 99.6 /100 | #55 | Exceptional 10.4% |
| Tongans | 99.6 /100 | #56 | Exceptional 10.4% |
| Immigrants | South America | 99.6 /100 | #57 | Exceptional 10.4% |
| Immigrants | Japan | 99.5 /100 | #58 | Exceptional 10.4% |