Immigrants from Portugal vs Japanese Disability Age Over 75
COMPARE
Immigrants from Portugal
Japanese
Disability Age Over 75
Disability Age Over 75 Comparison
Immigrants from Portugal
Japanese
47.6%
DISABILITY AGE OVER 75
23.8/ 100
METRIC RATING
196th/ 347
METRIC RANK
50.2%
DISABILITY AGE OVER 75
0.0/ 100
METRIC RATING
303rd/ 347
METRIC RANK
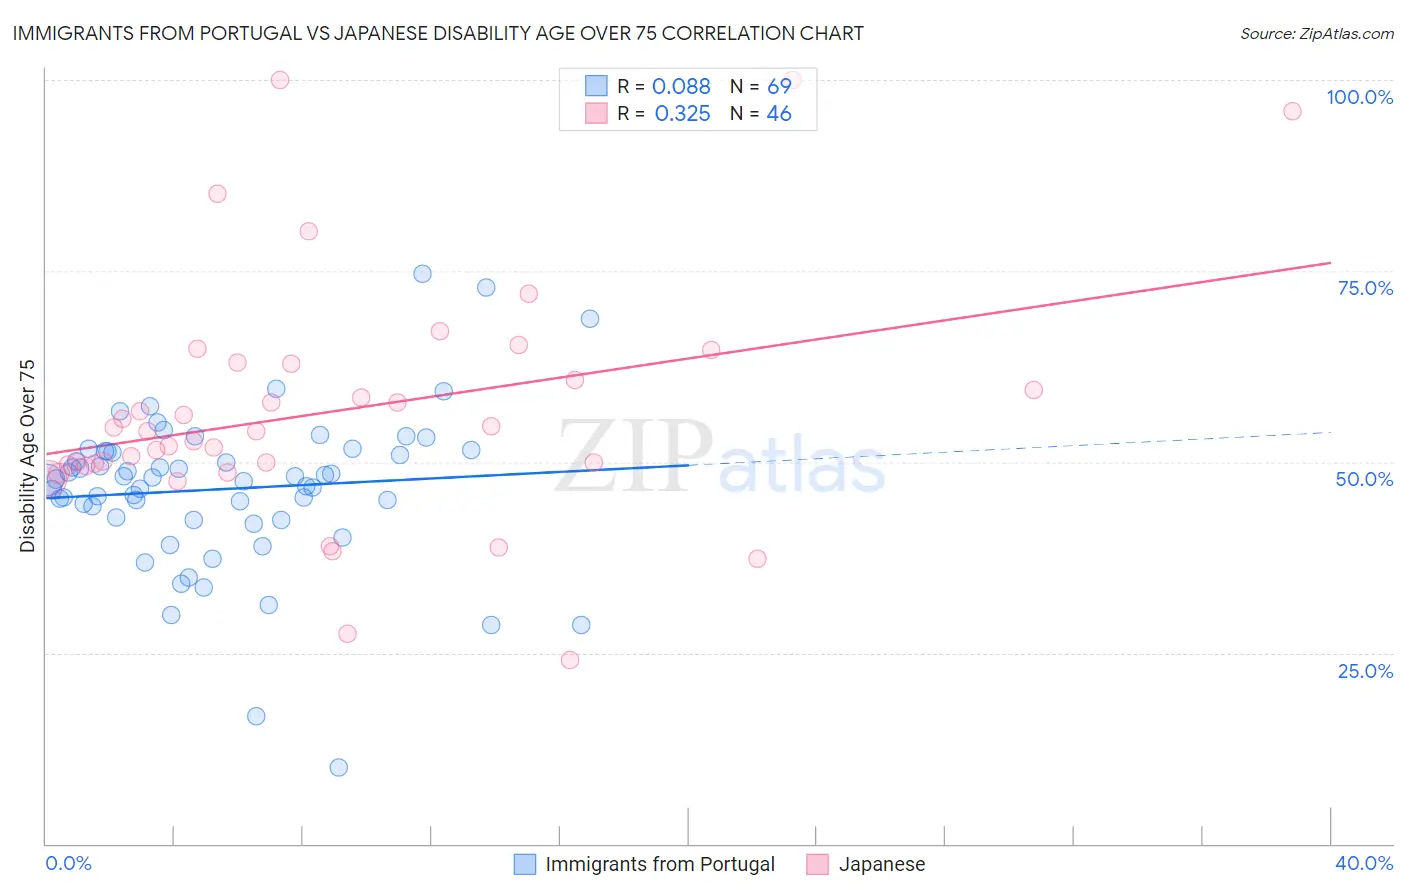
Immigrants from Portugal vs Japanese Disability Age Over 75 Correlation Chart
The statistical analysis conducted on geographies consisting of 174,707,158 people shows a slight positive correlation between the proportion of Immigrants from Portugal and percentage of population with a disability over the age of 75 in the United States with a correlation coefficient (R) of 0.088 and weighted average of 47.6%. Similarly, the statistical analysis conducted on geographies consisting of 248,861,887 people shows a mild positive correlation between the proportion of Japanese and percentage of population with a disability over the age of 75 in the United States with a correlation coefficient (R) of 0.325 and weighted average of 50.2%, a difference of 5.4%.
Disability Age Over 75 Correlation Summary
| Measurement | Immigrants from Portugal | Japanese |
| Minimum | 10.0% | 24.0% |
| Maximum | 74.7% | 100.0% |
| Range | 64.7% | 76.0% |
| Mean | 46.5% | 56.6% |
| Median | 47.7% | 54.0% |
| Interquartile 25% (IQ1) | 42.6% | 49.6% |
| Interquartile 75% (IQ3) | 51.4% | 62.8% |
| Interquartile Range (IQR) | 8.8% | 13.3% |
| Standard Deviation (Sample) | 10.4% | 15.9% |
| Standard Deviation (Population) | 10.3% | 15.7% |
Similar Demographics by Disability Age Over 75
Demographics Similar to Immigrants from Portugal by Disability Age Over 75
In terms of disability age over 75, the demographic groups most similar to Immigrants from Portugal are Pakistani (47.7%, a difference of 0.010%), Immigrants from Ukraine (47.7%, a difference of 0.020%), Immigrants from Eritrea (47.7%, a difference of 0.040%), Immigrants from Trinidad and Tobago (47.6%, a difference of 0.050%), and Immigrants from Lebanon (47.6%, a difference of 0.080%).
| Demographics | Rating | Rank | Disability Age Over 75 |
| Immigrants | Kenya | 30.8 /100 | #189 | Fair 47.6% |
| Somalis | 29.5 /100 | #190 | Fair 47.6% |
| Portuguese | 29.3 /100 | #191 | Fair 47.6% |
| Immigrants | Jamaica | 28.3 /100 | #192 | Fair 47.6% |
| Ottawa | 28.1 /100 | #193 | Fair 47.6% |
| Immigrants | Lebanon | 26.5 /100 | #194 | Fair 47.6% |
| Immigrants | Trinidad and Tobago | 25.3 /100 | #195 | Fair 47.6% |
| Immigrants | Portugal | 23.8 /100 | #196 | Fair 47.6% |
| Pakistanis | 23.4 /100 | #197 | Fair 47.7% |
| Immigrants | Ukraine | 23.2 /100 | #198 | Fair 47.7% |
| Immigrants | Eritrea | 22.4 /100 | #199 | Fair 47.7% |
| Immigrants | Somalia | 21.4 /100 | #200 | Fair 47.7% |
| Immigrants | Cuba | 20.9 /100 | #201 | Fair 47.7% |
| Immigrants | Bahamas | 20.7 /100 | #202 | Fair 47.7% |
| Trinidadians and Tobagonians | 20.0 /100 | #203 | Fair 47.7% |
Demographics Similar to Japanese by Disability Age Over 75
In terms of disability age over 75, the demographic groups most similar to Japanese are Cherokee (50.2%, a difference of 0.010%), Immigrants from Dominican Republic (50.3%, a difference of 0.11%), Dominican (50.2%, a difference of 0.17%), Cape Verdean (50.1%, a difference of 0.23%), and Immigrants from Micronesia (50.1%, a difference of 0.26%).
| Demographics | Rating | Rank | Disability Age Over 75 |
| Mexican American Indians | 0.0 /100 | #296 | Tragic 50.0% |
| Armenians | 0.0 /100 | #297 | Tragic 50.0% |
| Marshallese | 0.0 /100 | #298 | Tragic 50.1% |
| Immigrants | Micronesia | 0.0 /100 | #299 | Tragic 50.1% |
| Cape Verdeans | 0.0 /100 | #300 | Tragic 50.1% |
| Dominicans | 0.0 /100 | #301 | Tragic 50.2% |
| Cherokee | 0.0 /100 | #302 | Tragic 50.2% |
| Japanese | 0.0 /100 | #303 | Tragic 50.2% |
| Immigrants | Dominican Republic | 0.0 /100 | #304 | Tragic 50.3% |
| Central American Indians | 0.0 /100 | #305 | Tragic 50.5% |
| Immigrants | Central America | 0.0 /100 | #306 | Tragic 50.5% |
| Immigrants | Fiji | 0.0 /100 | #307 | Tragic 50.6% |
| Hispanics or Latinos | 0.0 /100 | #308 | Tragic 50.6% |
| Aleuts | 0.0 /100 | #309 | Tragic 50.6% |
| Tlingit-Haida | 0.0 /100 | #310 | Tragic 50.6% |