Immigrants from Scotland vs Pima Disability Age Under 5
COMPARE
Immigrants from Scotland
Pima
Disability Age Under 5
Disability Age Under 5 Comparison
Immigrants from Scotland
Pima
1.4%
DISABILITY AGE UNDER 5
0.9/ 100
METRIC RATING
252nd/ 347
METRIC RANK
1.1%
DISABILITY AGE UNDER 5
99.8/ 100
METRIC RATING
43rd/ 347
METRIC RANK
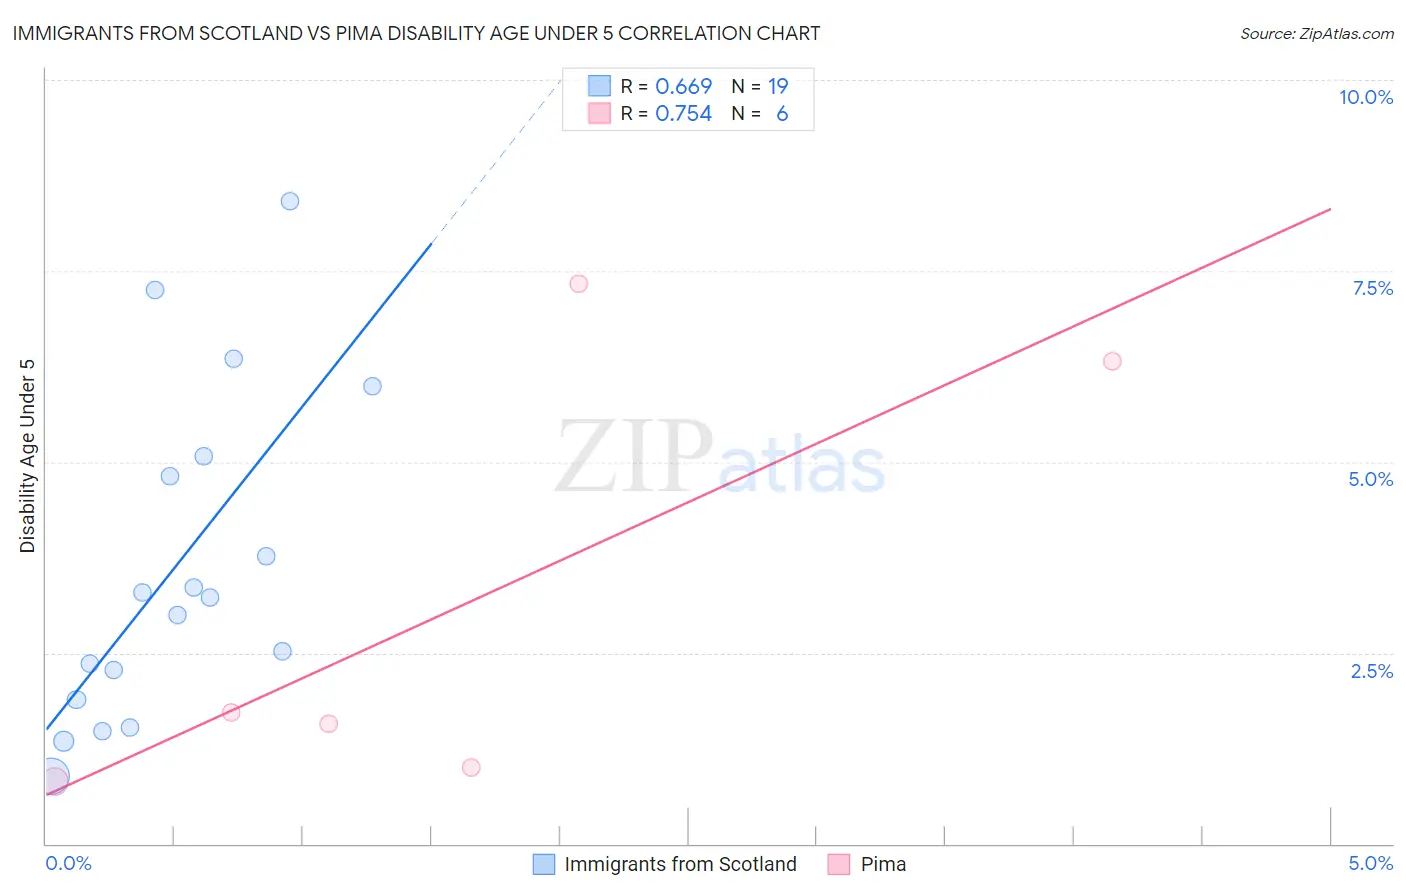
Immigrants from Scotland vs Pima Disability Age Under 5 Correlation Chart
The statistical analysis conducted on geographies consisting of 125,019,989 people shows a significant positive correlation between the proportion of Immigrants from Scotland and percentage of population with a disability under the age of 5 in the United States with a correlation coefficient (R) of 0.669 and weighted average of 1.4%. Similarly, the statistical analysis conducted on geographies consisting of 52,697,039 people shows a strong positive correlation between the proportion of Pima and percentage of population with a disability under the age of 5 in the United States with a correlation coefficient (R) of 0.754 and weighted average of 1.1%, a difference of 29.1%.
Disability Age Under 5 Correlation Summary
| Measurement | Immigrants from Scotland | Pima |
| Minimum | 0.88% | 0.81% |
| Maximum | 8.4% | 7.3% |
| Range | 7.5% | 6.5% |
| Mean | 3.6% | 3.1% |
| Median | 3.2% | 1.6% |
| Interquartile 25% (IQ1) | 1.9% | 0.99% |
| Interquartile 75% (IQ3) | 5.1% | 6.3% |
| Interquartile Range (IQR) | 3.2% | 5.3% |
| Standard Deviation (Sample) | 2.1% | 2.9% |
| Standard Deviation (Population) | 2.1% | 2.7% |
Similar Demographics by Disability Age Under 5
Demographics Similar to Immigrants from Scotland by Disability Age Under 5
In terms of disability age under 5, the demographic groups most similar to Immigrants from Scotland are Immigrants from Hungary (1.4%, a difference of 0.040%), African (1.4%, a difference of 0.070%), Bermudan (1.4%, a difference of 0.080%), Eastern European (1.4%, a difference of 0.16%), and Immigrants from England (1.4%, a difference of 0.19%).
| Demographics | Rating | Rank | Disability Age Under 5 |
| Potawatomi | 1.1 /100 | #245 | Tragic 1.4% |
| Russians | 1.0 /100 | #246 | Tragic 1.4% |
| Immigrants | England | 1.0 /100 | #247 | Tragic 1.4% |
| Eastern Europeans | 1.0 /100 | #248 | Tragic 1.4% |
| Bermudans | 1.0 /100 | #249 | Tragic 1.4% |
| Africans | 1.0 /100 | #250 | Tragic 1.4% |
| Immigrants | Hungary | 1.0 /100 | #251 | Tragic 1.4% |
| Immigrants | Scotland | 0.9 /100 | #252 | Tragic 1.4% |
| Australians | 0.7 /100 | #253 | Tragic 1.4% |
| Immigrants | Brazil | 0.7 /100 | #254 | Tragic 1.4% |
| Immigrants | Liberia | 0.6 /100 | #255 | Tragic 1.4% |
| Immigrants | Western Europe | 0.5 /100 | #256 | Tragic 1.4% |
| Slovenes | 0.3 /100 | #257 | Tragic 1.4% |
| Costa Ricans | 0.3 /100 | #258 | Tragic 1.4% |
| Immigrants | Southern Europe | 0.3 /100 | #259 | Tragic 1.4% |
Demographics Similar to Pima by Disability Age Under 5
In terms of disability age under 5, the demographic groups most similar to Pima are Immigrants from Bulgaria (1.1%, a difference of 0.010%), Immigrants from Asia (1.1%, a difference of 0.090%), Thai (1.1%, a difference of 0.11%), Immigrants from Turkey (1.1%, a difference of 0.32%), and Immigrants from Albania (1.1%, a difference of 0.52%).
| Demographics | Rating | Rank | Disability Age Under 5 |
| Immigrants | Nepal | 99.9 /100 | #36 | Exceptional 1.0% |
| Immigrants | India | 99.9 /100 | #37 | Exceptional 1.0% |
| Immigrants | Guyana | 99.9 /100 | #38 | Exceptional 1.0% |
| Filipinos | 99.9 /100 | #39 | Exceptional 1.1% |
| Immigrants | Albania | 99.9 /100 | #40 | Exceptional 1.1% |
| Thais | 99.8 /100 | #41 | Exceptional 1.1% |
| Immigrants | Bulgaria | 99.8 /100 | #42 | Exceptional 1.1% |
| Pima | 99.8 /100 | #43 | Exceptional 1.1% |
| Immigrants | Asia | 99.8 /100 | #44 | Exceptional 1.1% |
| Immigrants | Turkey | 99.8 /100 | #45 | Exceptional 1.1% |
| Immigrants | Congo | 99.8 /100 | #46 | Exceptional 1.1% |
| Immigrants | Sweden | 99.8 /100 | #47 | Exceptional 1.1% |
| Immigrants | Singapore | 99.7 /100 | #48 | Exceptional 1.1% |
| Immigrants | Russia | 99.7 /100 | #49 | Exceptional 1.1% |
| Immigrants | Japan | 99.7 /100 | #50 | Exceptional 1.1% |