Immigrants from Senegal vs Immigrants from Ghana Disability Age Under 5
COMPARE
Immigrants from Senegal
Immigrants from Ghana
Disability Age Under 5
Disability Age Under 5 Comparison
Immigrants from Senegal
Immigrants from Ghana
1.2%
DISABILITY AGE UNDER 5
91.4/ 100
METRIC RATING
121st/ 347
METRIC RANK
1.2%
DISABILITY AGE UNDER 5
68.7/ 100
METRIC RATING
155th/ 347
METRIC RANK
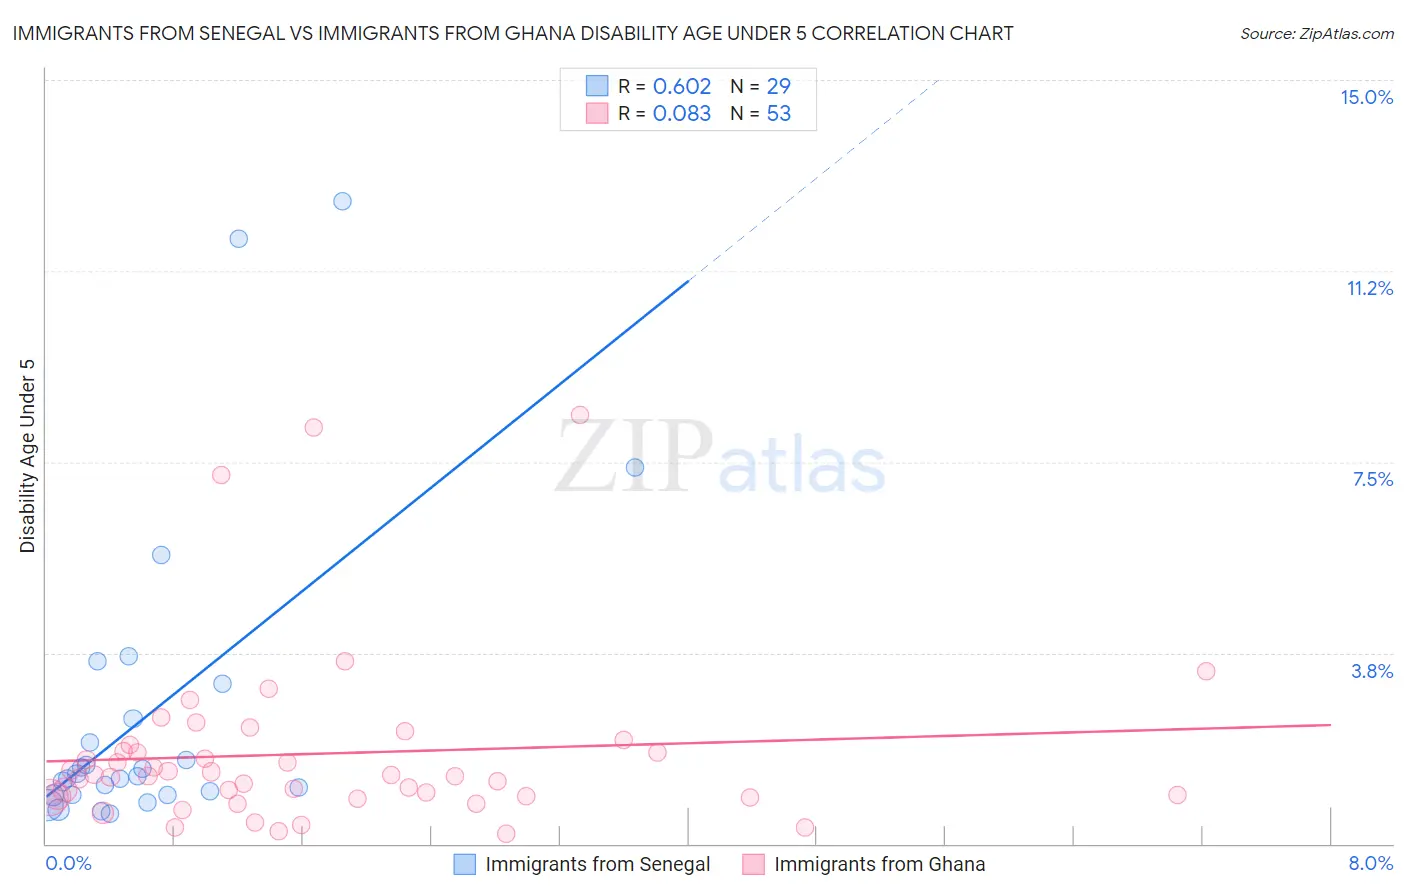
Immigrants from Senegal vs Immigrants from Ghana Disability Age Under 5 Correlation Chart
The statistical analysis conducted on geographies consisting of 70,932,249 people shows a significant positive correlation between the proportion of Immigrants from Senegal and percentage of population with a disability under the age of 5 in the United States with a correlation coefficient (R) of 0.602 and weighted average of 1.2%. Similarly, the statistical analysis conducted on geographies consisting of 133,499,136 people shows a slight positive correlation between the proportion of Immigrants from Ghana and percentage of population with a disability under the age of 5 in the United States with a correlation coefficient (R) of 0.083 and weighted average of 1.2%, a difference of 3.8%.
Disability Age Under 5 Correlation Summary
| Measurement | Immigrants from Senegal | Immigrants from Ghana |
| Minimum | 0.59% | 0.20% |
| Maximum | 12.6% | 8.4% |
| Range | 12.0% | 8.2% |
| Mean | 2.6% | 1.8% |
| Median | 1.3% | 1.3% |
| Interquartile 25% (IQ1) | 0.96% | 0.92% |
| Interquartile 75% (IQ3) | 2.8% | 1.9% |
| Interquartile Range (IQR) | 1.8% | 0.96% |
| Standard Deviation (Sample) | 3.1% | 1.7% |
| Standard Deviation (Population) | 3.0% | 1.7% |
Similar Demographics by Disability Age Under 5
Demographics Similar to Immigrants from Senegal by Disability Age Under 5
In terms of disability age under 5, the demographic groups most similar to Immigrants from Senegal are Aleut (1.2%, a difference of 0.19%), Zimbabwean (1.2%, a difference of 0.24%), Immigrants from Cambodia (1.2%, a difference of 0.26%), Immigrants from Eritrea (1.2%, a difference of 0.28%), and Japanese (1.2%, a difference of 0.32%).
| Demographics | Rating | Rank | Disability Age Under 5 |
| Belizeans | 93.9 /100 | #114 | Exceptional 1.2% |
| Immigrants | Caribbean | 93.8 /100 | #115 | Exceptional 1.2% |
| Immigrants | Northern Africa | 93.8 /100 | #116 | Exceptional 1.2% |
| Immigrants | Philippines | 93.5 /100 | #117 | Exceptional 1.2% |
| Immigrants | Venezuela | 93.4 /100 | #118 | Exceptional 1.2% |
| Bhutanese | 92.5 /100 | #119 | Exceptional 1.2% |
| Immigrants | Eritrea | 92.3 /100 | #120 | Exceptional 1.2% |
| Immigrants | Senegal | 91.4 /100 | #121 | Exceptional 1.2% |
| Aleuts | 90.7 /100 | #122 | Exceptional 1.2% |
| Zimbabweans | 90.6 /100 | #123 | Exceptional 1.2% |
| Immigrants | Cambodia | 90.5 /100 | #124 | Exceptional 1.2% |
| Japanese | 90.3 /100 | #125 | Exceptional 1.2% |
| Central Americans | 89.7 /100 | #126 | Excellent 1.2% |
| Immigrants | Romania | 88.4 /100 | #127 | Excellent 1.2% |
| Immigrants | France | 88.4 /100 | #128 | Excellent 1.2% |
Demographics Similar to Immigrants from Ghana by Disability Age Under 5
In terms of disability age under 5, the demographic groups most similar to Immigrants from Ghana are Uruguayan (1.2%, a difference of 0.010%), Hawaiian (1.2%, a difference of 0.020%), Immigrants from Thailand (1.2%, a difference of 0.080%), Immigrants from South America (1.2%, a difference of 0.18%), and Arab (1.2%, a difference of 0.24%).
| Demographics | Rating | Rank | Disability Age Under 5 |
| Ghanaians | 76.3 /100 | #148 | Good 1.2% |
| Kenyans | 75.9 /100 | #149 | Good 1.2% |
| South Americans | 75.6 /100 | #150 | Good 1.2% |
| Yaqui | 74.8 /100 | #151 | Good 1.2% |
| Hondurans | 72.5 /100 | #152 | Good 1.2% |
| Immigrants | Thailand | 69.4 /100 | #153 | Good 1.2% |
| Uruguayans | 68.8 /100 | #154 | Good 1.2% |
| Immigrants | Ghana | 68.7 /100 | #155 | Good 1.2% |
| Hawaiians | 68.5 /100 | #156 | Good 1.2% |
| Immigrants | South America | 67.0 /100 | #157 | Good 1.2% |
| Arabs | 66.4 /100 | #158 | Good 1.2% |
| Colombians | 65.8 /100 | #159 | Good 1.2% |
| Immigrants | Latin America | 65.8 /100 | #160 | Good 1.2% |
| Immigrants | Africa | 65.1 /100 | #161 | Good 1.2% |
| Guatemalans | 63.6 /100 | #162 | Good 1.2% |