Immigrants from Turkey vs Guyanese Ambulatory Disability
COMPARE
Immigrants from Turkey
Guyanese
Ambulatory Disability
Ambulatory Disability Comparison
Immigrants from Turkey
Guyanese
5.4%
AMBULATORY DISABILITY
100.0/ 100
METRIC RATING
30th/ 347
METRIC RANK
6.6%
AMBULATORY DISABILITY
0.2/ 100
METRIC RATING
266th/ 347
METRIC RANK
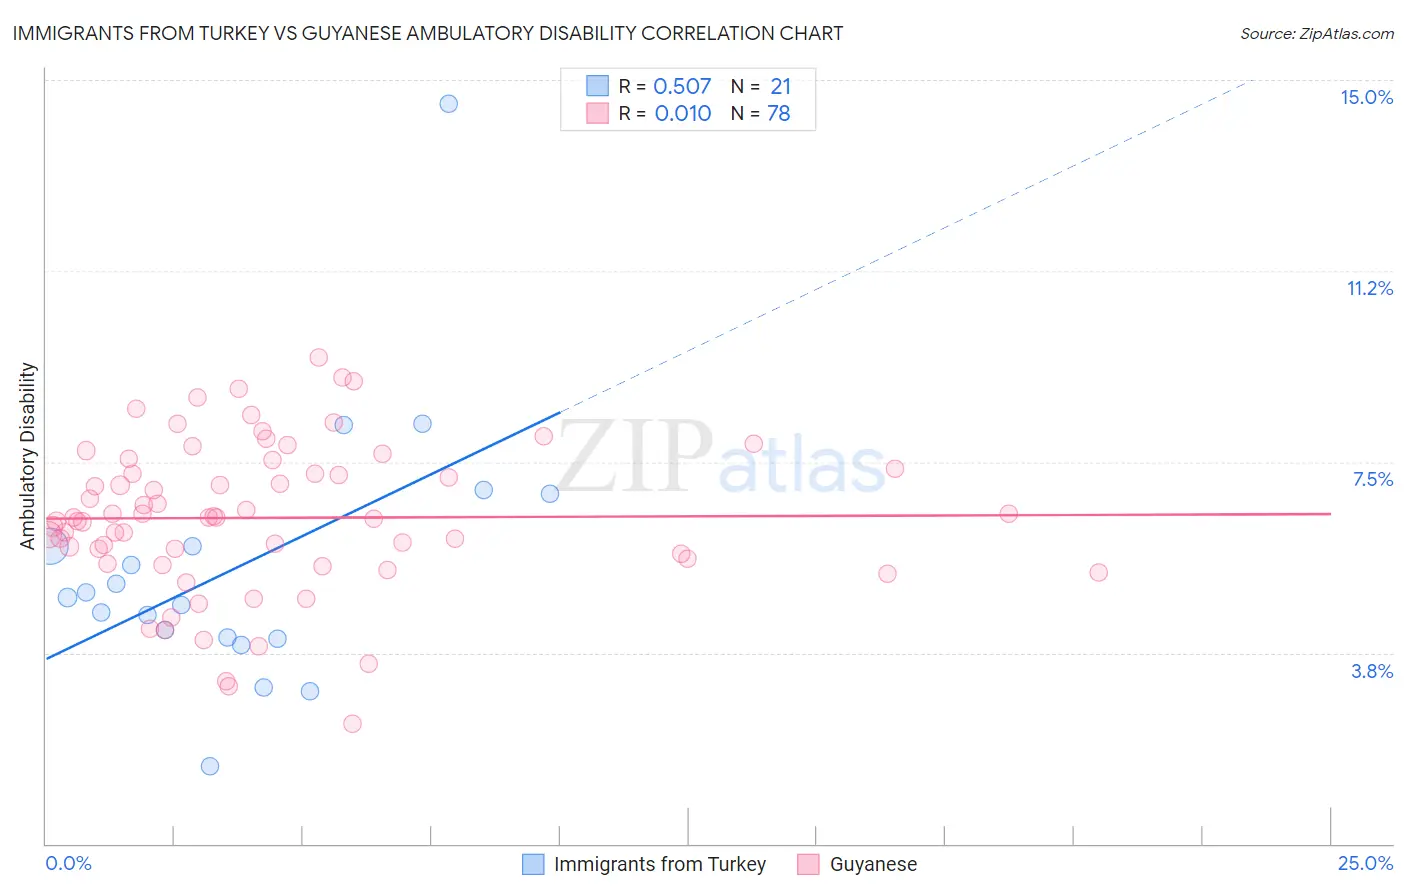
Immigrants from Turkey vs Guyanese Ambulatory Disability Correlation Chart
The statistical analysis conducted on geographies consisting of 223,019,564 people shows a substantial positive correlation between the proportion of Immigrants from Turkey and percentage of population with ambulatory disability in the United States with a correlation coefficient (R) of 0.507 and weighted average of 5.4%. Similarly, the statistical analysis conducted on geographies consisting of 176,872,924 people shows no correlation between the proportion of Guyanese and percentage of population with ambulatory disability in the United States with a correlation coefficient (R) of 0.010 and weighted average of 6.6%, a difference of 21.5%.
Ambulatory Disability Correlation Summary
| Measurement | Immigrants from Turkey | Guyanese |
| Minimum | 1.5% | 2.4% |
| Maximum | 14.5% | 9.5% |
| Range | 13.0% | 7.2% |
| Mean | 5.4% | 6.4% |
| Median | 4.8% | 6.4% |
| Interquartile 25% (IQ1) | 4.0% | 5.6% |
| Interquartile 75% (IQ3) | 6.4% | 7.4% |
| Interquartile Range (IQR) | 2.3% | 1.8% |
| Standard Deviation (Sample) | 2.7% | 1.5% |
| Standard Deviation (Population) | 2.6% | 1.5% |
Similar Demographics by Ambulatory Disability
Demographics Similar to Immigrants from Turkey by Ambulatory Disability
In terms of ambulatory disability, the demographic groups most similar to Immigrants from Turkey are Immigrants from Venezuela (5.4%, a difference of 0.020%), Immigrants from Australia (5.5%, a difference of 0.19%), Immigrants from Pakistan (5.5%, a difference of 0.31%), Immigrants from Asia (5.5%, a difference of 0.47%), and Afghan (5.5%, a difference of 0.51%).
| Demographics | Rating | Rank | Ambulatory Disability |
| Tongans | 100.0 /100 | #23 | Exceptional 5.4% |
| Immigrants | Saudi Arabia | 100.0 /100 | #24 | Exceptional 5.4% |
| Zimbabweans | 100.0 /100 | #25 | Exceptional 5.4% |
| Immigrants | Nepal | 100.0 /100 | #26 | Exceptional 5.4% |
| Asians | 100.0 /100 | #27 | Exceptional 5.4% |
| Cambodians | 100.0 /100 | #28 | Exceptional 5.4% |
| Immigrants | Iran | 100.0 /100 | #29 | Exceptional 5.4% |
| Immigrants | Turkey | 100.0 /100 | #30 | Exceptional 5.4% |
| Immigrants | Venezuela | 100.0 /100 | #31 | Exceptional 5.4% |
| Immigrants | Australia | 100.0 /100 | #32 | Exceptional 5.5% |
| Immigrants | Pakistan | 100.0 /100 | #33 | Exceptional 5.5% |
| Immigrants | Asia | 100.0 /100 | #34 | Exceptional 5.5% |
| Afghans | 100.0 /100 | #35 | Exceptional 5.5% |
| Immigrants | Malaysia | 100.0 /100 | #36 | Exceptional 5.5% |
| Turks | 100.0 /100 | #37 | Exceptional 5.5% |
Demographics Similar to Guyanese by Ambulatory Disability
In terms of ambulatory disability, the demographic groups most similar to Guyanese are Bahamian (6.6%, a difference of 0.12%), Trinidadian and Tobagonian (6.6%, a difference of 0.13%), Spanish (6.6%, a difference of 0.14%), Nepalese (6.6%, a difference of 0.18%), and French (6.6%, a difference of 0.45%).
| Demographics | Rating | Rank | Ambulatory Disability |
| Aleuts | 0.4 /100 | #259 | Tragic 6.6% |
| Immigrants | Belize | 0.4 /100 | #260 | Tragic 6.6% |
| Irish | 0.4 /100 | #261 | Tragic 6.6% |
| English | 0.4 /100 | #262 | Tragic 6.6% |
| Hmong | 0.3 /100 | #263 | Tragic 6.6% |
| Nepalese | 0.2 /100 | #264 | Tragic 6.6% |
| Bahamians | 0.2 /100 | #265 | Tragic 6.6% |
| Guyanese | 0.2 /100 | #266 | Tragic 6.6% |
| Trinidadians and Tobagonians | 0.2 /100 | #267 | Tragic 6.6% |
| Spanish | 0.2 /100 | #268 | Tragic 6.6% |
| French | 0.1 /100 | #269 | Tragic 6.6% |
| Slovaks | 0.1 /100 | #270 | Tragic 6.7% |
| Immigrants | Trinidad and Tobago | 0.1 /100 | #271 | Tragic 6.7% |
| French Canadians | 0.1 /100 | #272 | Tragic 6.7% |
| Whites/Caucasians | 0.1 /100 | #273 | Tragic 6.7% |