Immigrants from Yemen vs Tlingit-Haida Disability
COMPARE
Immigrants from Yemen
Tlingit-Haida
Disability
Disability Comparison
Immigrants from Yemen
Tlingit-Haida
12.6%
DISABILITY
0.1/ 100
METRIC RATING
271st/ 347
METRIC RANK
13.5%
DISABILITY
0.0/ 100
METRIC RATING
309th/ 347
METRIC RANK
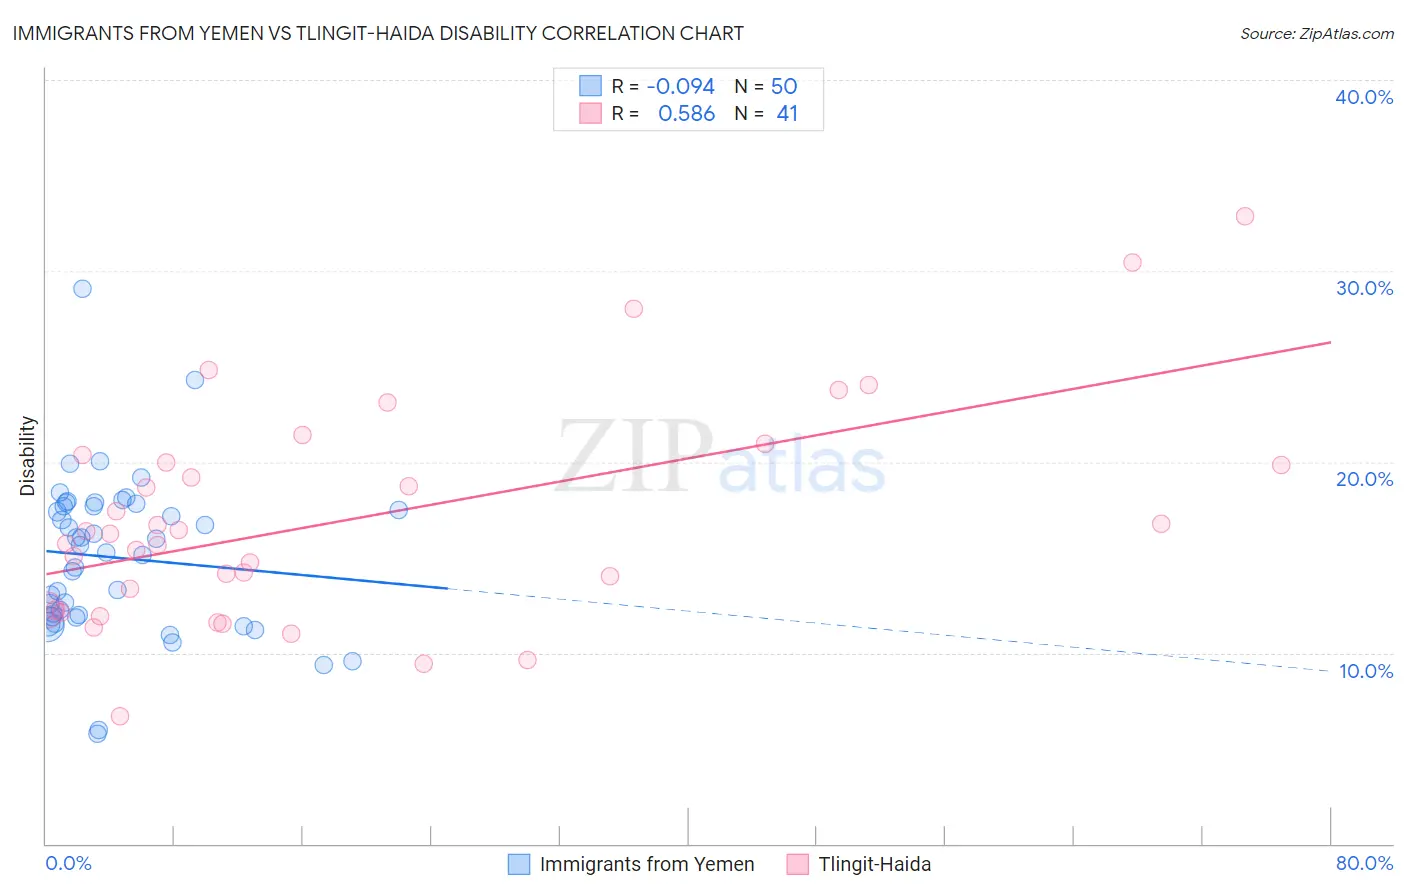
Immigrants from Yemen vs Tlingit-Haida Disability Correlation Chart
The statistical analysis conducted on geographies consisting of 82,432,981 people shows a slight negative correlation between the proportion of Immigrants from Yemen and percentage of population with a disability in the United States with a correlation coefficient (R) of -0.094 and weighted average of 12.6%. Similarly, the statistical analysis conducted on geographies consisting of 60,854,514 people shows a substantial positive correlation between the proportion of Tlingit-Haida and percentage of population with a disability in the United States with a correlation coefficient (R) of 0.586 and weighted average of 13.5%, a difference of 7.2%.
Disability Correlation Summary
| Measurement | Immigrants from Yemen | Tlingit-Haida |
| Minimum | 5.8% | 6.7% |
| Maximum | 29.1% | 32.8% |
| Range | 23.3% | 26.1% |
| Mean | 15.0% | 17.0% |
| Median | 15.5% | 16.3% |
| Interquartile 25% (IQ1) | 11.9% | 12.2% |
| Interquartile 75% (IQ3) | 17.7% | 20.2% |
| Interquartile Range (IQR) | 5.8% | 8.0% |
| Standard Deviation (Sample) | 4.2% | 5.7% |
| Standard Deviation (Population) | 4.1% | 5.7% |
Similar Demographics by Disability
Demographics Similar to Immigrants from Yemen by Disability
In terms of disability, the demographic groups most similar to Immigrants from Yemen are Portuguese (12.6%, a difference of 0.050%), Immigrants from Dominican Republic (12.6%, a difference of 0.44%), Dominican (12.7%, a difference of 0.49%), Bangladeshi (12.6%, a difference of 0.53%), and Finnish (12.7%, a difference of 0.66%).
| Demographics | Rating | Rank | Disability |
| Immigrants | Germany | 0.2 /100 | #264 | Tragic 12.5% |
| U.S. Virgin Islanders | 0.2 /100 | #265 | Tragic 12.5% |
| Czechoslovakians | 0.2 /100 | #266 | Tragic 12.5% |
| Spaniards | 0.2 /100 | #267 | Tragic 12.5% |
| Bangladeshis | 0.1 /100 | #268 | Tragic 12.6% |
| Immigrants | Dominican Republic | 0.1 /100 | #269 | Tragic 12.6% |
| Portuguese | 0.1 /100 | #270 | Tragic 12.6% |
| Immigrants | Yemen | 0.1 /100 | #271 | Tragic 12.6% |
| Dominicans | 0.0 /100 | #272 | Tragic 12.7% |
| Finns | 0.0 /100 | #273 | Tragic 12.7% |
| Nepalese | 0.0 /100 | #274 | Tragic 12.8% |
| Sioux | 0.0 /100 | #275 | Tragic 12.8% |
| Hmong | 0.0 /100 | #276 | Tragic 12.8% |
| Dutch | 0.0 /100 | #277 | Tragic 12.8% |
| Germans | 0.0 /100 | #278 | Tragic 12.8% |
Demographics Similar to Tlingit-Haida by Disability
In terms of disability, the demographic groups most similar to Tlingit-Haida are French American Indian (13.5%, a difference of 0.080%), Shoshone (13.5%, a difference of 0.18%), Cape Verdean (13.5%, a difference of 0.23%), Blackfeet (13.6%, a difference of 0.53%), and Delaware (13.6%, a difference of 0.56%).
| Demographics | Rating | Rank | Disability |
| Arapaho | 0.0 /100 | #302 | Tragic 13.2% |
| Scotch-Irish | 0.0 /100 | #303 | Tragic 13.3% |
| Yakama | 0.0 /100 | #304 | Tragic 13.4% |
| French Canadians | 0.0 /100 | #305 | Tragic 13.4% |
| Cape Verdeans | 0.0 /100 | #306 | Tragic 13.5% |
| Shoshone | 0.0 /100 | #307 | Tragic 13.5% |
| French American Indians | 0.0 /100 | #308 | Tragic 13.5% |
| Tlingit-Haida | 0.0 /100 | #309 | Tragic 13.5% |
| Blackfeet | 0.0 /100 | #310 | Tragic 13.6% |
| Delaware | 0.0 /100 | #311 | Tragic 13.6% |
| Spanish Americans | 0.0 /100 | #312 | Tragic 13.6% |
| Cree | 0.0 /100 | #313 | Tragic 13.7% |
| Blacks/African Americans | 0.0 /100 | #314 | Tragic 13.7% |
| Puget Sound Salish | 0.0 /100 | #315 | Tragic 13.7% |
| Pima | 0.0 /100 | #316 | Tragic 13.7% |